Abstract
The gateway in-street sign configuration has been demonstrated to be a low-cost method for increasing motorist yielding the right of way to pedestrians at crosswalks. It has previously been hypothesized that the gateway is effective because it visually narrows a travel lane. In the present study, gateway widths (i.e., distance between signs) were compared to determine whether there was a differential effect on motorist yielding. Experiment 1 was a parametric analysis of distance between the signs, varying in 2-ft intervals from 12 to 18 ft. The results showed that the percentage of motorists yielding increased as the distance between the signs decreased. Experiment 2 examined curb-top and gutter-pan placements of the edge signs at three different sites. Both placements produced substantial increases in yielding compared with baseline, though the difference between gutter-pan and curb-top placement was not significant at two of the three sites. Based on the distance between signs in these two configurations, the results at two of the sites aligned with those in Experiment 1, and one site demonstrated much higher yielding than would have been predicted. This suggests that small increases in the distance between signs may result in a minor decrease in yielding but may improve the survivability of the signs and reduce maintenance costs over time. The potential to combine this sign effect with other engineering treatments (e.g., curb extensions and bicycle lanes) was additionally explored. The results are discussed in relation to a perceived narrowing hypothesis, sign survival, cost effectiveness, and equity.
Keywords: pedestrians, bicycles, human factors, crossing, safety
According to the National Highway Traffic Safety Administration, in 2020 there were 6,516 pedestrians killed and an additional 54,769 were injured by a motor vehicle (1). Over the last decade, pedestrian fatalities have increased by 46%, and have risen from 14% to 17% as a proportion of traffic fatalities. In 2020, 75% of pedestrian fatalities occurred at roadway locations that were not at intersections (1). Previous research has shown that treatments that increase yielding the right of way to pedestrians reduce conflicts between vehicles and pedestrians and as such these interventions are important components of prevention efforts (2–5).
One intervention that has been effective at increasing yielding to pedestrians is the R1–6 in-street sign (6) (Figure 1). These in-street signs have been used in several city-wide, high-visibility enforcement (HVE) campaigns in Florida (7, 8), Michigan, Minnesota (9), and North Carolina (10). Such HVE campaigns combine publicity and awareness initiatives with visibility elements (e.g., signs and public posting of feedback), as well as periods of targeted enforcement.
Figure 1.
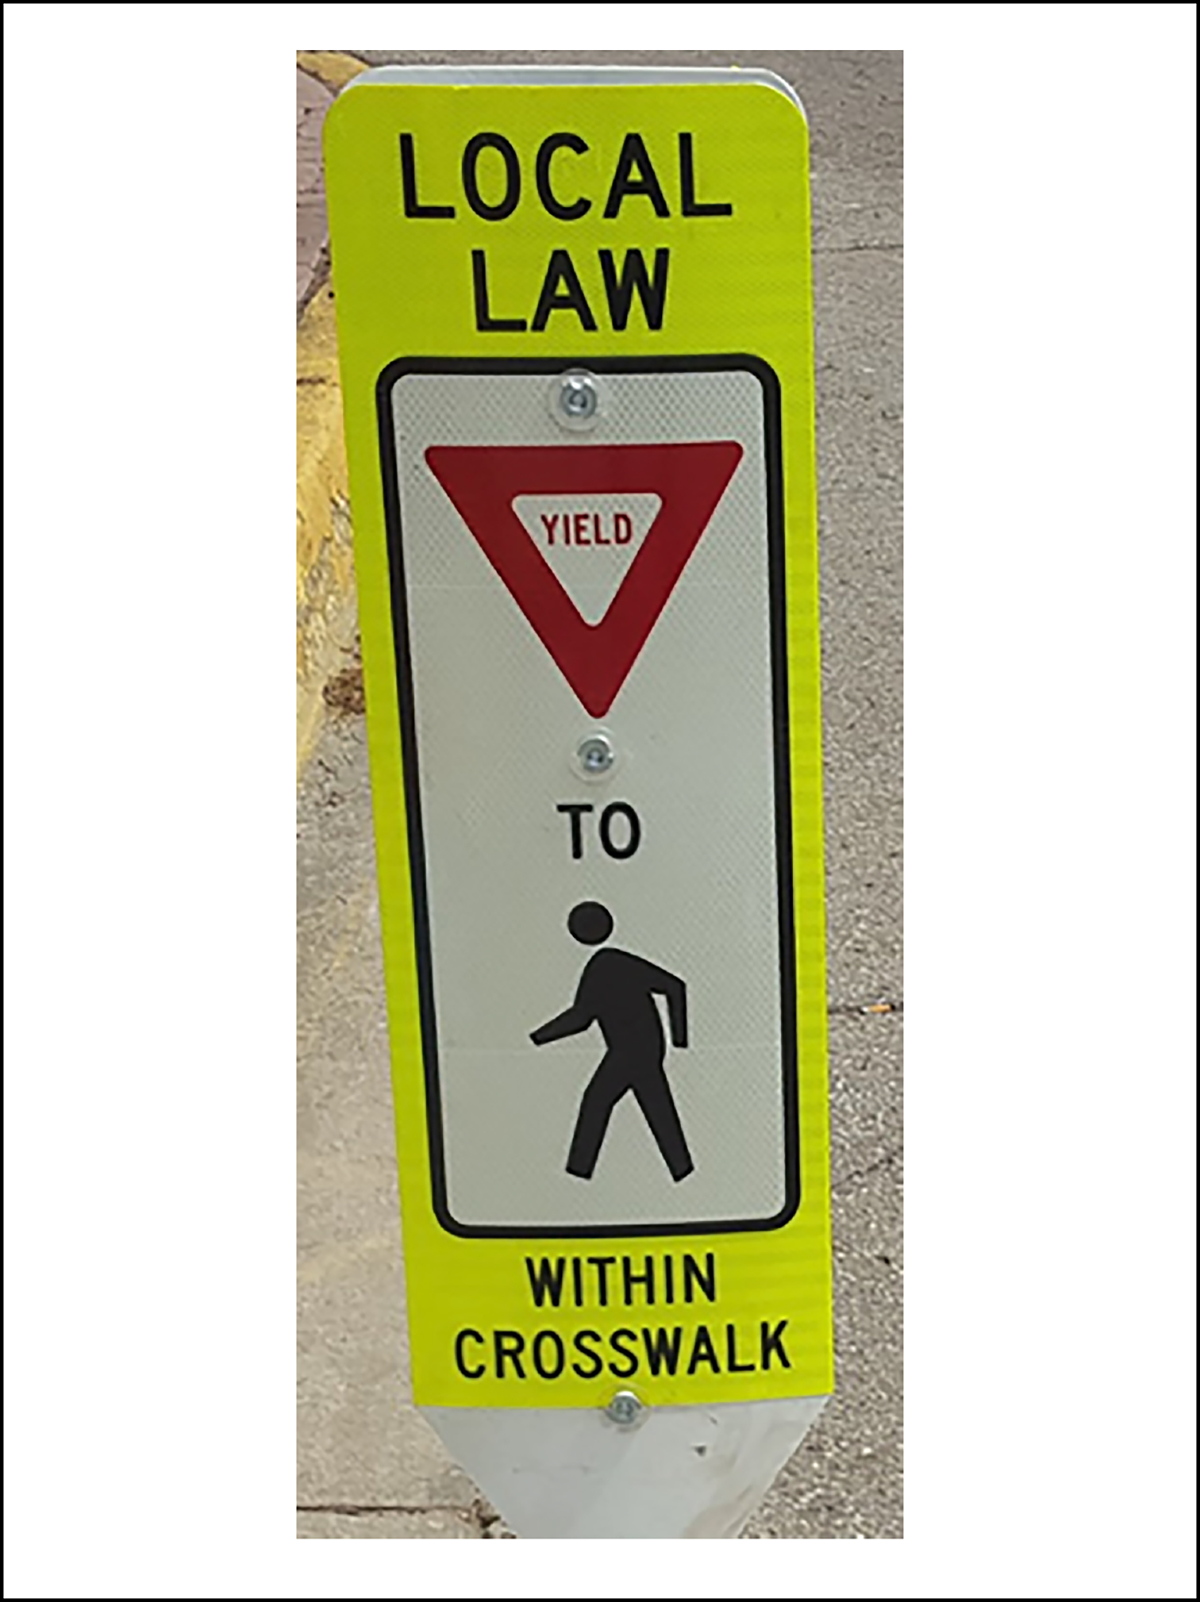
An R1–6 in-street sign.
A placement of the in-street signs that has been found particularly effective in studies that isolate the effects of the sign is the gateway configuration (11). The gateway configuration places a sign on both edges of the roadway and on each lane line. This arrangement of signs requires a vehicle to pass between two signs flanking their travel lane when traversing a pedestrian crosswalk. The initial examination of the gateway configuration found a substantial increase in yielding compared with a standard centerline only placement and resulted in similar rates of yielding as much more costly pedestrian crossing interventions such as the pedestrian hybrid beacon (PHB; $100,000) and the rectangular rapid flashing beacon (RRFB; $20,000) (11). In contrast, the R1–6 sign costs approximately $200 (12, 13) and full gateway installations are estimated at $1,200 to $1,800 for a six-sign configuration (14). This comparable rate of yielding between the gateway and more expensive pedestrian crossing interventions has since been replicated by others (15).
Compared with a single centerline placement of the sign, the gateway requires several signs equal to the number of lanes plus one for each travel direction. To explore variables related to the effectiveness of these sign configurations, Bennett and Van Houten compared the gateway configuration to other configurations in which some of the signs were removed, placing them only on the white lane lines or on the centerline and edges of the road (16). Representations of the gateway and the partial gateway configurations appear in Figure 2. Baseline yielding (i.e., no R1–6 signs present) averaged 7%, but yielding increased to 79% in the gateway configuration (Figure 2a). When signs were removed to create the white lane lines only configuration (Figure 2b), yielding decreased to 52%. In the centerline with edge signs configuration (Figure 2c), yielding fell further to 36%. Given that the white lane line only configuration produced higher yielding than the centerline with edge signs configuration, it is unlikely that the number of signs was the sole contributor to these differences, as the more effective of the two configurations used half the number of signs.
Figure 2.
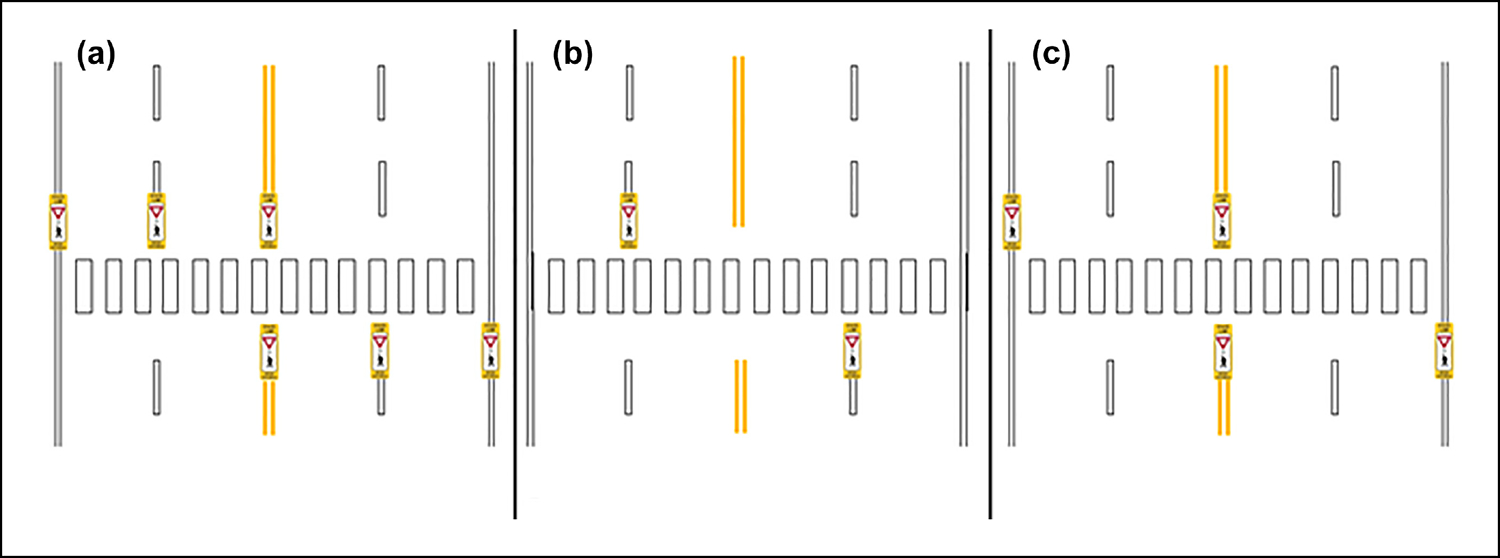
Depictions of R1–6 in-street sign placements in Bennett and Van Houten (16): (a) gateway, (b) white lane line only, and (c) centerline with edge.
Another variable that arises from manipulating the sign configuration is the available width of road (i.e., the pavement available in each travel direction free of barriers or other vehicles). For example, in the centerline with edge signs configuration (Figure 2c), the available width of road is similar to when there are no in-street signs present. In the left lane, moving left (i.e., across the centerline) can result in contact with oncoming traffic, but moving to the right lane is possible. Similarly, motorists in the right lane are restricted from moving farther right because of the curb, but they can move into the left lane. In effect, all the pavement designated for that travel direction remained available. On the other hand, placement of the signs on the white lane line only (Figure 2b) may have been comparatively more limiting. In this configuration, a vehicle moving farther left in the left lane would result in contact with oncoming traffic and moving right would result in striking the sign. Likewise, a vehicle in the right lane would either strike the sign or the curb if maneuvering to the left or right. This suggests that the presence of the sign, in addition to prompting yielding to pedestrians, may also act to restrict the available width of road or lane where it is placed.
Bennett and Van Houten hypothesized that the gateway configuration resulted in a perceived narrowing of lanes at the crosswalk, suggested that narrowing may be responsible for the increase in yielding, and it might be associated with a reduction in vehicle speed (i.e., traffic calming) (16). This traffic calming effect of the gateway has been shown in a subsequent study (12). However, when Bennett and Van Houten replaced the R1–6 signs with reflective, yellow-green sign blanks (i.e., without text and symbols), they found that yielding decreased from an average of 80% to an average of 27%. Therefore, the presence of sign-like objects in the road was not the sole factor that produced the effect on yielding. Moreover, replacing the R1–6 signs on the white lane line in the gateway configuration with flexible, yellow-green posts produced only 60% yielding, indicating that the R1–6 sign itself seems to be important in producing the narrowing effect hypothesized by Bennett et al. (11).
Placing signs in the roadway raises other considerations, such as damage to the signs. Previous research has found that damaged gateway sign configurations do not reduce yielding to the level of yielding with no signs present, but yielding performance is lower than in an undamaged gateway (12). This same research found that although some sign-mounting systems (e.g., those flush-mounted on the road surface) are more vulnerable than others, even this less robust option survived when placed on top of a curb. Furthermore, placing signs on the curb may prevent interference to both water-drainage and snow-removal systems. Though the effects of curb-top placement on sign survivability have been assessed, no study to date has isolated the effects of curb-top placement on yielding.
In the sign configurations tested by Bennett and Van Houten, the narrowing effect of the R1–6 gateway was not completely isolated from confounding variables, because changes in distance between the signs were incidental to the removal or addition of signs (16). Apparent differences in distance between signs also might have restricted effective lane width and affected yielding. If true, yielding should decrease as distance between the signs increases. In the present study, we conducted two experiments to investigate the effects of different gateway widths (i.e., distances between the signs). In the first experiment, we systematically decreased the distance between signs in 2-ft intervals. In the second experiment, we applied the information gained in the first experiment to account for existing site characteristics, specifically, the influence of placing edge signs on the curb top or in the gutter pan. Placement of the sign on top of the curb may prevent obstructions in the gutter pan, and could protect types of signs that are more vulnerable to damage (17). However, manipulating the sign placement in this way necessarily results in a small change of the distance between the signs.
Experiment 1: Gateway Width
Participants and Setting
Participants included motorists driving through the crosswalk when a staged pedestrian was present at the listed locations during data collection periods. All behavior recorded was publicly observable and no personal identifying information was collected at any time.
The experiment was conducted in Portage, MI at a site located in the middle of a large park with a high volume of foot and bicycle traffic. The location featured a midblock trail crossing with two-way traffic (east–west) and one lane in each direction. The westbound lane was 16.75-ft wide at the crosswalk. The eastbound lane was 20-ft wide at the crosswalk, and it had a substantially wider paved shoulder compared with the westbound lane. The paved shoulders and absence of a curb allowed for a full range of gateway widths to be tested. The annual average daily traffic (AADT) at this location was 2,700 vpd and the posted speed limit was 30 mph, resulting in a dilemma zone (DZ) (i.e., the distance at which a motorist can make the decision to safely decelerate) of 141 ft. Data were collected in site visits during daylight hours with dry road conditions, as light and weather conditions can affect both visibility and stopping distances. This project was reviewed and approved by Western Michigan University’s Institutional Review Board (Project no. 13–10-28).
Experimental Design
Four different gateway widths were marked in 2-ft intervals. The outer edge sign was then systematically adjusted to produce each gateway width, and the effect on yielding measured. This resulted in gaps between the edges of the R1–6 signs in the gateway configuration of 12ft, 14ft, 16ft, and 18ft (Figure 3). Yielding was also measured in the absence of the R1–6 signs (i.e., baseline). During experimental manipulations of the configurations, these signs were mounted on temporary, portable bases rather than permanently affixed to the road or surrounding surfaces.
Figure 3.
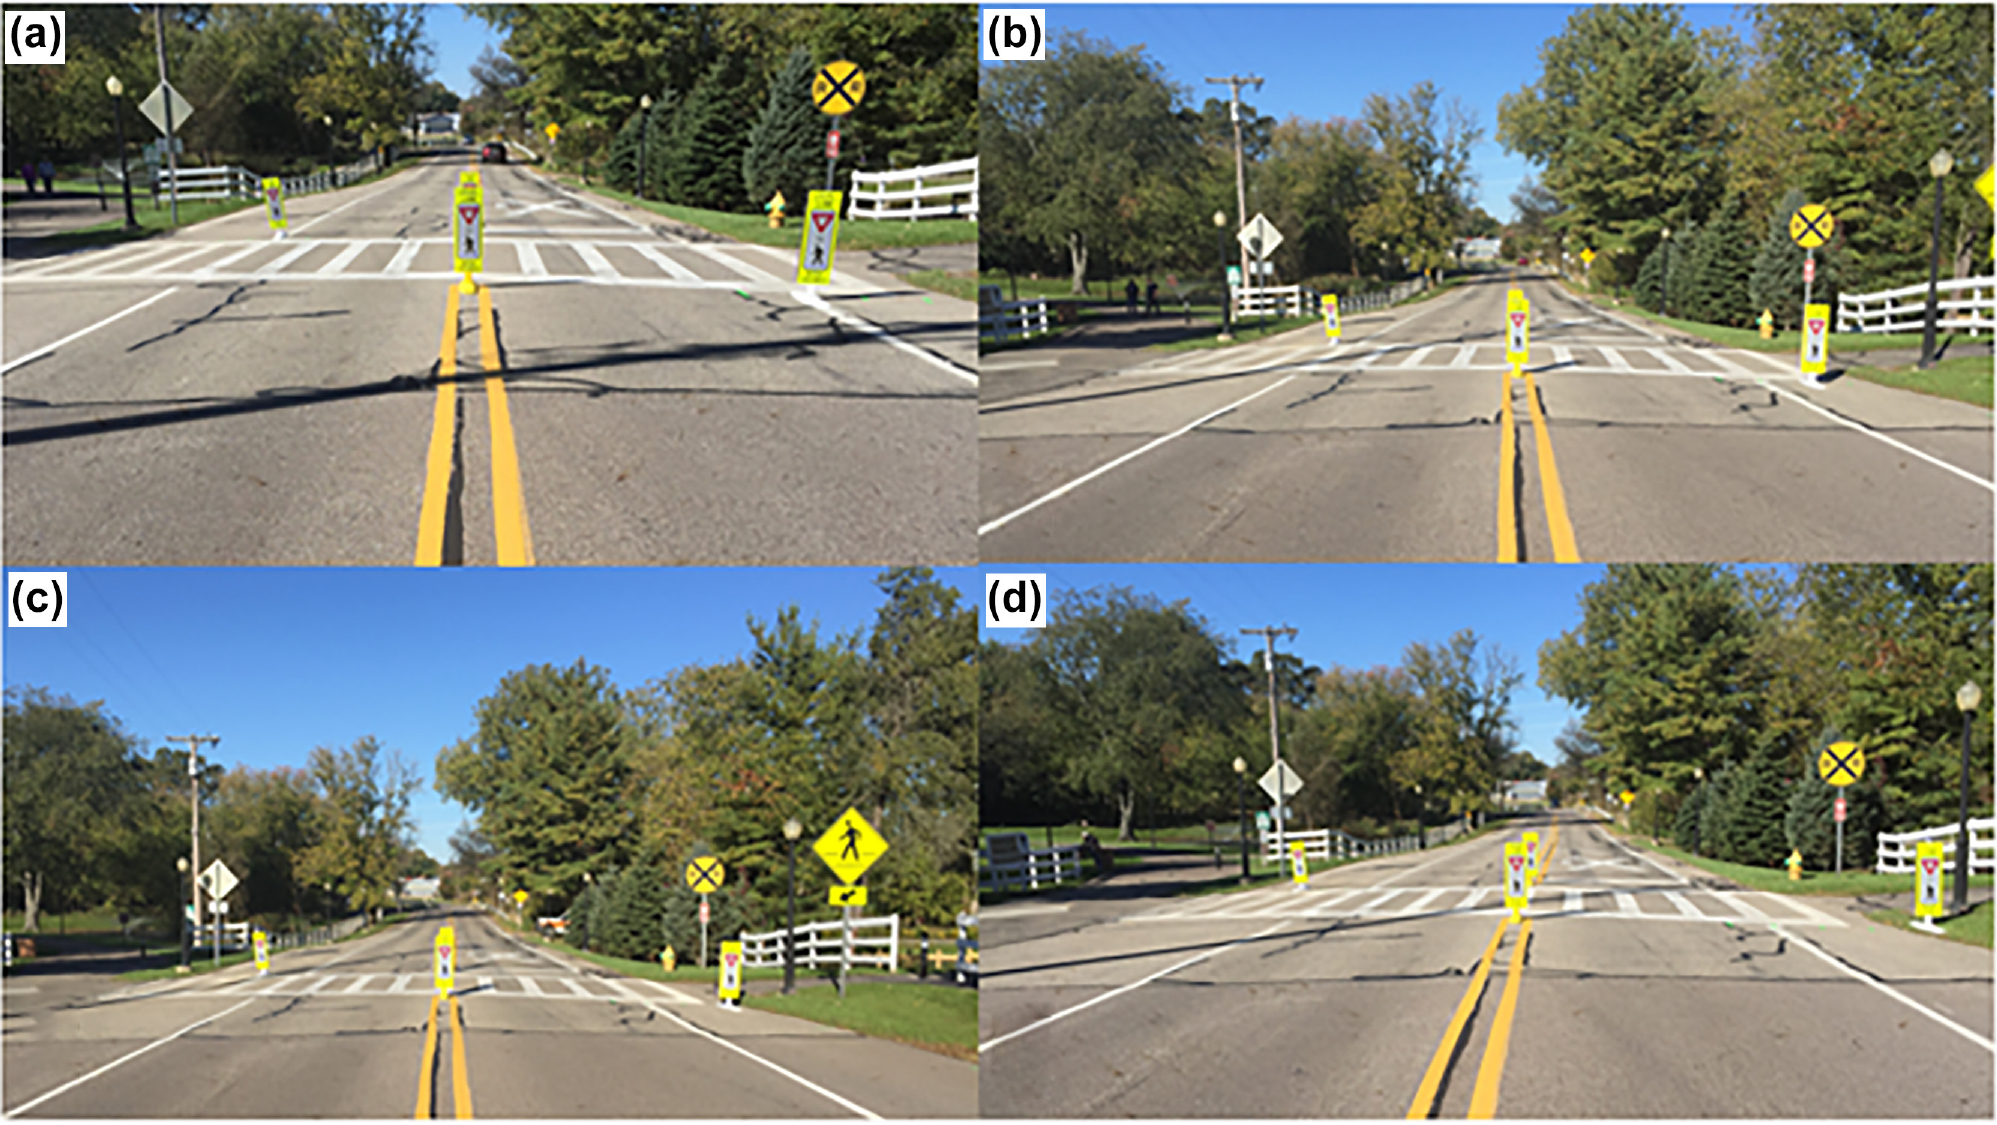
Gateway widths of (a) 12 ft, (b) 14 ft, (c) 16 ft, and (d)18 ft.
Data Collection Procedures
A DZ was marked at the beginning of the data collection sessions. The DZ was calculated using the formula provided by the Institute of Transportation Engineers (18) and utilized by previous studies of yielding. A motorist was scored as yielding if they stopped or slowed sufficiently to allow the researcher to cross at their normal walking speed. Vehicles that had not passed the outer boundary of the DZ when a researcher entered the crosswalk were scored as yielding or not yielding because they had sufficient time and distance to stop safely for the pedestrian. Motorists who entered the DZ before the pedestrian placed a foot in the crosswalk could be scored as yielding but could not be scored as failing to yield because the motorist was not required to yield at this distance.
A staged pedestrian crossing trial began with a researcher timing their approach such that they reached the crosswalk just before a vehicle entered the DZ. The researcher initiated a trial by placing their foot in the crosswalk, indicating their intent to cross. They waited until a motorist yielded, or until all vehicles had passed if no yielding occurred, before beginning to cross the nearest lane. This process was repeated for the next lane. Vehicles outside of the DZ when the researcher passed the halfway point of the first lane were scored for the second lane. A trial was completed when the researcher successfully traversed all lanes, safely reaching the other side of the crosswalk. Staged crossing trials were not conducted when natural pedestrians were present.
Each session consisted of 20 trials (i.e., staged pedestrian crossings) with motorists scored as either “yielding” or “not yielding.” The percentage of yielding was calculated for each session by dividing the number of motorists that yielded during that session by the number of motorists that yielded plus the number of motorists that did not yield during the session. Yielding was measured in nine sessions (i.e., 180 trials) for each condition, including baseline. Across all conditions, a total of 900 trials were completed.
Interobserver agreement was collected during each condition of each experiment. At the beginning of interobserver agreement sessions, one observer was designated as the primary observer; it was this observer’s final yielding percentage that is represented in the data set. During sessions in which interobserver agreement data were collected, each observer stood several feet apart at a location with an unobstructed view of the crosswalk. They independently recorded motorist yielding behavior and did not discuss with each other how they had scored any of the trials until the end of that session. Events that were scored the same were counted as an agreement, and each event scored differently was recorded as a disagreement. Interobserver agreement was assessed by dividing the number of agreements by the number of agreements plus the number of disagreements. The result of this calculation was then converted to a percentage. Interobserver agreement was calculated on 40% of trials, with an average of 97.3% and a range of 92.5% to 100%.
Results and Discussion
Figure 4 shows the mean, median, and range of yielding percentage in each condition. Yielding averaged 29.3% with no gateway (baseline). Yielding increased to 72.6% when signs were placed 18 ft apart, 74.9% at 16ft apart, 79.5% at 14ft apart, and 85.8% at 12ft apart. The difference in average yielding between the widest gap (18 ft) and the narrowest gap (12 ft) was 13.2%, and all gateway widths produced a substantial increase in yielding compared with no gateway. A one-way analysis of variance (ANOVA) was conducted to compare the effect of the baseline and gateway conditions on the percentage of motorists yielding. The assumptions for normality (residual plot) and homogeneity of variance (Levene’s and Bartlett’s tests) were met. There was a statistically significant difference in yielding between at least two of the conditions: F(4,40) < 88.48, p < 0.0001. Tukey’s honestly significant difference (HSD) tests for multiple comparisons found significant differences between baseline and each gateway condition: 12ft (p < 0.0001, 95% confidence interval (CI) < 49.27, 69.66), 14 ft (p < 0.0001, 95% CI < 43.16, 63.55), 16 ft (p < 0.0001, 95% CI < 38.35, 58.74), and 18 ft (p < 0.0001, 95% CI < 35.79, 56.18). Significant differences were also found between the 12 and 18 ft (p < 0.0045, 95% CI < 3.28, 23.68), and 12 and 16 ft (p < 0.0305, 95% CI < 0.73, 21.12) conditions.
Figure 4.
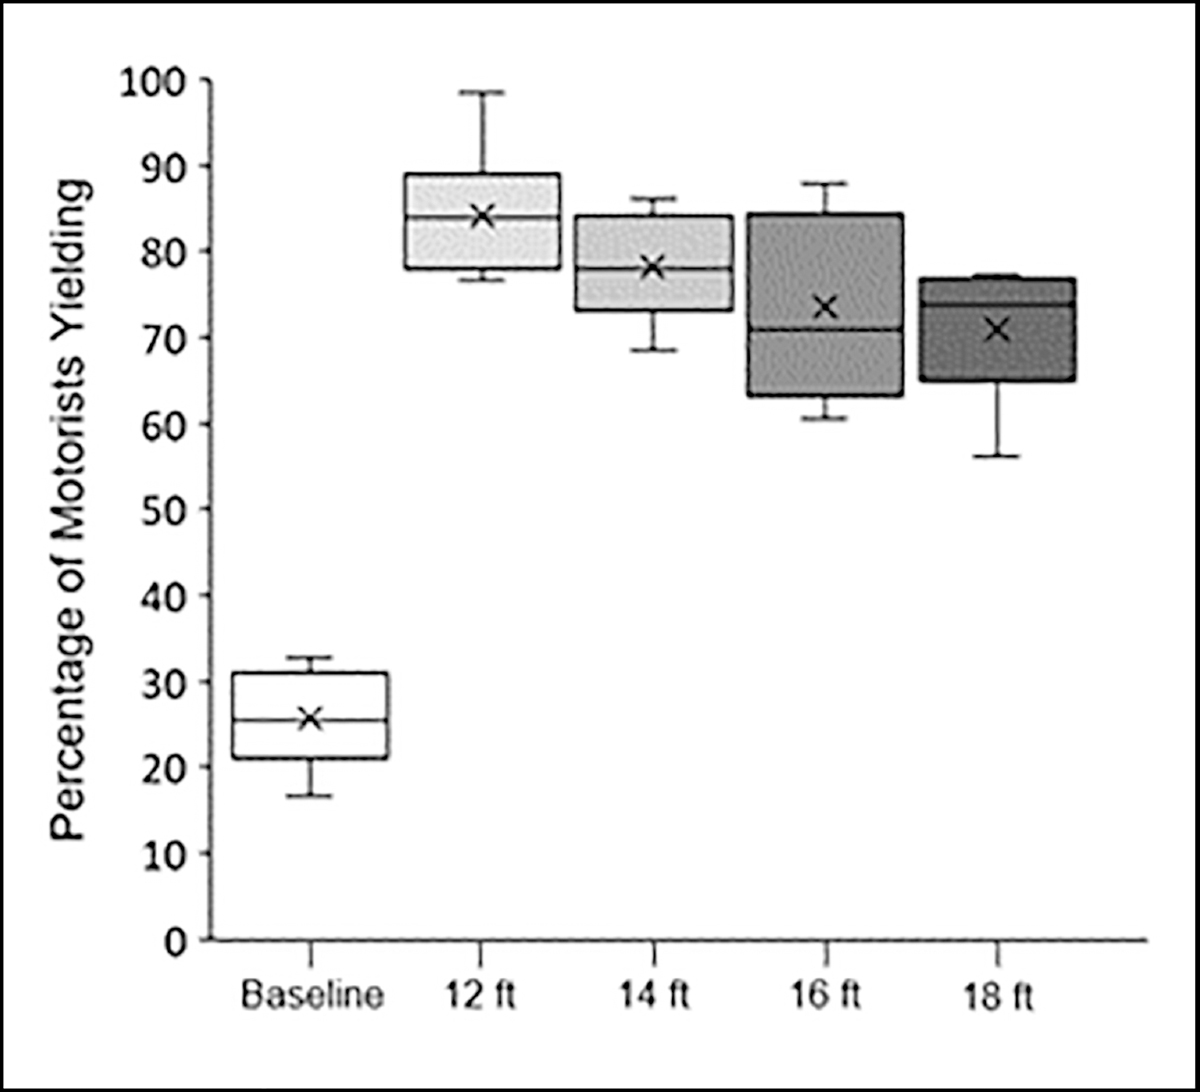
Mean, median, and range of yielding by distance between signs in Experiment 1. All gateway configurations resulted in significant increases in yielding compared with baseline (i.e., no R1–6 signs). As the distance between signs increased, yielding decreased.
A simple linear regression was performed to examine the effect of distance between signs on yielding. Distance between signs predicted yielding: F(1,34) < 15.05, p < .001, R2 < 0.307. Yielding increased as the distance between signs decreased. Figure 5 shows the regression line, confidence, and prediction bands.
Figure 5.
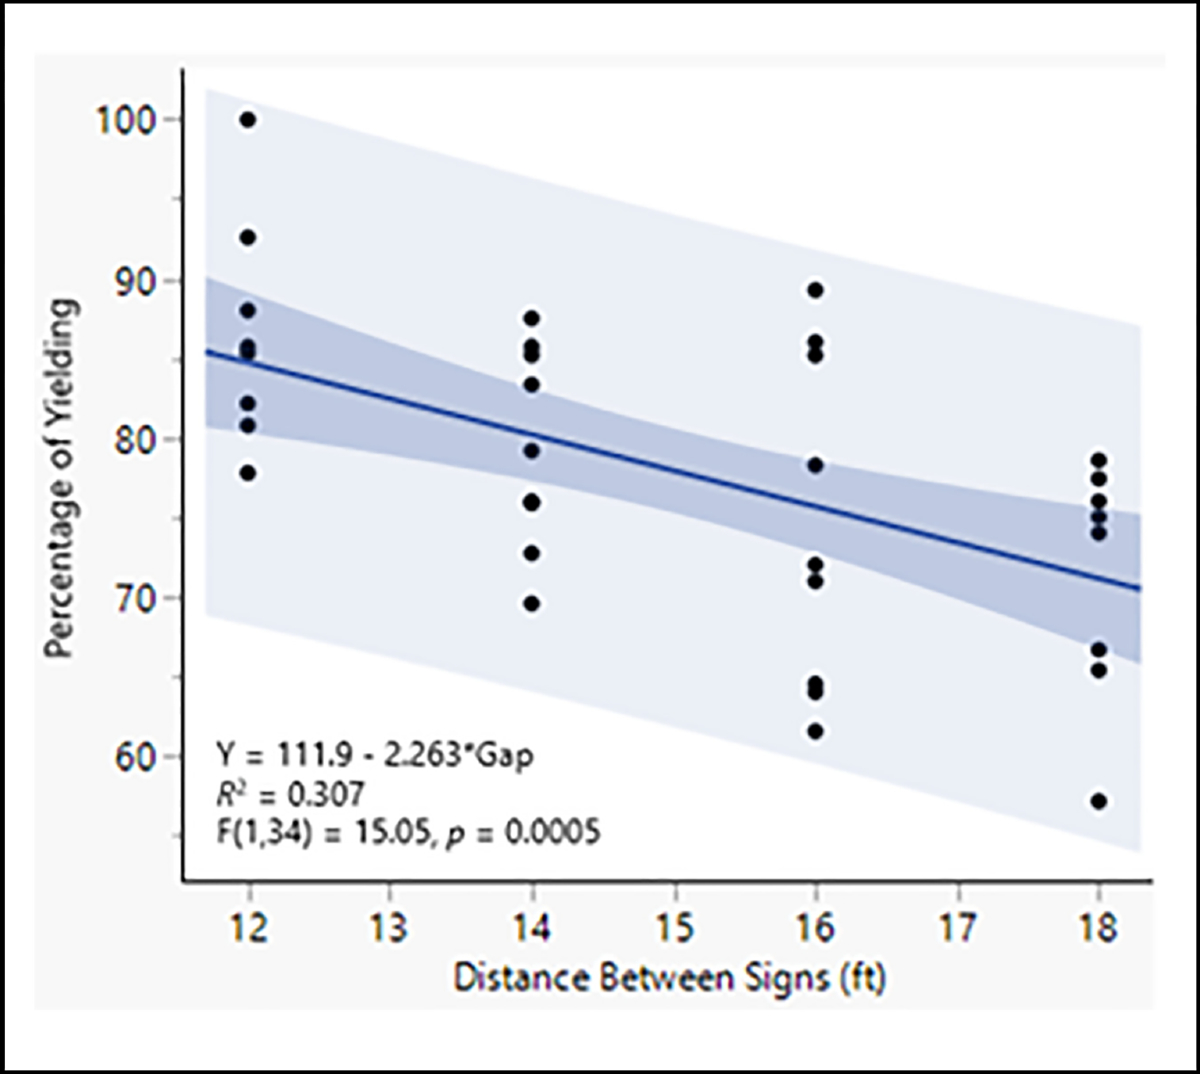
Linear regression of yielding by distance between signs. The dark blue line represents the linear relationship between yielding and distance between the signs. The blue shaded region depicts the confidence band and the light blue the prediction band. The distance between signs accounted for approximately 31% of the difference in yielding.
The results suggested that use of a gateway configuration, regardless of width, significantly increases yielding compared with baseline. Yielding also increased as the width between the signs decreased; however, the relative gain in yielding in narrower gateway configurations may not outweigh the possible reduction in survivability of the signs at a given location. That said, these data were collected from a single site so additional replications would be beneficial, and care should be taken when generalizing the present results.
Experiment 2: Curb Versus Gutter Sign Placements
There was interest from state and city transportation officials in implementing permanent R1–6 gateway installations around Ann Arbor, MI. One consideration is whether to place the sign in the gutter pan (i.e., the flat portion between the curb and road) or on top of the curb. An example of these placements can be seen in Figure 6. These placements also change the distance between the signs. Given the potential benefits of curb-top placements related to sign survival and preventing obstructions to water-drainage and snow-removal, it was important to measure the effect on yielding. Experiment 2 investigated the effects of curb-top and gutter-pan placements of signs in the gateway configuration on yielding to determine the difference between these two configurations. The Michigan Department of Transportation (MDOT) received permission to experiment for use of curb-top placements and approved our use of that placement.
Figure 6.
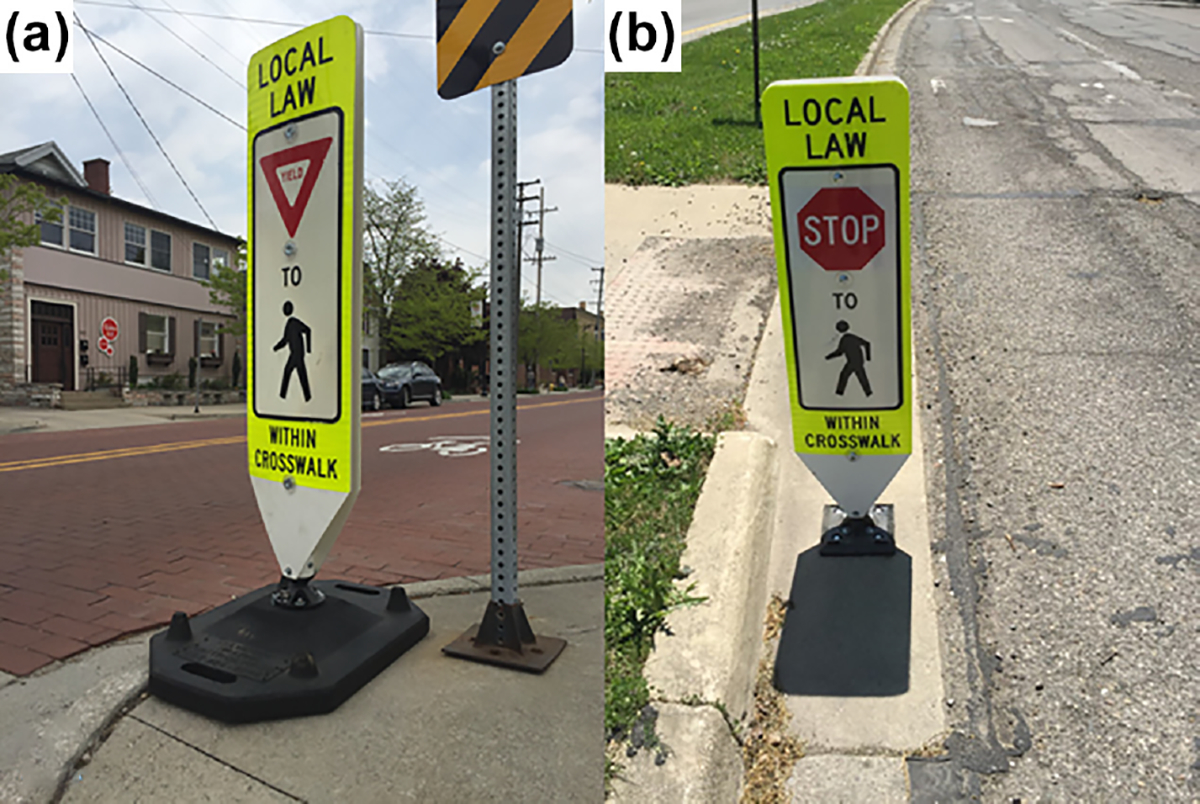
Examples of a (a) curb-top placement of the sign mounted on a temporary base and (b) a gutter-pan placement of the sign installed on a permanent flush mount.
Participants and Setting
Participants included any motorist driving through the crosswalk when a staged pedestrian was present at the listed locations during data collection periods, as in Experiment 1. Three locations in Ann Arbor, MI were selected. Figure 7 shows diagrams of the three locations and the approximate width of each travel lane before sign placement (i.e., in baseline). Site 1 had a north–south orientation, with one lane in each direction and a center turning lane. Both the northbound and southbound lanes included a designated bike lane. The AADT was 3,100, and the posted speed limited was 30 mph, resulting in a 141-ft DZ.
Figure 7.
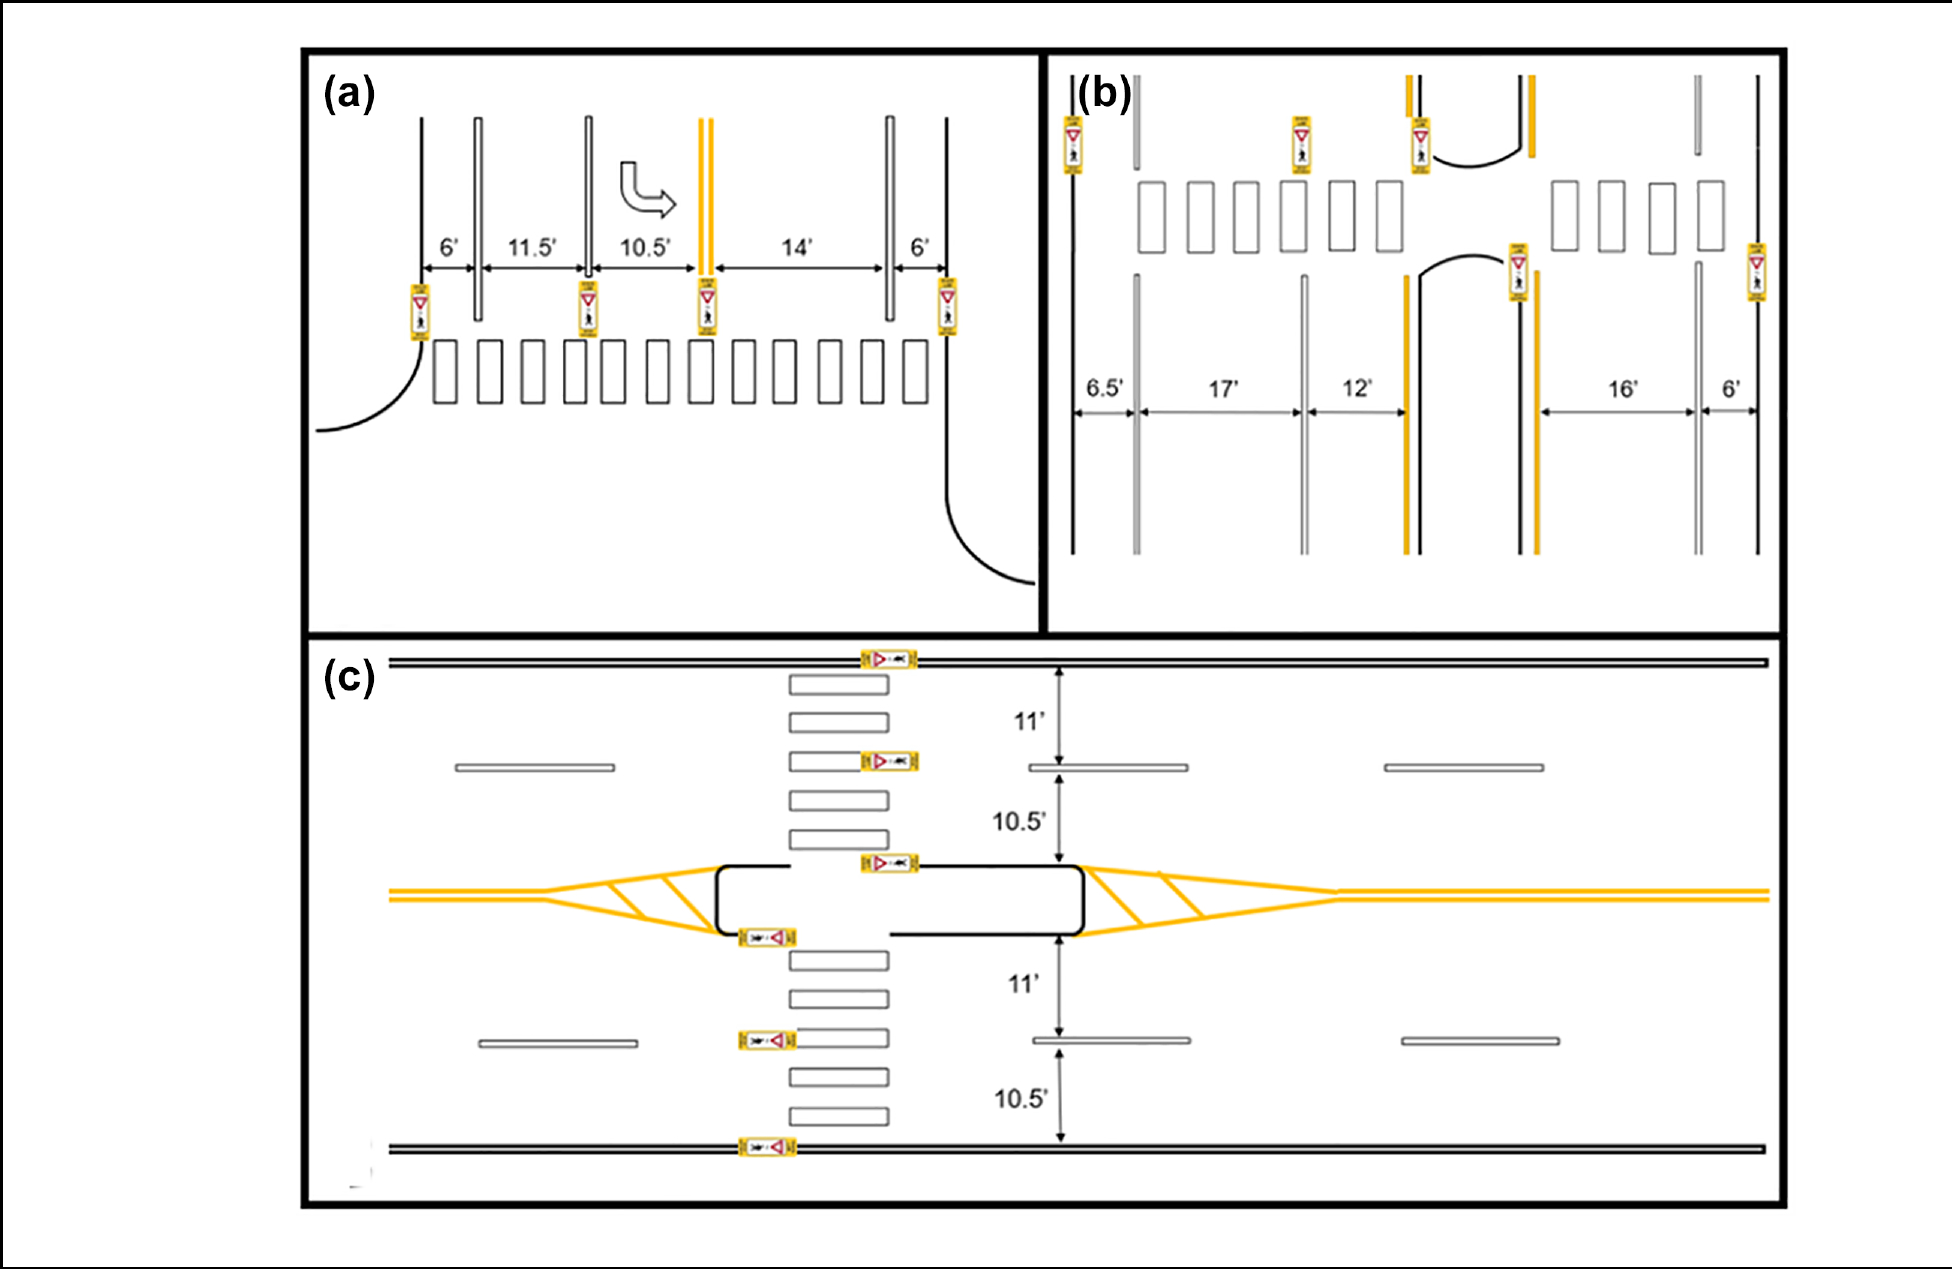
Diagram of approximate baseline lane widths and experimental sign positions for (a) Site 1, (b) Site 2, and (c) Site 3.
Site 2 was adjacent to a large high school. This location had a north–south orientation, with a designated bicycle lane in each travel direction separated by a painted buffer. The southbound portion included a turning lane that enabled access to the high school’s parking lot and drop-off area. This crosswalk also featured a raised median separating both directions of travel. An RRFB (19) was also present at the site, however the beacon was not activated during any of the trials. The AADT was 6,100, and the posted speed limit was 35 mph, resulting in a 183-ft DZ.
Site 3 was a major MDOT road adjacent to a university’s dormitories, and two blocks from the main campus. This location had an east–west orientation, and two-way traffic, with two lanes in each direction separated by a pedestrian refuge island. The AADT was 19,700, and the posted speed limit was 35 mph, resulting in a DZ of 183 ft.
Experimental Design
Two configurations of the gateway were assessed at each location: on the curb top, and in the gutter pan. These configurations were compared with the absence of the gateway signs (baseline). In each condition, the particulars of sign placement and the resulting widths between the signs were dictated by the existing characteristics of the site. Owing to a local ordinance that requires motorists to stop rather than yield for pedestrians, R1–6a signs were used instead of R1–6 signs. This sign was identical to the sign used in Experiment 1 except that it featured a stop symbol rather than a yield symbol. Because Sites 2 and 3 had opposing travel directions divided by a median, crossing each travel direction was considered as a separate trial. Turning vehicles at Site 1 were not scored for yielding because this cannot be easily differentiated from yielding to oncoming traffic as part of a turning maneuver. At Site 2, vehicles that entered the southbound turning lane were scored for yielding because that lane began at the crosswalk and the actual turn (and the associated need to yield to oncoming traffic) did not occur until 100 ft farther down the road.
At Site 1, 440 staged crossing trials were conducted across all conditions (n < 180 baseline, n < 120 curb top, and n < 140 gutter pan). At Site 2, a total of 580 trials were conducted (n < 140 baseline, n < 180 curb top, and n < 260 gutter pan). At Site 3, a total of 500 trials were conducted (n < 180 baseline, n < 160 curb top, and n < 160 gutter pan). Interobserver agreement on the percentage of motorists yielding to pedestrians was calculated for 30% of all observations, and averaged 95.8% across all three sites, with a range of 90% to 100%.
Results and Discussion
The average and range of yielding at all three sites can be seen in Figure 8. Across all sites, the gateway sign configurations produced an increase in yielding over the no gateway configuration (baseline). Additionally, gutter-pan configurations produced marginally higher percentages of yielding on average compared with the curb-top configuration. Across all three sites, the average yielding was 40.8% in baseline, 75.7% for the curb-top configuration, and 83.3%. for the gutter-pan configuration
Figure 8.
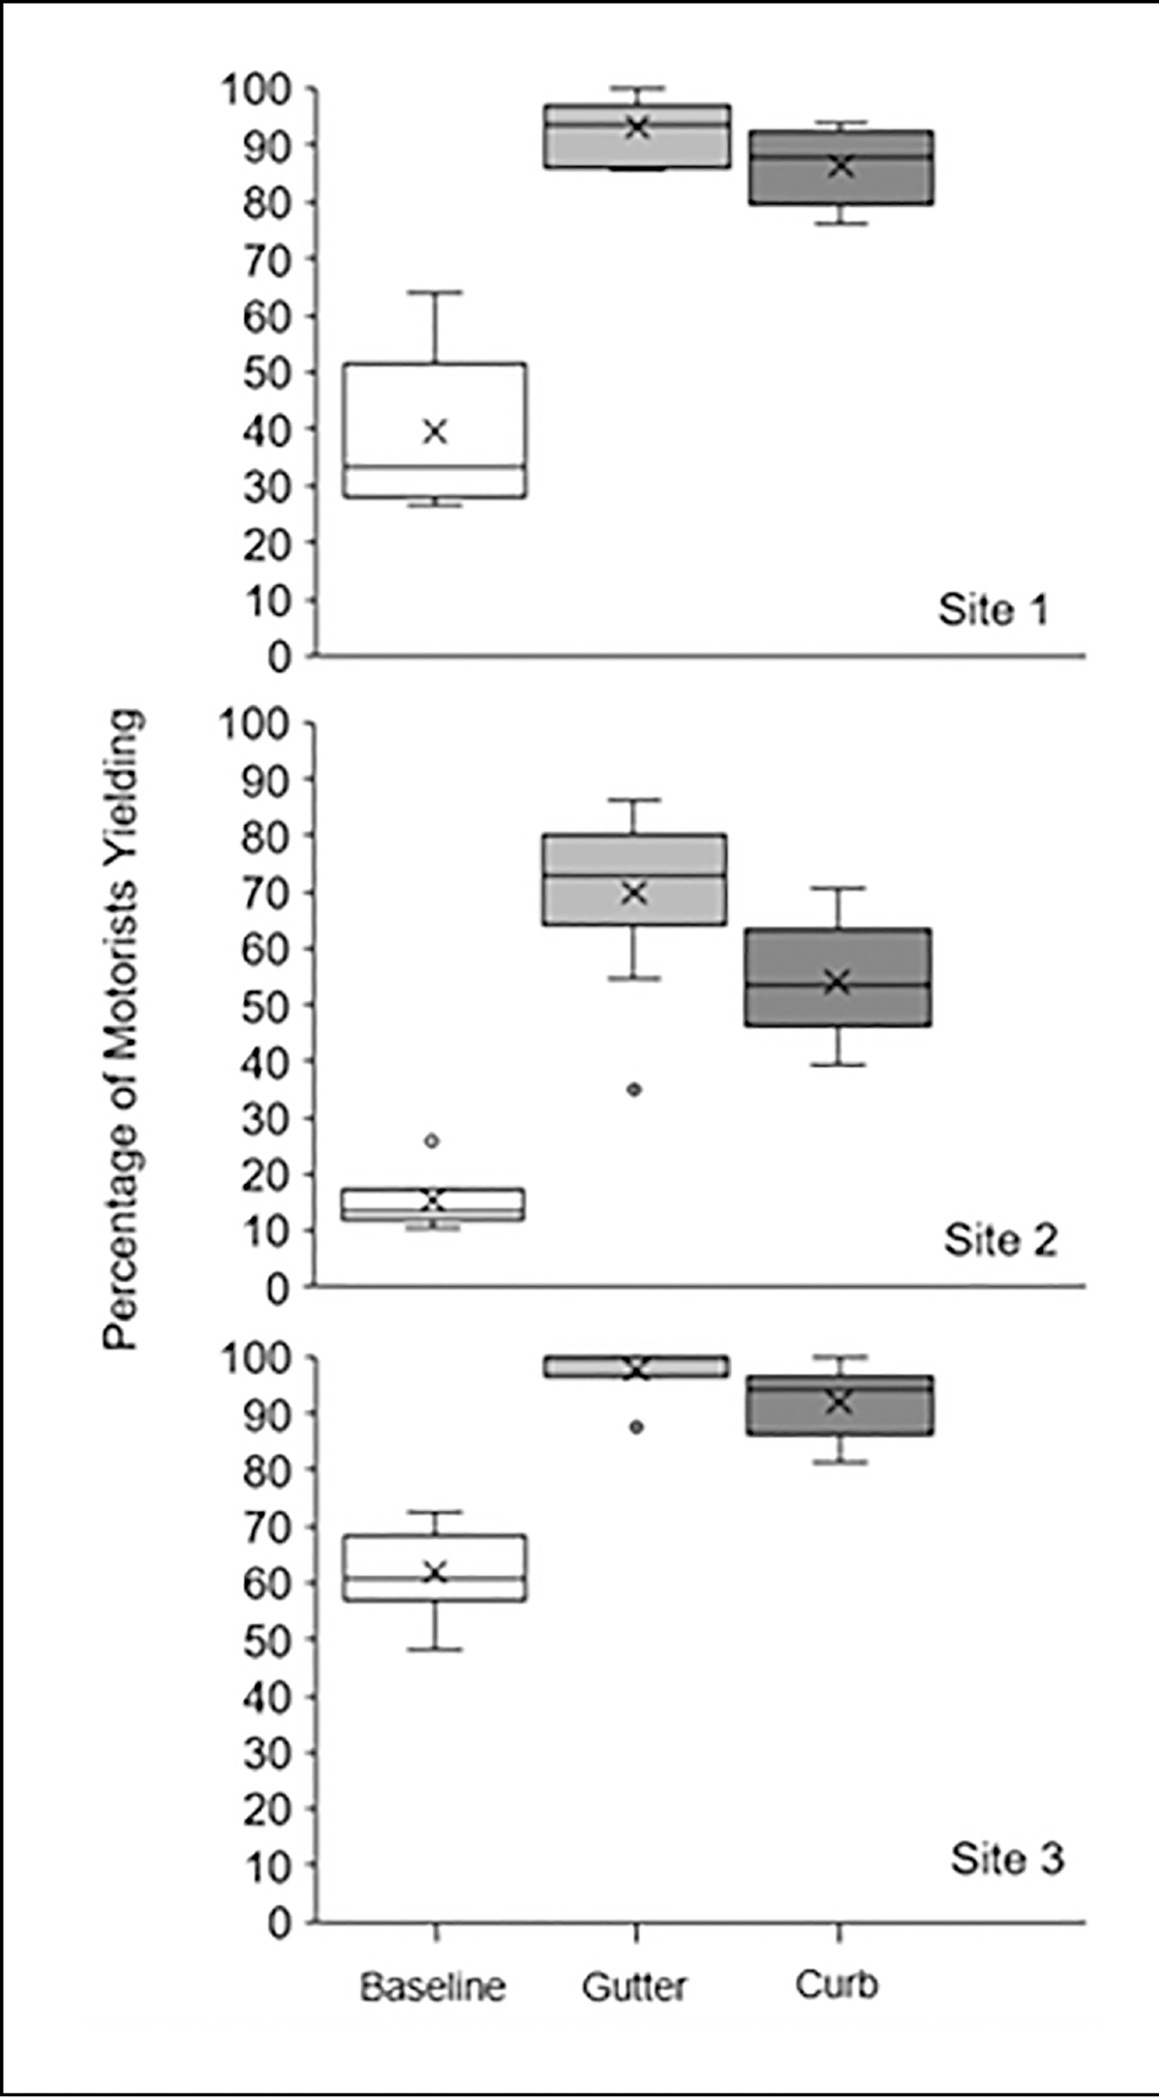
Mean, median, and range of yielding scores at each site in Experiment 2. Yielding was higher in the gutter-pan and curb-top gateway conditions than at baseline (i.e., no R1–6 signs). The gutter-pan placement (narrower) produced higher yielding than the curb-top placement (wider).
At Site 1, baseline yielding averaged 39.6%, the curb-top configuration of the R1–6 sign averaged 86.4%, and the gutter-pan configuration averaged 93.2%. A one-way ANOVA was conducted to compare the effect of the baseline and gateway conditions on the percentage of motorists yielding. There was a statistically significant difference in yielding between conditions: F(2,19) < 67.74, p < 0.0001. Tukey’s HSD tests for multiple comparisons found significant differences between baseline and each gateway condition; gutter (p < 0.0001, 95% CI < 40.75, 66.48) and curb (p < 0.0001, 95% CI < 33.30, 60.22). No significant difference was found between the gutter and curb configurations.
At Site 2, baseline yielding averaged 15.2%, the curb-top configuration averaged 59.1%, and the gutter-pan configuration averaged 69.9%. A one-way ANOVA was conducted to compare the effect of the baseline and gateway conditions on the percentage of motorists yielding. There was a statistically significant difference in yielding between conditions: F(2,26) < 53.07, p < 0.0001. Tukey’s HSD tests for multiple comparisons found significant differences between baseline and each gateway condition; gutter (p < 0.0001, 95% CI < 41.44, 67.88) and curb (p < 0.0001, 95% CI < 24.60, 53.01). A significant difference was also found between the gutter and curb configurations; (p < 0.01, 95% CI < 3.63, 28.08).
At Site 3, baseline yielding was 61.8%, the curb-top configuration averaged 92%, and the gutter-pan configuration averaged 97.6%. A one-way ANOVA was conducted to compare the effect of the baseline and gateway conditions on the percentage of motorists yielding. There was a statistically significant difference in yielding between conditions: F(2,22) < 78.89, p < 0.0001. Tukey’s HSD tests for multiple comparisons found significant differences between baseline and each gateway condition: gutter (p < 0.0001, 95% CI < 27.99, 43.52) and curb (p < 0.0001, 95% CI < 22.45, 37.98). No significant difference was found between the gutter and curb configurations.
These results are interesting when viewed in the context of the results of Experiment 1, because when the distance between signs is calculated for the curb and gutter sign placements the resulting yielding scores were concordant with the relationship found in the first experiment. This relationship was determined by calculating the average distance between the signs of both travel directions (see Table 1) and comparing this to the prediction band for the regression generated in Experiment 1. For example, in the curb-top condition at Site 1, the northbound (19.5 ft) and southbound (17 ft) lane widths were added and divided by two to produce an average distance between signs (18.25 ft). The south-bound turning lane was excluded at Site 2, because, according to data collectors, very few vehicles traveled in this lane during the staged crossings.
Table 1.
Approximate distance between signs at each site
| Distance between signs |
||
|---|---|---|
| Location/Lane | Curb top (ft) | Gutter pan (ft) |
|
| ||
| Site 1 | ||
| Northbound | 19.5 | 18.5 |
| Southbound | 17 | 16 |
| Site 2 | ||
| Northbound | 22 | 20 |
| Southbound 1 | 23 | 22 |
| Southbound 2 | 11.5 | 10.5 |
| Site 3 | ||
| Eastbound 1 | 10 | 9 |
| Eastbound 2 | 10.5 | 9.5 |
| Westbound 1 | 10.5 | 9.5 |
| Westbound 2 | 10 | 9 |
Note: Lane 1 is nearer to the curb; Lane 2 farther from the curb.
Figure 9 shows the regression model based on data from Experiment 1 with the obtained yielding scores at the sites in Experiment 2 overlayed and plotted as open markers. Here we simply compared the data to determine whether the relationship described in Experiment 1 aligned with the obtained yielding outcomes in Experiment 2 when the distance between the signs was the sole predictor.
Figure 9.
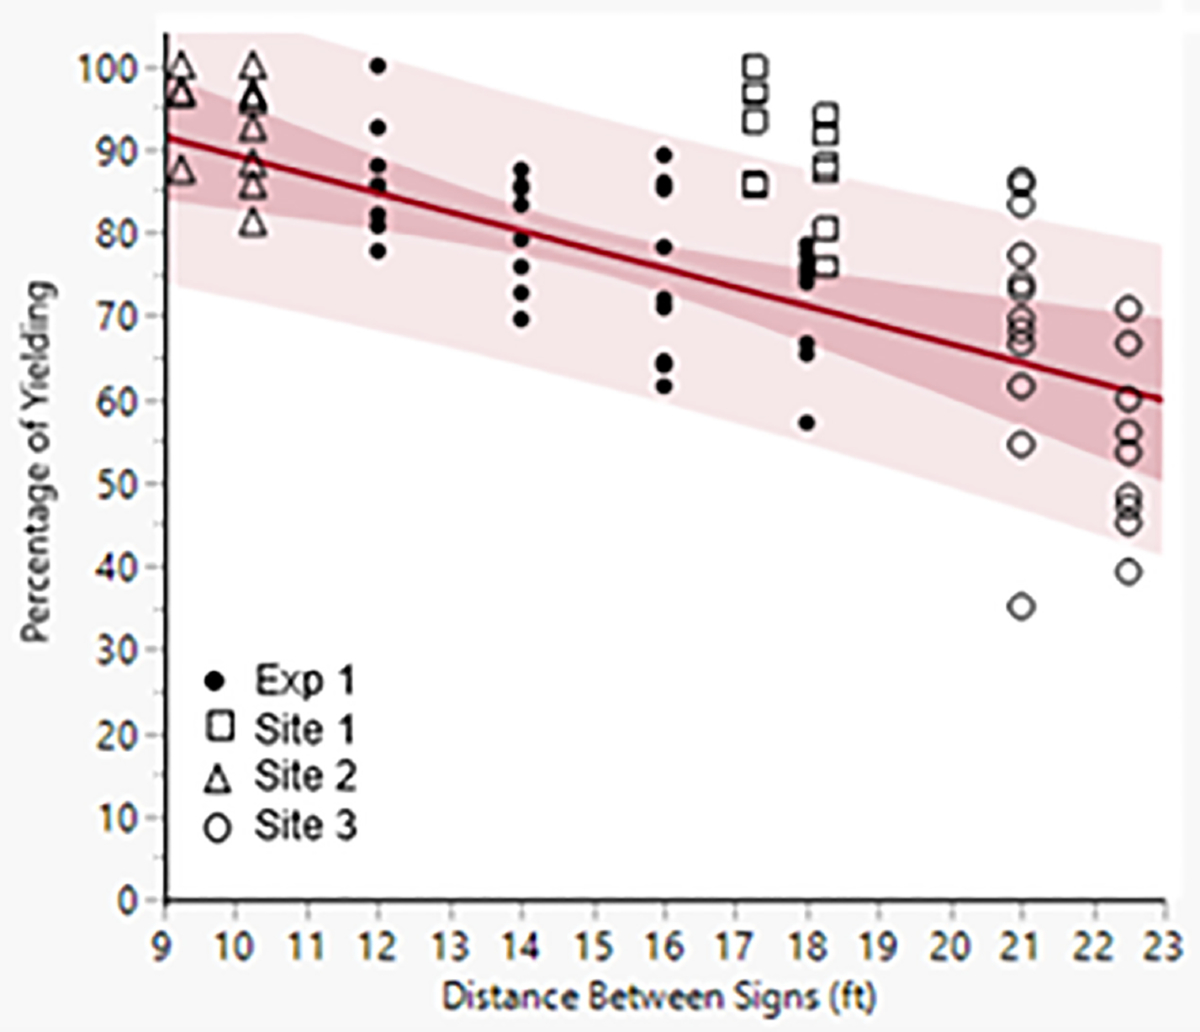
Yielding by distance between signs in Experiment 2 combined with yielding data from Experiment 1. Yielding scores for Sites 2 and 3 appear consistent with the linear relationship identified in Experiment 1. Yielding at Site 1 was higher than expected based on the distance between signs.
The obtained yielding scores at Sites 2 and 3 appeared to be consistent with the regression line and prediction band from Experiment 1. It is worth noting that, in general, the range of yielding percentages at the narrowest widths were more restricted (Site 2), whereas this range was more variable at greater widths (Site 3). This effect was also evident in the Figure 8 boxplots. Following Bennet et al.’s hypothesis, it stands to reason that narrower sign configurations would be more salient, and thus exert greater influence over the behavior of yielding (11). Interestingly, yielding at Site 1 was much higher than would have been predicted by Experiment 1 at those same values. Several potential factors for this increase in yielding appear in other characteristics of Site 1. Notably, the posted speed limit and traffic density (AADT) were lower than at the other sites, there was no median separating travel directions, and the site was located near an intersection, whereas the other sites were midblock crossings. Any one of these factors could have reasonably contributed to the higher percentage of yielding.
General Discussion
Both experiments provided further evidence that the R1–6 in-street sign gateway can produce significant increases in yielding to pedestrians by motorists over baseline levels, and the distance between signs in a gateway affects yielding. The first experiment showed that yielding increases as the distance between the signs decreases; however, the total change in yielding from widest to narrowest configuration was small. Similarly, the second experiment showed comparable levels of yielding when moving the signs from the gutter pan to the curb top. This is particularly important because previous research has shown that curb-top signs are much more likely to survive (12).
A key finding of Experiment 2 is that moving the edge signs in a gateway configuration to the curb top had only a small effect on yielding. When faced with that decision, there is little reason to consider placing them in the gutter pan. However, the first experiment showed that narrower distances between the signs could improve yielding. There are several ways that information could be used. For instance, at two of the sites in the second experiment, moving the edge signs to the bike lane line would most likely improve yielding. That may not be necessary where yielding is already high, but if yielding is lower than desired the bike lane line provides a potential placement that would reduce the distance between signs and thus increase yielding. However, the signs would be more vulnerable in such a location and care should be taken to ensure this placement does not interfere with the bicyclist path of travel.
One way these findings could be integrated is to place the R1–6 signs on a bump out or curb extension, which would serve to protect the sign against damage. Signs could be placed in various ways to harness the existing characteristics of a site (e.g., on a bike lane line), or those characteristics could be supplemented to improve yielding further (e.g., by installing a curb extension, which might also prevent a minor obstruction of the sidewalk). Ultimately, engineering judgment can be used to balance the interactions of characteristics, design, needs, and costs for a given location.
Bennett et al. hypothesized that the increased yielding in gateway configurations of the R1–6 sign may be a result of the boundaries of the lanes being made more salient, by extending those boundaries vertically, and suggested that the gateway configuration might also cause motorist speeds to decrease (11). Bennett et al. were unable to collect these data; however, some preliminary data reported by Van Houten et al. indicated significant reductions in speed at the crosswalk when the signs were present in the absence of a pedestrian (12). This effect needs to be replicated to determine its generality, and more data are being collected currently on these speed reduction effects. The influence of the gateway on speed is particularly important because higher vehicle speeds are associated with increased risk and severity of pedestrian injury (20–22).
If the hypothesis of Bennett et al. holds true, then the increase in yielding obtained with narrower configurations demonstrated in this study suggests that slower speeds might also be obtained. This aligns with previous simulator research that found that the width of a lane influences both vehicle speed and lane position (23). As such, the differential effects of an in-street sign gateway relative to speed and lane positioning may be of interest. Furthermore, in the context of Bennett and Van Houten’s research, this effect might also be examined with yellow-green sign blanks in the same configurations (16). The latter would help to determine whether the wording on the signs, which resulted in substantially higher yielding, is also contributing to speed reduction.
The presence of the signs may also prompt “scanning” behavior by the motorist. Scanning the roadway increases the likelihood of seeing a pedestrian standing at the crosswalk and yielding to them, especially if the signs are placed where pedestrians often cross the roadway. The act of navigating the gap between signs may also increase the likelihood that a motorist will be looking in the direction of a pedestrian when one is present. Previous simulator research found that participants looked for pedestrians equally often, but looked for them significantly earlier when advanced yield markings were present (24). Although scanning behavior is difficult to capture in field studies, the use of a simulator could reveal additional insights on motorist effort and attention with respect to the gateway configuration of in-street signs.
There are several limitations of the present study, so care should be taken when generalizing the results. From a methodological perspective, it would have been beneficial to collect lane-specific yielding data as the site-specific characteristics in Experiment 2 produced differential lane widths. Collecting data in this way is possible, but it requires additional data collection personnel (25) or the use of video recording (15). There are also limitations related to the size of the study. For instance, only four sites were assessed in total, and the AADTs at those locations were highly disparate. Previous research has shown that some combinations of speed and average daily traffic (i.e., traffic density) may attenuate the effects of high-visibility prompts, such as the R1–6 sign (17, 26). Future research could explore a broader range of site characteristics to determine the extent to which these variables influence the efficacy of the in-street sign gateway configuration. Studies of this nature, if conducted longitudinally, would also facilitate the estimation of a crash modification factor (CMF). The outlook for such research is promising, as the gateway configuration produces comparable levels of yielding to more costly countermeasures (11), and reductions in speed (12), both of which are associated with a CMF (27). The relationship between speed and injury is non-linear with even small increases in speed after a certain threshold being far more likely to result in a serious injury or fatality (22). Future research could also investigate whether relatively small differences in a measure like rates of yielding are also associated with increases in incident severity.
Another consideration is that the sites selected featured other engineering treatments, including signs, markings, and, in one case, an RRFB. Despite this, the gateway configurations examined in the present study produced significant increases in yielding over baseline levels and these other treatments were present during baseline. Moreover, in relation to the signs themselves, Experiment 1 used a yield symbol and Experiment 2 a stop symbol. The symbol used on the sign in each location is a legal requirement, making direct comparisons difficult to conduct in real-world settings. However, previous studies in this line of research have found comparable levels of yielding across settings with both varieties of sign. The user manual published by MDOT provides yielding estimates based on the site characteristics (e.g., number of lanes, presence of a refuge island, intersection versus midblock, speed, AADT), which have been previously demonstrated to affect levels of yielding (13). The present study has added information on distance between the signs and curb-versus gutter-pan placements, which can further guide implementation.
Nevertheless, the R1–6 sign is only one tool that can be brought to bear on reducing pedestrian injuries and fatalities. In 2020, 82% of pedestrian fatalities occurred in urban areas, 75% occurred at nonintersections, and 77% occurred at night (1). Addressing the problem comprehensively will require bringing an entire toolbox that includes road-design, lighting, markings, and signs. In addition to these engineering features, education and enforcement (i.e., “the three E’s”) are necessary to produce comprehensive and effective solutions (28). When used in concert with each other, these three elements have produced immediate benefits (7) that may result in sustained changes over time (8).
Finally, equity may be considered a fourth “E” (29). When examining annual pedestrian injury and fatality rates, Black, Hispanic, American Indian/Native Alaskan, and lower-income populations are disproportionately affected (30–32). At approximately $200 per sign (12), the gateway configuration can produce comparable yielding to an RRFB ($20,000) or PHB ($100,000) (11, 15, 32). This is not simply a budgetary consideration, but also one of reach. The cost of installing one RRFB could cover the installation of in-street sign gateways at as many as 20 sites, depending on site characteristics. The low-cost and adaptable nature of the gateway treatment can facilitate its deployment to priority locations indicated by local traffic injury/fatality data and community stakeholders. This strategy could be used to supplement longer-term changes to transportation safety infrastructure and other elements of the built environment that require significant investments of time and financial resources.
Conclusions
The R1–6 in-street sign gateway is a low cost, effective treatment to increase yielding to pedestrians. Levels of yielding increased as the distance between the signs decreased, providing support for the perceived narrowing hypothesis. Knowledge of the relationship between yielding and distance between signs can be integrated into comprehensive solutions that harness education, engineering, and enforcement to produce safer and more equitable pedestrian environments. Small increases in the distance between signs, such as moving the edge signs from the gutter pan to a curb top, may produce a minor, negligible decrease in yielding, but the move could improve survivability of these signs. Over time, this may serve to reduce maintenance costs of the treatment. The cost-effective nature of this solution may allow it to be deployed flexibly to address local trends and concerns in pedestrian safety; however, the Manual on Uniform Traffic Control Devices currently limits placement to the edge line and approval of curb-top placements at the federal level is still pending. Subject to that approval, gateway configurations could be used in concert with other countermeasures, such as curb extensions, to further improve pedestrian safety and reduce sign maintenance costs.
Funding
The authors disclosed receipt of the following financial support for the research, authorship, and/or publication of this article: This work was supported by the Michigan Department of Transportation (contract no. 2013–0069).
The findings and conclusions in this paper are those of the authors and do not necessarily represent the official position of the National Institute for Occupational Safety and Health, Centers for Disease Control and Prevention.
Footnotes
Declaration of Conflicting Interests
The authors declared no potential conflicts of interest with respect to the research, authorship, and/or publication of this article.
References
- 1.National Highway Traffic Safety Administration. Pedestrians: 2020 Data. Traffic Safety Facts. Report No. DOT HS 813 310. National Highway Traffic Safety Administration, Washington, D.C., 2022. [Google Scholar]
- 2.Huybers S, Van Houten R, and Malenfant JL Reducing Conflicts Between Motor Vehicles and Pedestrians: The Separate and Combined Effects of Pavement Markings and a Sign Prompt. Journal of Applied Behavior Analysis, Vol. 37, No. 4, 2004, pp. 445–456. [DOI] [PMC free article] [PubMed] [Google Scholar]
- 3.Van Houten R The Effects of Advance Stop Lines and Sign Prompts on Pedestrian Safety in a Crosswalk on a Multilane Highway. Journal of Applied Behavior Analysis, Vol. 21, No. 3, 1988, pp. 245–251. [DOI] [PMC free article] [PubMed] [Google Scholar]
- 4.Van Houten R, Louis Malenfant JE, and McCusker D Advance Yield Markings: Reducing Motor Vehicle—Pedestrian Conflicts at Multilane Crosswalks with Uncontrolled Approach. Transportation Research Record: Journal of the Transportation Research Board, 2001. 1773:69–74. [Google Scholar]
- 5.Van Houten R, and Malenfant L The Influence of Signs Prompting Motorists to Yield Before Marked Crosswalks on Motor Vehicle-Pedestrian Conflicts at Crosswalks with Flashing Amber. Accident Analysis & Prevention, Vol. 24, No. 3, 1992, pp. 217–225. [DOI] [PubMed] [Google Scholar]
- 6.Federal Highway Administration. Manual on Uniform Traffic Control Devices: 2009 Edition. U.S. Department of Transportation, Washington, D.C., 2009. [Google Scholar]
- 7.Van Houten R, Malenfant L, Huitema B, and Blomberg R Effects of High-Visibility Enforcement on Driver Compliance with Pedestrian Yield Right-of-Way Laws. Transportation Research Record: Journal of the Transportation Research Board, 2013. 2393: 41–49. [Google Scholar]
- 8.Van Houten R, Malenfant JL, Blomberg R, Huitema B, and Hochmuth J High-Visibility Enforcement on Driver Compliance with Pedestrian Right-of-Way Laws: 4-Year Follow-Up. Transportation Research Record: Journal of the Transportation Research Board, 2017. 2660: 58–65. [Google Scholar]
- 9.Van Houten R, Morris N, Craig C, Dixon D, and Hochmuth J Changing Driver Yielding Behavior on a City-Wide Basis. Journal of Organizational Behavior Management, 2021, pp. 1–24. [Google Scholar]
- 10.Sandt LS, Marshall SW, Rodriguez DA, Even-son KR, Ennett ST, and Robinson WR Effect of a Community-Based Pedestrian Injury Prevention Program on Driver Yielding Behavior at Marked Crosswalks. Accident Analysis & Prevention, Vol. 93, 2016, pp. 169–178. [DOI] [PubMed] [Google Scholar]
- 11.Bennett MK, Manal H, and Van Houten R A Comparison of Gateway In-Street Sign Configuration to Other Driver Prompts to Increase Yielding to Pedestrians at Crosswalks. Journal of Applied Behavior Analysis, Vol. 47, No. 1, 2014, pp. 3–15. [DOI] [PubMed] [Google Scholar]
- 12.Van Houten R, Hochmuth J, Dixon D, and McQuiston C Safety Benefits of the Gateway R1–6 Treatment: An Examination of Effects on Drivers Yielding to Pedestrians, Speed at Crosswalks, and Sign Durability. Institute of Transportation Engineers ITE Journal, Vol. 88, No. 3, 2018, pp. 31–39. [Google Scholar]
- 13.Van Houten R, and Bennett M User Guide for R1–6 Gateway Treatment for Pedestrian Crossings. 2016. https://aii.transportation.org/documents/User%20Guide_2018_0503_Final_UPDATED%20CDM%20Edgeline%20Clarification.pdf. [Google Scholar]
- 14.American Association of State Highway and Transportation Officials. Pedestrian Gateway Treatment. n.d. https://aii.transportation.org/Pages/Pedestrian-Gateway-Treatment.aspx.
- 15.Stapleton S, Kirsch T, Gates T, and Savolainen P Factors Affecting Driver Yielding Compliance at Uncontrolled Midblock Crosswalks on Low-Speed Roadways. Transportation Research Record: Journal of the Transportation Research Board, 2017. 2661: 95–102. [Google Scholar]
- 16.Bennett MK, and Van Houten R Variables Influencing Efficacy of Gateway In-Street Sign Configuration on Yielding at Crosswalks. Transportation Research Record: Journal of the Transportation Research Board, 2016. 2586: 100–105. [Google Scholar]
- 17.Van Houten R, and Hochmuth J Evaluation of R1–6 Gateway Treatment Alternatives for Pedestrian Crossings. Western Michigan University, Kalamazoo, 2016. [Google Scholar]
- 18.Institute of Transportation Engineers. Determining Vehicle Change Intervals: A Proposed Recommended Practice. Institute of Transportation Engineers, Washington, D.C., 1985. [Google Scholar]
- 19.Shurbutt J, Van Houten R, Turner S, and Huitema B Analysis of Effects of LED Rectangular Rapid-Flash Beacons on Yielding to Pedestrians in Multilane Cross-walks. Transportation Research Record: Journal of the Transportation Research Board, 2009. 2140: 85–95. [Google Scholar]
- 20.Anderson RWG, McLean AJ, Farmer M, Lee B-H, and Brooks CG Vehicle Travel Speeds and the Incidence of Fatal Pedestrian Crashes. Accident Analysis & Prevention, Vol. 29, No. 5, 1997, pp. 667–674. [DOI] [PubMed] [Google Scholar]
- 21.Rosén E, and Sander U Pedestrian Fatality Risk as a Function of Car Impact Speed. Accident Analysis & Prevention, Vol. 41, No. 3, 2009, pp. 536–542. [DOI] [PubMed] [Google Scholar]
- 22.Tefft BC Impact Speed and a Pedestrian’s Risk of Severe Injury or Death. Accident Analysis & Prevention, Vol. 50, 2013, pp. 871–878. [DOI] [PubMed] [Google Scholar]
- 23.Lewis-Evans B, and Charlton SG Explicit and Implicit Processes in Behavioural Adaptation to Road Width. Accident Analysis & Prevention, Vol. 38, Vol. 3, 2006, pp. 610–617. [DOI] [PubMed] [Google Scholar]
- 24.Fisher D, and Garay-Vega L Advance Yield Markings and Drivers’ Performance in Response to Multiple-Threat Scenarios at Mid-Block Crosswalks. Accident Analysis & Prevention, Vol. 44, No. 1, 2012, pp. 35–41. [DOI] [PMC free article] [PubMed] [Google Scholar]
- 25.Hochmuth J, and Van Houten R Influence of Advanced Placement of the In-Street Sign Gateway on Distance of Yielding from the Crosswalk. Transportation Research Record: Journal of the Transportation Research Board, 2018. 2672: 13–20. [Google Scholar]
- 26.Turner S, Fitzpatrick K, Brewer M, and Park ES Motorist Yielding to Pedestrians at Unsignalized Intersections: Findings from a National Study on Improving Pedestrian Safety. Transportation Research Record: Journal of the Transportation Research Board, 2006. 1982: 1–12. [Google Scholar]
- 27.Zegeer C, Lyon C, Srinivasan R, Persaud B, Lan B, Smith S, Carter D, et al. Development of Crash Modification Factors for Uncontrolled Pedestrian Crossing Treatments. Transportation Research Record: Journal of the Transportation Research Board, 2017. 2636: 1–8. [Google Scholar]
- 28.Schneider RJ, Sanatizadeh A, Shaon MRR, He Z, and Qin X Exploratory Analysis of Driver Yielding at Low-Speed, Uncontrolled Crosswalks in Milwaukee, Wisconsin. Transportation Research Record: Journal of the Transportation Research Board, 2018. 2672: 21–32. [Google Scholar]
- 29.Giles A, Bauer MEE, and Jull J Equity as the Fourth ‘E’ in the ‘3 E’s’ Approach to Injury Prevention. Injury Prevention, Vol. 26, No. 1, 2020, p. 82. [DOI] [PubMed] [Google Scholar]
- 30.Governors Highway Safety Association. An Analysis of Traffic Fatalities by Race and Ethnicity. June 2021. https://www.ghsa.org/sites/default/files/2021-06/An%20Analysis%20of%20Traffic%20Fatalities%20by%20Race%20and%20Ethnicity_0.pdf.
- 31.Raifman MA, and Choma EF Disparities in Activity and Traffic Fatalities by Race/Ethnicity. American Journal of Preventive Medicine, Vol. 63, No. 2, 2022, pp. 160–167. [DOI] [PubMed] [Google Scholar]
- 32.Rebentisch H, Wasfi R, Piatkowski DP, and Manaugh K Safe Streets for All? Analyzing Infrastructural Response to Pedestrian and Cyclist Crashes in New York City, 2009–2018. Transportation Research Record: Journal of the Transportation Research Board, 2019. 2673: 672–685. [Google Scholar]


