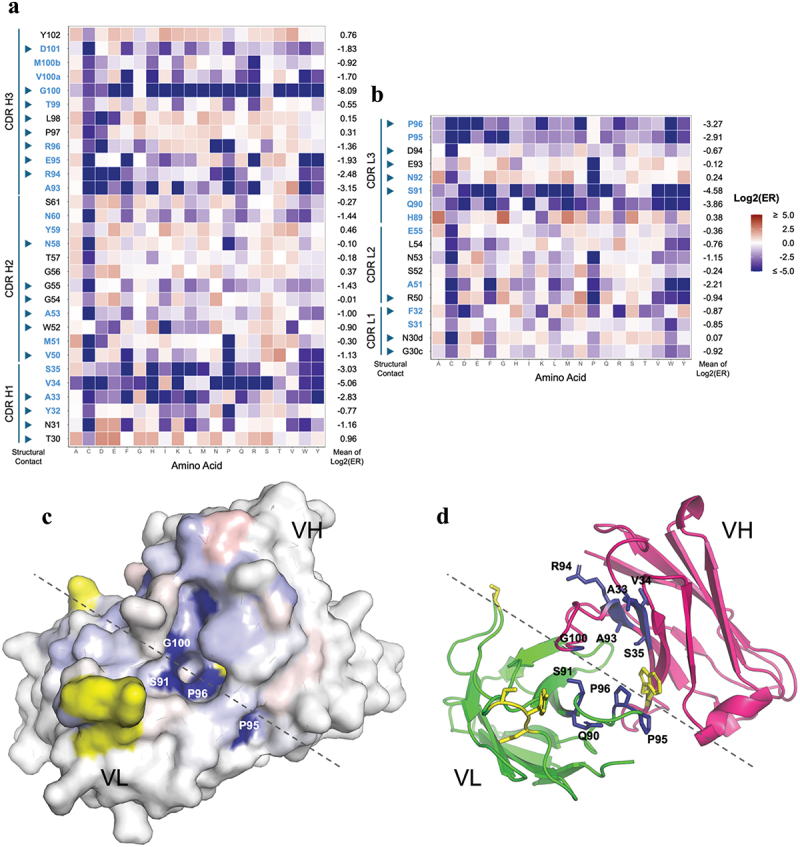
Figure 5.

Deep mutational scan of 23ME-00610 for mapping the high affinity interaction with hCD200R1. Single mutation enrichment of all randomized CDR positions of 23ME-00610 VH (a) or VL (b) from hCD200R1 panning is shown with Log2(ER) colored as labeled. Positions with low solvent accessibility are in blue, which is defined as < 25% of the whole residue area20 being solvent accessible as unbound 23ME-00610 fab using FreeSASA.21 CDR positions in the scan that are part of the structural contact sites with hCD200R1 are pointed with arrowheads. For each position, the mean of the Log2(ER) is calculated as the average of Log2(ER) of all mutation except cysteine. (c) The mean of the Log2(ER) is mapped on the structure of 23ME-00610 fab in a top-down view using the same color scale as A and B. Approximate border between VH and VL is denoted with a dotted line. Residues in yellow are part of the structural contact but not included in the mutational scan. (d) Same view of fab as (C) is plotted in ribbon with residues with Log2(ER) < −2 in blue sticks.
