

Summary
RNA Polymerase II-mediated transcription is a critical, highly-regulated process aided by protein complexes at distinct steps. Here, to investigate Pol II and transcription factor binding and dissociation dynamics, we generated endogenous Photoactivatable-GFP (PA-GFP) and HaloTag knock-ins using CRISPR-Cas9, allowing us to track a population of molecules at the induced Hsp70 loci in Drosophila melanogaster polytene chromosomes. We found that early in the heat shock response, little Pol II and DSIF are reused for iterative rounds of transcription. Surprisingly, although PAF1 and Spt6, are found throughout the gene body by ChIP assays, they show markedly different binding behaviors. Additionally, we found that PAF1 and Spt6 are only recruited after P-TEFb-mediated phosphorylation and Pol II promoter-proximal pause escape. Finally, we observed that PAF1 may be expendable for transcription of highly expressed genes where nucleosome density is low. Thus, our live-cell imaging data provide key constraints to mechanistic models of transcription regulation.
Keywords: RNA Polymerase II, DSIF, P-TEFb, PAF1, Spt6, live-cell imaging, heat shock
eTOC Blurb:
Versluis et al. track transcription factor dynamics in live cells, observing that Pol II and DSIF show similar kinetics at Hsp70, while P-TEFb and PAF1 rapidly exchange between neighboring Hsp70 chromatids. Elongation factors, PAF1 and Spt6, display different binding kinetics, but require P-TEFb activity to be recruited to Hsp70.
Graphical Abstract

Introduction
RNA Polymerase II (Pol II)-mediated transcription is a highly regulated, multi-step process responsible for producing all mRNAs. Pol II recruitment to the transcription start site (TSS) is coordinated by the opening of chromatin and binding of general transcription factors and the Mediator complex 1–3. In animal cells, Pol II initiates RNA synthesis, rapidly transcribes twenty to fifty nucleotides, and then pauses 3–5. Pausing is induced by the binding of DRB Sensitivity Inducing Factor (DSIF), a heterodimer of Spt4 and Spt5, 6,7 and Negative Elongation Factor (NELF), a complex of NELF-A, B, C/D, and E 3,8,9. Pol II is released from the pause by Positive Transcription Elongation Factor b (P-TEFb), a heterodimer of Cdk9 and Cyclin-T, that phosphorylates Pol II, DSIF, and NELF, transforming DSIF into an elongation factor and dissociating NELF from Pol II 10–12. As Pol II shifts into productive elongation, Spt6 binds phosphorylated Pol II and the PAF1 complex binds to the surface exposed upon NELF dissociation 7,12. Pol II transcribes through the gene, then is terminated, and the complex is removed from chromatin to be used for subsequent rounds of transcription 13.
Recent technological developments have deepened our understanding of the mechanisms of transcription and its regulation 3,14. However, there are significant gaps in our knowledge and further progress will require examining the detailed molecular dynamics of Pol II and its key regulatory factors in vivo. Kinetic measurements of the binding, dissociation, and re-association of Pol II and pause and elongation factors at specific, known loci can constrain models of transcription mechanisms. Combining these measurements with perturbations can clarify the roles of specific molecular interactions and enzymatic activities. However, measuring Pol II and pause/elongation factor dynamics unambiguously during transcription of an individual gene is technically challenging. To achieve this goal, we performed live-cell imaging in Drosophila melanogaster polytene chromosomes using improved tools for genetic engineering, imaging and more specific inhibitors than previous work 15–17.
D. melanogaster polytene chromosomes enable sensitive, live imaging of protein localization to specific genomic loci due to their giant size and structure. After undergoing ten rounds of DNA replication without division, the interphase nuclei in D. melanogaster salivary glands contain enormous chromosomes with approximately a thousand copies of each chromatid aligned side-by-side 18,19, allowing individual genetic loci to be easily observed. Despite the high copy number, the basic molecular mechanisms of transcription in D. melanogaster polytene chromosomes are thought to be the same as in diploid cells 6,16,20–24. Here we measure the residence time and dynamics of Pol II and multiple key regulating transcription factors utilizing the highly transcribed, cytologically-identifiable, Hsp70 genes. We show that the PAF1 complex and Spt6 are recruited to Hsp70 only after P-TEFb-mediated pause release and that PAF1 binds to Pol II transiently, whereas Spt6 remains bound far longer, likely over the entire transcription unit. We measured the levels of elongation factors Spt5, Spt6 and PAF1 and found them to be present at nearly stoichiometric levels with one another, and slightly lower than Pol II. Finally, we observed that upon depletion of the PAF1 component Cdc73, Pol II shows reduced elongation only when the complex needs to navigate through nucleosomal barriers.
Results:
Drosophila melanogaster polytene chromosome imaging system
Previously our lab performed live-cell imaging experiments in D. melanogaster polytene chromosomes using the UAS-Gal4 system to express transgenic GFP-tagged Pol II and transcription factors 15–17,25. To perform more physiologically precise experiments, we used CRISPR-Cas9 to endogenously tag Pol II, DSIF, NELF, P-TEFb, PAF1, and Spt6 at their native genes with HaloTag 26 and/or Photoactivatable-GFP (PA-GFP) 27 (Supplemental Figure 1A–C). Supplemental Table 1 summarizes proteins we tagged. We confirmed that the tags were inserted correctly and showed that the proteins are expressed as full-length fusion via Western Blot and in-gel fluorescence assays (see Methods and Supplemental Figures 1D–G). These proteins are all essential, so the lack of a phenotype suggests they function properly.
Photoactivatable-GFP (PA-GFP) 27 tags, when coupled with 3D localized two-photon excitation, minimize the volume of the fluorescent region to a couple cubic microns, thereby reducing background from molecules above and below the focal point and providing a high signal to noise ratio. A technical challenge is finding the locus of interest prior to photoactivation. To circumvent this, we also separately tagged Pol II or other regulatory factors in parallel with HaloTag 26. Crossing a homozygous HaloTag labeled fly line with a homozygous PA-GFP labeled fly line yields flies heterozygous for both tags and allows us to locate our locus of interest for photoactivation (Figure 1A).
Figure 1. Whole puff photoactivation and decay reveals distinct Pol II and elongation factor dynamics.

A. Experimental design. CRISPR-Cas9 edited D. melanogaster lines expressing endogenously labeled factors with HaloTag and PA-GFP are crossed, salivary glands are dissected from larvae, stained with HaloTag ligand JFX650, and mounted. Heat shock (36.5°C) is induced allowing the Hsp70 puffs to be located (gray triangles) by the HaloTag shown in the far-red channel (magenta). One Hsp70 puff is simultaneously photoactivated (PA-GFP - green) and bleached (JFX650).
B. Schematic representation of photoactivation and decay experiment with PA-GFP tagged Pol II. PA-GFP is shown in gray prior to photoactivation, and green after photoactivation. Red “claw” is Pol II. Panel i shows Pol II-PA-GFP prior to photoactivation, panel ii shows Pol II-PA-GFP immediately after photoactivation, and panel iii shows the system after photoactivation. i, ii, and iii correspond to regions of the schematic plot of the PA-GFP intensity versus time below.
C. Schematic representation of Fluorescence Recovery After Photo-bleaching (FRAP) experiment with HaloTagged Pol II. Scheme is identical to B except HaloTag (gray packman) bound to fluorescent HaloTag ligand (star) is bright magenta. The photo-bleached HaloTag dye is shown in gray.
D. Representative images of photoactivation/photo-bleaching experiments. Images are maximum intensity projections from 10 slice z-stacks capturing the whole puff volume. The first column shows the far-red channel prior to photoactivation. The white arrow denotes the individual puff that was targeted. Subsequent columns show each PA-GFP tagged factor prior to photoactivation, at t = 7 sec, 67 sec and 137 sec post photoactivation. Border color corresponds to the color the factor is plotted in E and if applicable F. Color intensities are scaled equally for all factors.
E. Background subtracted, bleaching corrected, normalized intensity of PA-GFP signal as a function of time for each factor. Due to off-target diffusing molecules contributing to background, the first image post-photoactivation was omitted (see Methods). Signal pre-photoactivation was normalized to 0 and 7 sec post-photoactivation was normalized to 1 for each factor and a single exponential decay curve was fitted to each factor to estimate half-lives. Photoactivation decay data here and through the manuscript is plotted as the mean +/− 95% confidence intervals. Fluorescence intensity here and throughout is expressed in Arbitrary Fluorescence Units (AFU). Replicates are independent nuclei from different larvae acquired across at least two separate days of imaging. Pol II (n = 13), DSIF (n = 13), P-TEFb (n = 10), PAF1 (n = 12), and Spt6 (n = 13).
F. Background subtracted, bleaching corrected, normalized FRAP curves for Pol II-Halo and PAF1-Halo. Data was normalized to 1 pre-photoactivation and to zero 7 sec post-photoactivation. Replicates are independent nuclei from different larvae acquired across at least two separate days of imaging. Pol II (n = 18), PAF1(n = 25). Error bars are 95% confidence intervals. See also Supplemental Figure 3.
The model genes used in this study are two endogenous clusters of Hsp70 at cytological positions 87A and 87C 28, which contain two and four copies of Hsp70 respectively 29,30, and have been used extensively as a model to study transcription dynamics and mechanisms 4,21,31–33. In D. melanogaster polytene chromosomes, the two Hsp70 loci form large chromosomal expansions, “puffs,” upon heat shock (HS) that can be unambiguously identified 15–17. Previous work has shown that during maximum HS induction of Hsp70, (achieved after only a few minutes of HS), Pol II molecules are rapidly released into productive elongation 33,34, so under these conditions Pol II spends very little time paused and the majority of Pol II’s residence time is spent elongating. Therefore, we reasoned that studying the activated Hsp70 genes would be a good model to study highly-transcribed genes. By comparing the residence time and recovery rates of highly processive Pol II to several elongation factors, we could assess their relative kinetics of binding and dissociation.
We corrected PA-GFP photobleaching by measuring the bleaching rate of total nuclear PA-GFP as a function of laser scan number (Supplemental Figure 2A–C and Methods). To demonstrate that our photobleaching correction worked well, we compared the decay of each PA-GFP tagged factor with different acquisition intervals (Supplemental Figure 2D).
Whole puff photoactivation and decay reveals distinct Pol II and elongation factor dynamics
To examine the dynamics of PA-GFP tagged Pol II, DSIF, P-TEFb, PAF1, and Spt6 during transcription, we crossed our HaloTag and PA-GFP tagged flies, dissected salivary glands from the larvae, stained them with JFX650 HaloTag ligand, heat shocked the glands for 6–10 min, then targeted a single Hsp70 puff for simultaneous PA-GFP photoactivation and Halo dye Fluorescence Recovery After Photobleaching (FRAP) (See Figure 1A–D, Supplemental Movies 1A–N, and methods for details). We plotted the normalized, bleach-corrected photoactivation for Pol II and the four other factors (Figure 1E) and Pol II and PAF1 FRAP (Figure 1F). The results show that Pol II decays nearly linearly over the first approximately 90 seconds and then plateaus along an exponential decay. These initial linear kinetics are in agreement with the fact that during HS, Pol II is predominantly elongating on Hsp70 genes 35 and agrees with previous observations 16. Extrapolating the initial linear decay to 0 Arbitrary Fluorescent Units (AFU) at about 130 seconds, and knowing that Hsp70 is 2.4 kb long, we determined that Pol II is elongating approximately 1.1 kb/min. This estimate is in agreement with previous measurements from our lab that found an elongation rate of 1.2 to 1.5 kb/min 16,36.
To compare the decay rates of Pol II with the other factors, we fit a single exponential decay to each protein, which fit the data reasonably well (Figure 1E–F and Supplemental Figure 3A, see R2 values). Although this model may not describe all the possible behaviors of each factor (for instance re-association as has been previously observed 17), it describes the data well without introducing too many assumptions. Compared to Pol II, DSIF (pink) showed a very similar decay profile, as we anticipated. Based on previous ChIP assays, DSIF has been shown to be present throughout the gene, mirroring Pol II occupancy, and structural data shows that DSIF makes extensive contacts with Pol II 7,12,37,38. Based on our photoactivation data, it appears that DSIF remains associated with Pol II over the duration of transcription through the gene. Unlike DSIF, the other factors tested: P-TEFb (orange), PAF1 (blue), and Spt6 (green) showed very different decay curves from Pol II. PAF1 and P-TEFb signal decayed rapidly while Spt6 appeared to reside longer than Pol II. P-TEFb is the critical kinase responsible for mediating pause release, our data shows that P-TEFb rapidly dissociates from the Hsp70 locus indicating that it only transiently interacts with Pol II and does not traverse the entire gene with Pol II. Curiously, PAF1 and Spt6 displayed very different behavior despite structural data showing that both have extensive contacts with Pol II 12 and by ChIP in flies and humans, both are present across the gene body downstream of the Pol II pause peak 22,39,40. Our data shows that PAF1, like P-TEFb, rapidly dissociates from Hsp70, indicating it transiently interacts with Pol II, whereas Spt6 remains at Hsp70 longer than PAF1, and curiously, longer than Pol II. To confirm PAF1’s short residence time was not an artifact of tagging, we also generated knock-in Ctr9, another component of the PAF1 complex, and compared their residence times (Supplemental Figure 3B). The two components showed an identical decay, confirming that the PAF1 complex dissociates rapidly. Our observation that PAF1 and Spt6 reside at the Hsp70 locus for different durations agrees with work from Žumer et al. who reported that PAF1 and Spt6 perform different roles during transcription elongation 41 that warrant future investigation.
Additionally, from the same experiments, we were able to plot the recovery of photo-bleached Pol II and PAF1 HaloTag fusions (Figure 1F and Supplemental Figure 3C). Again, we fit single exponential models to the data to quantitatively compare their recovery rates. PAF1 showed much faster recovery than Pol II, agreeing with our photoactivation data that Pol II remains at Hsp70 longer than PAF1. We note that the calculated half-lives for Pol II and PAF1 differ between the photoactivation and FRAP (Supplemental Figure 3A) (41.2 +/−1.8 versus 50.44 +/− 4.8 sec for Pol II and 22.9 +/− 1.6 versus 39.2 +/− 3.3 sec for PAF1), however the biochemical trend that Pol II resides at the Hsp70 puff much longer than PAF1 is consistent.
To investigate why the two assays yielded somewhat different values, we inspected the first 90 seconds of the photoactivation and FRAP data where the effect of molecular re-association should be minimal (Supplemental Figure 3D). We observed that the photoactivation and FRAP show strong agreement at this early stage of the experiments. This led us to conclude that the later stages, when the curves plateau is a major driver of the exponential fit differences. Notably, the photoactivation experiments all approach a final value of approximately twenty percent remaining signal. This signal largely persists out to ten minutes post photoactivation (Supplemental Figure 3E), but is largely influenced by the volume of photoactivation (Supplemental Figure 3F). When we used single photon photoactivation, to activate a larger volume, the decay plateaued to thirty percent, and photoactivating a smaller region decreased the final signal to approximately ten percent initial signal. Therefore, it appears that the photoactivation signal does not return to zero due to a combination of “off-target” molecules, (molecules rapidly diffusing through the two-photon irradiated volume of the Hsp70 puff), being recruited to the Hsp70 puff and the ability of molecules at Hsp70 to be retained or re-recruited. Going forward we opted to focus on the photoactivation experiments due to their greater signal to noise and ability to directly observe the photoactivated molecules.
Half puff photoactivation and decay shows redistribution of factors across the Hsp70 puff
Given our observation that Spt6 resides at Hsp70 longer than Pol II, yet binds directly to Pol II, we decided to assess if Spt6 and other factors are reused, either between different chromatids or different copes of Hsp70 (Figure 2A). To answer this, we performed experiments photoactivating only half of an Hsp70 puff and measured the fluorescence intensity as a function of time in both the photoactivated (targeted) and non-photoactivated (non-targeted) halves of the puff (Figure 2B–C, Supplemental Movies 2A–J). We acquired faster, three second z-stacks to better observe if molecules diffused from one half of the puff to the other. After background subtracting and correcting for photobleaching (Supplemental Figure 4A–B) we fit a single exponential decay to the targeted puff halves (Figure 2D and Supplemental Figure 4C), and we noticed that the half-lives of P-TEFb, PAF1, and Spt6 were approximately half as long as the decay half-lives observed in the whole puff experiments (9.5 +/− 0.5 sec versus 17.8 +/− 1.1 sec), (12.8 +/− 0.7 sec versus 22.9 +/− 1.7 sec) and (36.3 +/− 4.9 sec versus 60.7 +/− 5.2 sec) respectively. However, Pol II and DSIF showed little difference in half-lives compared with the whole puff experiments (45.9 +/− 3.7 versus 41.1 +/− 1.9 sec for Pol II) and (40.4 +/− 5.1 versus 38.9 +/− 1.7 sec for DSIF). (Figure 2D).
Figure 2. Half puff photoactivation and decay shows redistribution of factors across the Hsp70 puff.

A. Schematic of half puff photoactivation experiments. A single Hsp70 puff is shown and outlined in white. Chromatids in parallel are shown with Pol II-PA-GFP transcribing prior to photoactivation. Half of the Hsp70 puff is targeted for photoactivation as in B. After transcribing the gene, the photoactivated Pol II-PA-GFP can leave this half of the puff and possibly be reused in the other half, leave the entire puff area, or be retained and reused in the targeted puff half. B. Schematic of experimental setup. Half of an Hsp70 puff is photoactivated (white dashed region). The signal in the targeted half and non-targeted half (cyan dashed) are then measured as a function of time.
C. Representative images of half puff photoactivation data. Images are maximum intensity projections of 4-slice z-stacks. The first two columns show pre-photoactivation in the HaloTag and PA-GFP channels respectively. PA-GFP is intensity colored to better show the range of signal (blue is low signal yellow-white is high signal). The third and fourth columns show 3 sec post-photoactivation as a merge of HaloTag and PA-GFP and color scaled PA-GFP. Subsequent images show PA-GFP at 21 and 90 sec post-photoactivation. White arrows denote targeted half of Hsp70 puff, cyan triangles show non-targeted half, puff is outlined by a white dashed line.
D. Background subtracted, bleaching corrected, normalized intensity of PA-GFP signal in the targeted puff half as a function of time for each factor. A single exponential decay curve was fitted to each factor to estimate half-lives. Data is mean and error bars represent +/− 95% a confidence interval. Replicates are independent nuclei acquired across at least two separate days of imaging. Pol II (n = 14), DSIF (n = 14), P-TEFb (n = 15), PAF1 (n = 15), and Spt6 (n = 17).
E. Background subtracted, bleach corrected PA-GFP signal in the non-targeted puff half. Data is from the same experiments as D and intensity is scaled to the initial intensity used in D so the signal can be compared.
See also Supplemental Figure 4.
In the half puff activation experiments, a photoactivated molecule can do one of three things: diffuse out of the whole puff, re-associate with the same half of the puff, or re-associate with the opposite half of the puff (Figure 2A). Re-association with either half contributes to maintaining the fluorescence signal in the whole-puff measurements, while only re-associating with the same side contributes to maintaining the fluorescence signal in the half puff measurements. Molecules with a high probability of re-associating within the puff will thus have a higher apparent rate of dissociation in the half-puff measurements than in the whole-puff measurements. If instead a molecule is more likely to diffuse out of the puff than to be retained, then half-puff and whole-puff measurements of the dissociation rate will be similar. Our results indicate that P-TEFb, PAF1, and Spt6 are better able to diffuse and re-associate within the puff than Pol II and DSIF.
In addition, we also observed that the signal in the non-targeted half of the puff increased over time in the P-TEFb, and PAF1 flies, and more slowly in Spt6 (Figure 2E). The difference between Pol II and Spt6 is clearer when measuring out to 240 seconds (Supplemental Figure 4D). This direct observation of molecular diffusion further shows that P-TEFb, PAF1 and Spt6 are retained within the Hsp70 puff and likely bind Pol II on neighboring chromatids. For Pol II and DSIF, we observed only a very slow increase of signal in the non-targeted half (Figure 2E), indicating little re-association. Thus, by photoactivating half of an Hsp70 puff, we observed that PAF1 and P-TEFb rapidly diffuse throughout the puff, Spt6 diffuses throughout the puff more slowly, and Pol II and DSIF show very little diffusion and rebinding in the puff.
Most elongation factors at Hsp70 are present at near stoichiometric equivalency to Pol II.
Due to the large size of the Hsp70 loci and our CRISPR tagging of the endogenous genes, we reasoned we could measure the relative abundance of Pol II to other factors at a transcribed locus. We crossed flies containing a PA-GFP tagged factor with Pol II-PA-TagRFP tagged flies 42. We photoactivated both tags in whole nuclei and measured the ratio of PA-GFP to PA-TagRFP at the Hsp70 puffs (Figure 3A–B and Methods). We noted that the total intensity of Pol II-PA-TagRFP was identical across all the PA-GFP crosses (Supplemental Figure 5A). Although the level of PA-GFP in homozygotes was not quite twice the intensity in heterozygotes, the ratio was consistent between factors, allowing relative comparisons to be made (Supplemental Figure 5B). Interestingly, DSIF, PAF1, and Spt6 showed approximately 67% the signal as Pol II, while P-TEFb showed only about 40% the signal of Pol II. Because DSIF is bound to Pol II from promoter proximal pausing through the gene body, the additional Pol II is likely in very early stages of transcription before association with DSIF (i.e., before stable pausing) or in late stages of transcription (i.e., post-cleavage polyadenylation). These observations suggest that up to a third of Pol II present at the Hsp70 loci is not yet actively engaged in transcription or is terminating.
Figure 3. Most elongation factors at Hsp70 are present at near stoichiometric equivalency to Pol II.
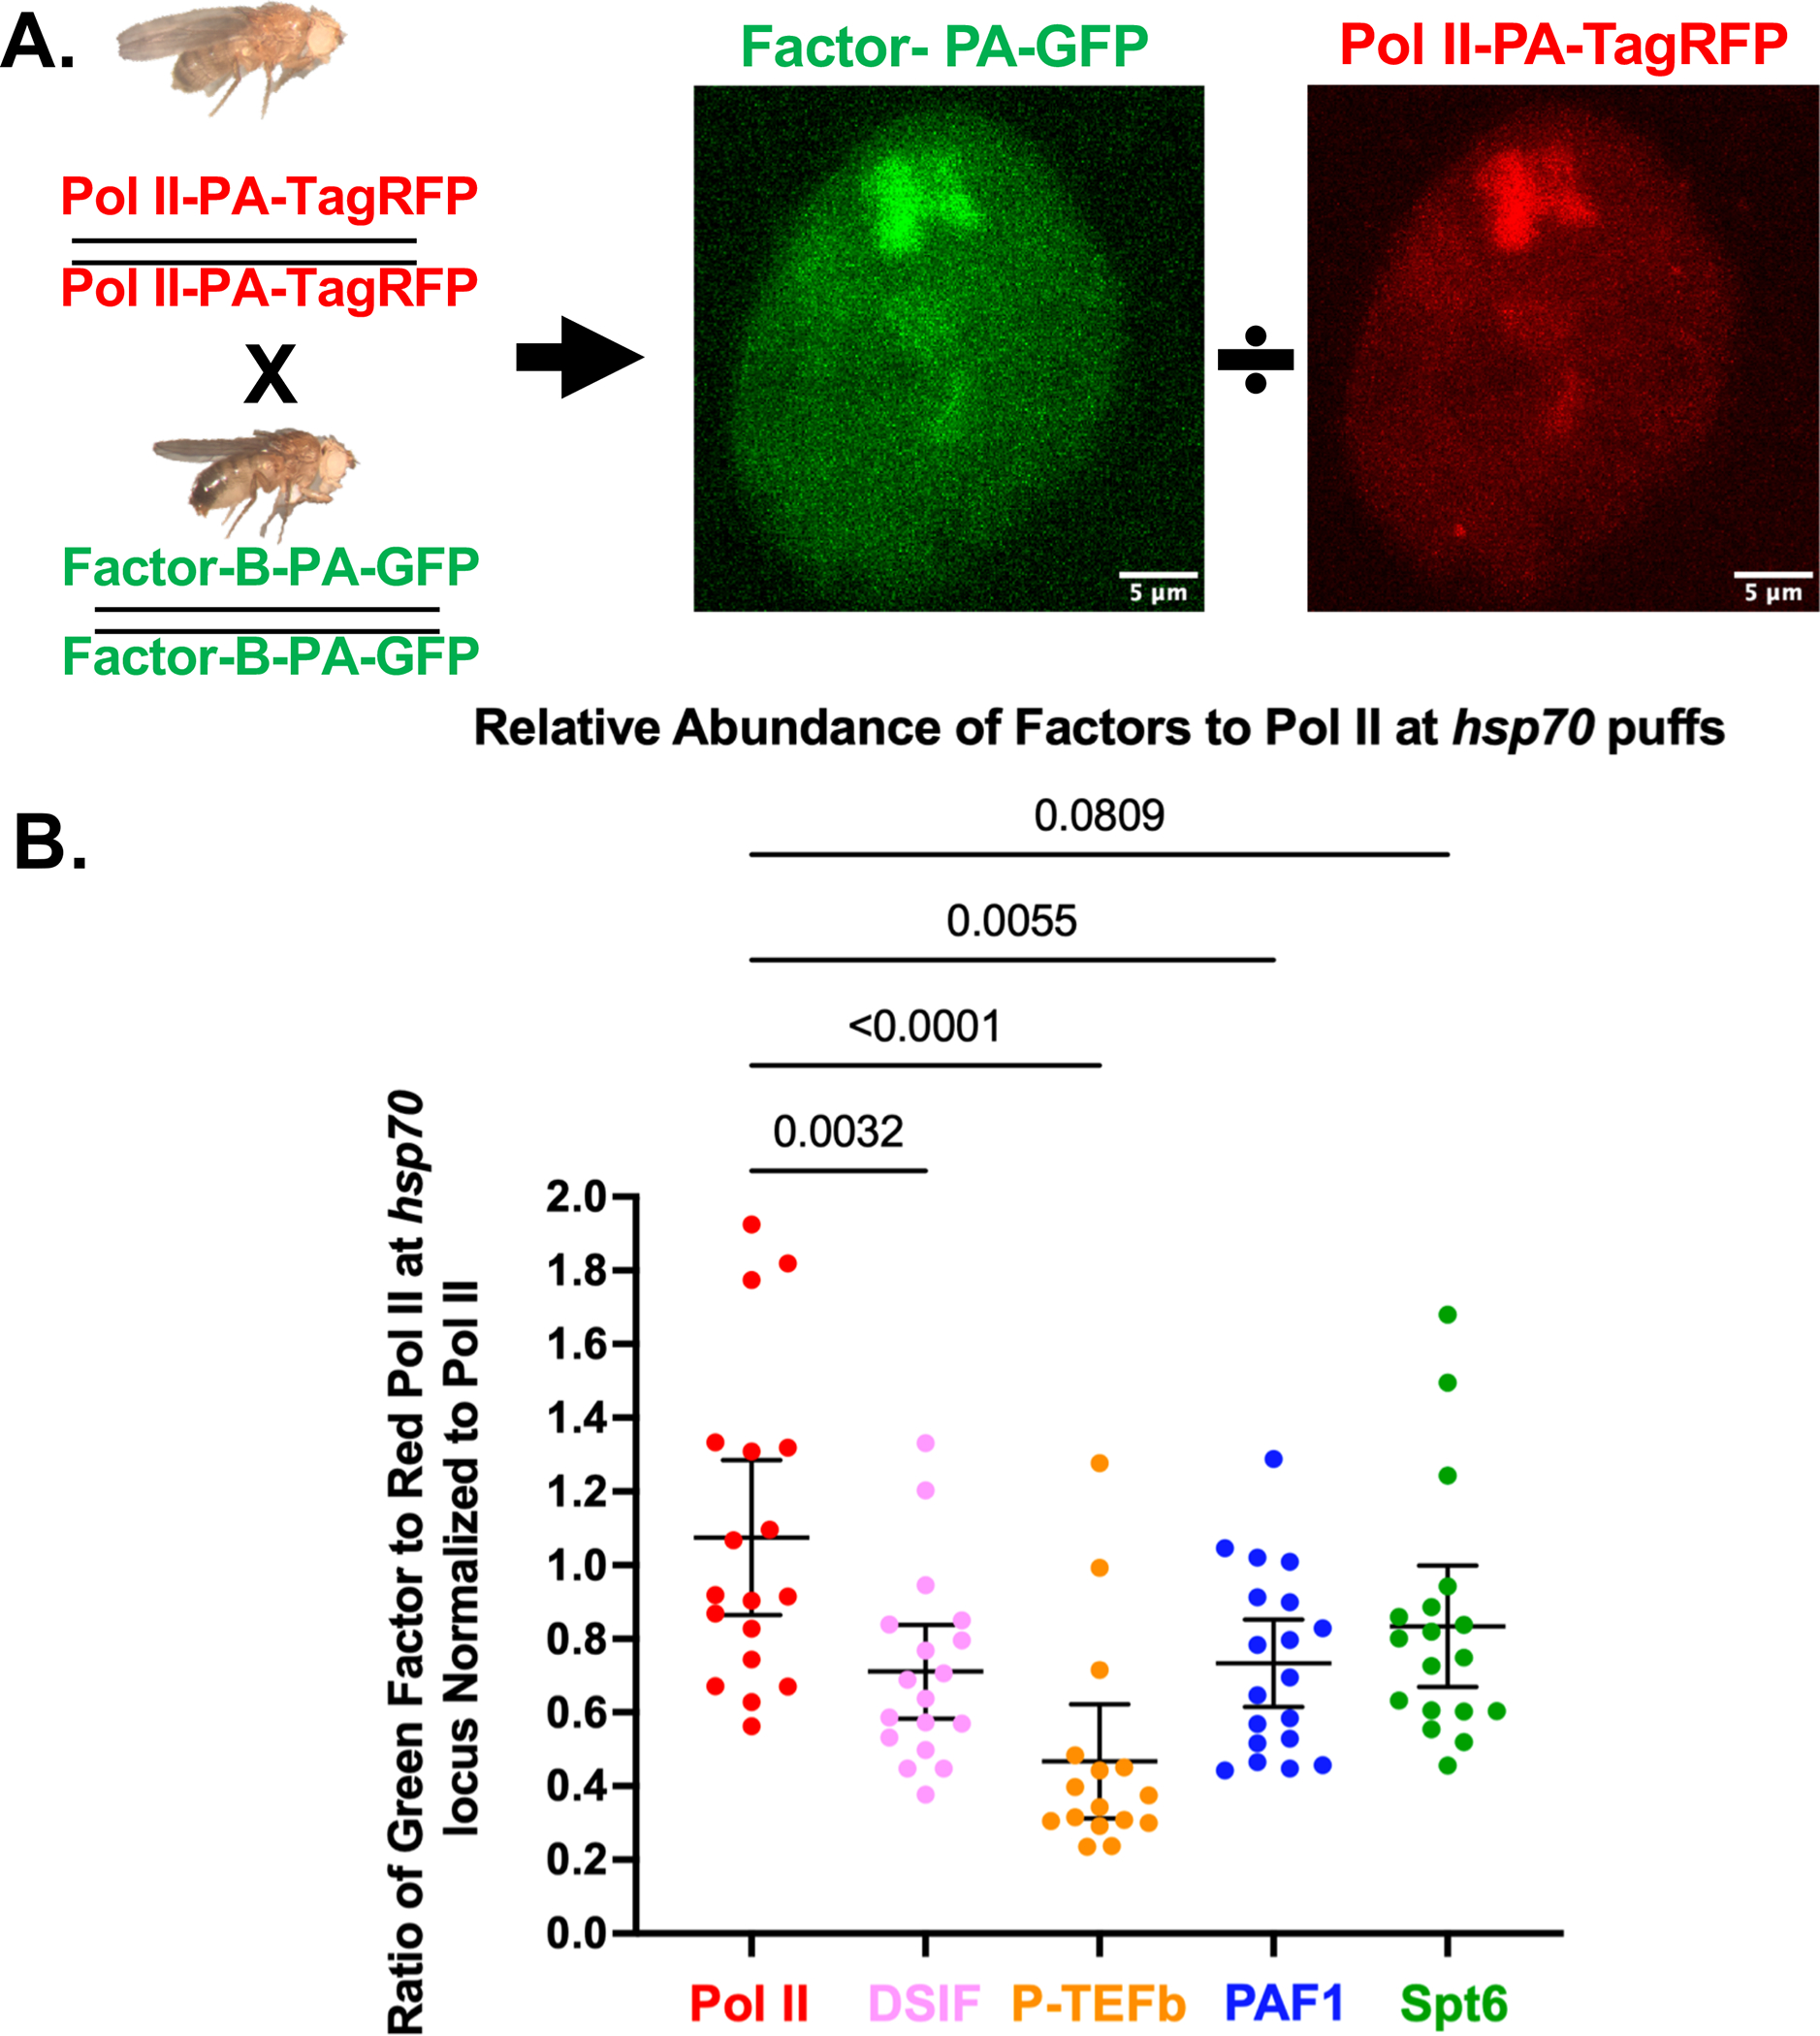
A. Schematic of experiments. PA-GFP knock-in flies are crossed to knock-in PA-TagRFP Pol II flies. Whole nuclei are photoactivated, and the ratio of PA-GFP for each factor is compared with a constant Pol II-PA-TagRFP.
B. Quantification of the relative abundance of each factor to Pol II. The ratio of signal intensity is normalized to the mean Pol II-PA-GFP over Pol II-PA-TagRFP ratio. Each dot is the ratio of the PA-GFP tagged factor over Pol II-PA-TagRFP for an Hsp70 doublet in an individual nucleus. The mean and a 95% confidence interval are plotted with each factor. P-values calculated from a one-way ANOVA are indicated.
See also Supplemental Figure 5.
PAF1 and Spt6 complexes are not recruited to Hsp70 upon P-TEFb inhibition
In addition to monitoring the dynamics of Pol II and other transcription factors at steady state, our live cell imaging system allows exploration of how these factors respond to targeted perturbations of specific steps in transcription. The results of such perturbations can potentially resolve conflicting models of how elongation factors affect transcription and its regulation. A notable subject of debate are the roles of the PAF1 and Spt6 complexes in transcription. Several labs have performed targeted, and rapid depletion of PAF1 and Spt6 40,41,43,44 and although the data was similar between the groups, their interpretations were quite different. One group concluded that PAF1 and Spt6 were regulators of Pol II pause release 40,43, while others concluded that PAF1 and Spt6 are elongation factors that are important for modulating the rate or processivity of Pol II transcription 22,41,44.
To assess the roles of PAF1 and Spt6, we inhibited pause release with the highly specific Cdk9 inhibitor NVP-2 45 and observed if the factors were still recruited to Hsp70. First, we validated NVP-2 can enter salivary glands and inhibit pause release (Supplemental Figure 6A and Methods). To measure the localization of Pol II, PAF1, and Spt6 upon NVP-2 treatment, we crossed Pol II-Halo, PAF1-Halo (both PAF1 and Ctr9-Halo), or Halo-NELF-A flies with a fly line containing HSF-mNeonGreen (mNG) 46; for the Spt6-PA-GFP line, we crossed it with HSF-Halo. HSF, the master regulator of HS genes, localizes to HS puffs, even if transcription is inhibited, allowing us to find the Hsp70 puffs in both control and drug-treated conditions. To match drug-treated and controls glands, we incubated both lobes of the same gland with HaloTag ligand JFX650, then we separated the two lobes of the gland at the duct (dashed line Figure 4A) and incubated one lobe in DMSO and the other in 3μM NVP-2 containing media (Figure 4A). After 5–10 min of HS, we acquired images to assess the extent of colocalization between HSF and each factor at Hsp70 (Figure 4B–F). With DMSO incubation, both HSF and Pol II are recruited to puffs and the two show high levels of colocalization as expected (Figure 4B top). After treatment with NVP-2, HSF still localizes to Hsp70, but the intensity of Pol II at the puffs is much lower and the puff size is smaller (Figures 4B bottom and 4G-H). These observations agree with previous findings that Pol II is recruited to the Hsp70 promoter and pause region upon heat shock even with P-TEFb inhibition 21,34,47.
Figure 4. PAF1 and Spt6 Complexes are not recruited to Hsp70 upon P-TEFb inhibition.

A. Schematic of experiments. Fly lines with an endogenous HaloTag knock-ins are crossed with endogenous knock-in HSF-mNeonGreen (mNG) (or HSF-Halo). As before, glands are dissected and stained with JFX650. To match samples, after staining, the individual lobes were separated at the duct (cyan dashed line), one lobe was incubated in 3 μM NVP-2 and the other in DMSO for 10 min prior to HS and imaging.
B. Representative images of Pol II-Halo, C. PAF1-Halo, and D. Ctr9-Halo, E. Spt6-PA-GFP, and F. Halo-NELF-A crossed with HSF-mNG (HSF-Halo for Spt6-PA-GFP) after treatment with DMSO or NVP-2 and a 6–10 min HS. White arrows denote the Hsp70 doublet as identified using HSF
G. Quantification of the total intensity of Pol II at the Hsp70 puffs for DMSO (n = 15) and NVP-2 (n = 17).
H. Quantification of Hsp70 puff size in Pol II-Halo samples (same samples as E).
I. Quantification of the total intensity of PAF1 at the Hsp70 puffs for DMSO (n = 12) and NVP-2 (n = 7).
J. Quantification of the total intensity of Ctr9 at the Hsp70 puffs for DMSO (n = 12) and NVP-2 (n = 14).
K. Quantification of the total intensity of Spt6 at the Hsp70 puffs for DMSO (n = 8) and NVP-2 (n = 10).
L. Quantification of the total intensity of NELF-A at the Hsp70 puffs for DMSO (n = 12) and NVP-2 (n = 15).
N is the number of individual nuclei. For quantifications, lines denote mean +/− 95% confidence interval. P-values from T-tests are shown in the figure.
See also Supplemental Figure 6.
We performed the same experimental scheme to examine the recruitment of PAF1, Ctr9, and Spt6 with and without P-TEFb inhibition. In the DMSO control, all three factors are robustly recruited to the Hsp70 puffs and show strong colocalization with HSF (Figure 4C–E top). However, glands treated with NVP-2 showed no detectable recruitment to the Hsp70 loci (Figure 4C–E bottom). Indeed, quantification of PAF1, Ctr9, and Spt6 shows they are absent from puffs with P-TEFb inhibition (Figure 4C–E and I-K). These data demonstrate that the P-AF1 complex and Spt6 are not recruited to genes if pause release is prevented by inhibition of P-TEFb. It has also been shown that Cdk12/13 play a role in PAF1 and Spt6 recruitment 48, however THZ531-mediated inhibition of Cdk12 did not noticeably affect the levels of PAF1 recruited to Hsp70 (Supplemental Figure 6B–D).
Next, we inhibited P-TEFb and assayed Halo-NELF-A (Figure 4F). Drosophila melanogaster genes are highly paused as previously measured with PRO-seq 49,50, so the numerous Halo-NELF-A bands are expected. Upon HS, glands incubated with DMSO show very little NELF-A signal at the Hsp70 loci. However, with NVP-2 treatment, NELF-A signal increases at Hsp70 (Figure 4E and 4L). These data, show NELF accumulates with promoter-proximal paused Pol II, if P-TEFb activity is inhibited. Together, our data with previous studies 47, demonstrate that upon P-TEFb inhibition, neither the PAF1 complex nor Spt6 are recruited to Hsp70 until NELF is removed and Pol II is released into productive elongation.
PAF1 knockdown leads to slower transcription with mild heat shock
Finally, we sought to measure the dynamics of Pol II upon knockdown of the PAF1 complex. We used an UAS-driven RNAi line from the Transgenic RNAi Project (TRiP) 51 targeting the Cdc73 (Hyx) subunit of PAF1. This RNAi led to smaller gland size and reduced the levels of the PAF1 subunit of the complex Supplemental Figure 7A–C). We confirmed that the loss of PAF1 was not only due to the smaller glands, because depletion of Spt6, using another TRiP line, also produced smaller glands but did not decrease PAF1 levels as severely. Comparing the ratio of PAF1 to Pol II-PA-GFP in a Luciferase RNAi control, with the Cdc73 and Spt6 RNAi’s, we see that the Cdc73 RNAi line greatly depletes PAF1 levels (Supplemental Figure 7C). Additionally, we noted that in the Spt6 RNAi, remaining PAF1-Halo was not recruited to actively transcribed Hsp70, in agreement with work from Aoi et al 40.
Having established our RNAi system, we crossed flies to generate larvae with HSF-Halo, Pol II-PA-GFP and salivary gland expressed RNAi (Figure 5A). We induced HS, located Hsp70 via HSF-Halo, and photoactivated Pol II-PA-GFP. As before, the loss of fluorescence fit an exponential decay (Figure 5B and C and Supplemental Figure 7D). Surprisingly, in both the Cdc73 and control knockdowns, Pol II signal at Hsp70 decayed at nearly identical rates. We previously reported that in a fully-induced, 36.5°C HS, Hsp70 shows low levels of nucleosome protection as assayed by MNase digestion 34. Additionally, our lab has shown that with a 36.5°C HS, elongating Pol II is able to run-on through the gene body equally efficiently with or without the addition of the detergent sarkosyl, which removes most proteins (not elongating Pol II) from DNA 52. However, this same study observed that at lower HS temperatures (33°C or lower), Pol II run-on is far less efficient if sarkosyl is not added, suggesting that at lower HS temperatures, more nucleosome obstacles may be present 52. To test the effect of HS temperature on nucleosome occupancy in salivary glands, we performed MNase digestion and qPCR in salivary glands after different temperature incubations (23°C, 32°C and 36.5°C) (Supplemental Figure 7E–F). We saw less nucleosome protection as a function of higher HS temperature. We note that our observed loss of nucleosomes was not as great as previously observed 34, but this could be due to using whole salivary gland tissues instead of cultured S2 Drosophila cells.
Figure 5. PAF1 knockdown leads to slower transcription with mild heat shock.

A. Experimental schematic. Flies containing salivary gland-specific Gal4-driver and Pol II-PA-GFP are crossed with flies containing HSF-Halo and UAS-driven shRNAs for Luciferase or Cdc73.
B. Representative images of Pol II-PA-GFP photoactivation and decay at 36.5°C and 32°C for both the control and Cdc73 RNAi. White arrows denote targeted Hsp70 locus. A doublet is not clearly visible with the presented exposure, but overexposure shows both puffs.
C. Background subtracted, bleaching corrected normalized quantification of Pol II-PA-GFP signal as a function of time. A single exponential decay is fit and half-lives are presented with 95% confidence intervals with the labels. N denotes independent nuclei from different larvae. Luciferase RNAi 36.5°C (n = 11), Luciferase RNAi 32°C (n= 11), Cdc73 RNAi 36.5°C (n = 12), and Cdc73 RNAi 32°C (n = 12). Error bars are 95% confidence intervals.
D. Experimental schematic of nascent RNA FRAP experiments. Flies containing an Hsp70 transgene marked by 256xLacO bound by LacI-mCherry and containing 24xMS2 loops in the middle of the gene are bound by MCP-GFP. This line also contains a salivary gland specific Gal4 driver. These flies are crossed to UAS-RNAi flies.
E. Representative images of 24xMS2 MCP-GFP FRAP experiments. White arrow denotes transgene puncta.
F. Quantification of MCP-GFP as a function of time. Data is plotted with 95% confidence intervals. Replicate numbers are (n = 5) for Luciferase RNAi 36.5°C, (n = 6) for Luciferase RNAi 32°C, (n = 8) for Cdc73 RNAi 36.5°C, and (n = 8) for Cdc73 RNAi 32°C. See also Supplemental Figure 7.
We repeated our Pol II-PA-GFP photoactivation experiments upon Cdc73 or Luciferase RNAi knockdown at 32°C, where Pol II levels are lower than at 36.5°C (Supplemental Figure 7G) and nucleosomes are less perturbed 52 and (Supplemental Figure 7F). In the control RNAi, Pol II showed an identical decay rate at both 36.5°C and 32°C (Figure 5C). However, in the Cdc73 RNAi, Pol II showed a longer residence time at the lower temperature. Given that PAF1 seemed expendable at the higher HS temperature, we were curious if PAF1 showed transient non-productive interactions at higher temperatures. Comparing PAF1-PA-GFP decay at 32°C and 36.5°C (Supplemental Figure 7H) showed very similar residence times, indicating that the lack of phenotype at 36.5°C is not due to a discernable PAF1 association defect at full HS.
To measure the effect of PAF1 on RNA production directly, we also examined synthesis of nascent RNA with control or Cdc73 RNAi at 36.5°C and 32°C using our previously described Hsp70 transgene with 24xMS2 loops in the middle of the gene 25. In this system, constitutively expressed MCP-GFP binds to MS2 loops in the RNA. By photo-bleaching the puncta of nascent RNA and measuring its recovery, we can observe the rate of RNA production. In agreement with our Pol II-PA-GFP decay data, we observed that in the control RNAi, RNA production rate is identical at 36.5°C and 32°C. However, Cdc73 RNAi knockdown caused a moderate decrease in the rate of RNA production and 36.5°C compared to Luciferase RNAi at the same temperature, and a greater rate decrease at 32°C (Figure 5D–F). Taken together, our data show that with depleted PAF1 complex, Pol II has an elongation rate defect when nucleosome densities are higher.
Discussion:
Measuring the residence times and re-association of Pol II and key regulating factors in live-cells at a known genetic locus provides a powerful approach to understand and constrain mechanistic models of transcription regulation (Figure 6). We showed that early in HS (6–10 min HS), most Pol II transcribes the Hsp70 gene once and then dissociates from the locus with minimal reuse. These observations disagree with the model of a pre-existing transcription factory where the same Pol II molecules can be efficiently re-used for iterative rounds of transcription. We also observed that DSIF, which is both a pause and elongation factor, shows nearly identical behavior to Pol II and is not immediately reused. Conversely, P-TEFb, PAF1, and Spt6 all diffuse to nearby chromatids within an Hsp70 puff, likely to rebind other Pol II molecules. While we cannot definitively observe binding events with our system, NVP-2-mediated P-TEFb inhibition prevented binding of elongation factors PAF1 and Spt6, eliminating their association with Hsp70 puffs. Therefore, we conclude that a large fraction of factor residence time is likely spent bound to Pol II.
Figure 6. Model of Pol II and transcription factor binding dynamics and reuse.

A. Promoter proximally paused Pol II shows bound NELF, but PAF1 and Spt6 cannot bind. B. Upon pause release, NELF is removed and P-TEFb rapidly and transiently interacts with Pol II phosphorylating Pol II, DSIF, and NELF. P-TEFb has been previously shown to interact with Pol II beyond the pause site as well 21.
C. Elongating Pol II is bound by elongation factors PAF1, which interacts transiently, and by Spt6 and DSIF, which remain bound to Pol II over transcription of the gene.
D. After termination, PAF1 and Spt6 dissociate and are reused to bind another transcribing Pol II while Pol II and DSIF are not rapidly reused.
“P’s” are phosphorylations, green by Cdk7 and orange by Cdk9 (P-TEFb).
An attractive model to describe the lack of observed Pol II and DSIF re-association is that both factors undergo extensive phosphorylation during transcription and must be dephosphorylated before re-engaging. It is known that Pol II initiates with a hypophosphorylated CTD 3,53, so before undergoing iterative rounds of transcription, Pol II (and DSIF) must be dephosphorylated. In D. melanogaster, Fuda et al. found that knockdown of the phosphatase Fcp1 led to an increase in non-chromatin associated hyperphosphorylated Pol II, and the knockdown of Fcp1 led to a fifty percent decrease in Hsp70 transcription 54. These previous results suggest that Pol II dephosphorylation is important for the enzyme to re-initiate transcription. Our results indicate that most polymerases are recruited to Hsp70 rather than the same molecules being retained and reused, at least early in the heat shock response. We note that previously performed FRAP experiments showed that Pol II, P-TEFb, and Spt6 exhibit less fluorescence recovery at later times in HS (greater than 20 minutes) 17. In this study, we focused on the dynamics at early times in the HS response to mitigate the possible effect of molecule reuse.
Unlike Pol II and DSIF, P-TEFb, PAF1, and Spt6 all appear able to re-associate with nearby chromatids. P-TEFb showed rapid diffusion across, and out of the puff. Our calculated half-life for P-TEFb in half of a HS puff, suggests that P-TEFb interacts with transcription complexes quite transiently, perhaps for a couple of seconds or less. This model is also supported by our measurement that P-TEFb is present at sub-stoichiometric levels compared with Pol II at Hsp70. To allow for rapid pause release, a limited number of P-TEFb kinases must quickly phosphorylate its targets and dissociate.
Spt6 is a histone chaperone that aids Pol II elongation through nucleosomes during transcription 12,41, and the PAF1 complex may have multiple roles in transcription, including chromatin modification via recruitment of histone modifying complexes 55. Although both PAF1 and Spt6 are bound across the gene body by ChIP assays 22,39,40, and both factors make extensive contact with Pol II 12, they showed strikingly different residence times at Hsp70. Žumer et al. reported that Spt6 remains associated with Pol II over transcription of the whole gene 41. This agrees with our photoactivation experiments that show Spt6 remains at a Hsp70 locus for a similar length of time as Pol II in the half puff experiments. However, unlike Pol II, Spt6 appears to be reused, which may be due Spt6’s lack of phosphorylation. Whereas Pol II and DSIF are highly phosphorylated, Vos and colleagues detected only two sites on Spt6 that are phosphorylated by P-TEFb in vitro 12. Therefore, Spt6 may be able to bind another Pol II after traversing through the gene.
Unlike Spt6, PAF1 shows a significantly shorter residence time than Pol II, suggesting a transient interaction with Pol II. This was surprising given the extensive contacts between the PAF1 complex and Pol II. However, structural studies have shown that NELF 12, the elongin and Super Elongation Complexes 56 bind Pol II in mutually exclusive manners. Also, a recent study demonstrated that in particular circumstances (Spt6 depletion), where PAF1 does not bind to Pol II, NELF binding increases 40. These observations suggest that PAF1 may compete with several complexes to bind Pol II and may describe PAF1’s transient interactions. We also measured that the relative level of PAF1 is similar to that of Spt6 and DSIF. Unlike P-TEFb, where sub-stoichiometric levels are sufficient, our data shows that PAF1 levels are similar to other elongation factors tested. This suggests that although PAF1 binds transiently, it readily rebinds available Pol II molecules.
Our RNAi depletion of PAF1 indicates that during a fully-induced HS (36.5C), where Pol II density is high and nucleosomes density is low, PAF1 may not be necessary for efficient elongation. However, at lower heat shock temperatures, when more nucleosomes are present, we noted an elongation defect when PAF1 is absent. With our population measurements, we cannot distinguish if our observations are due to all chromatids exhibiting slower transcription, or if some chromatids have normal transcription while others are largely stalled.
Finally, we were able to begin querying the effect of a specific perturbation to the transcription cycle. Upon P-TEFb inhibition with the highly specific Cdk9 inhibitor NVP-2, we recapitulated past results with the inhibitor Flavopiridol 21, showing that the level of Pol II at Hsp70 decreases dramatically if pause release is inhibited. While Pol II and NELF are clearly present at Hsp70 when pause release is inhibited, we did not detect any PAF1 complex, nor Spt6. These data show that the PAF1 complex and Spt6 are only recruited to sites of transcription after P-TEFb-mediated pause release.
Limitations
A limitation to our study is that bulk photoactivation and FRAP experiments do not allow measurement of individual molecular binding events; however, we can track a population of molecules over a longer time than single molecule experiments permit. Also, we note that our 2-photon photoactivation approach minimizes photoactivation of molecules not associated with Hsp70, however, some molecules rapidly diffusing through the irradiation laser are photoactivated. Though this small population contributes to whole nuclear background fluorescence, the small magnitude does not substantially affect our ability to measure the relative residence times of factors at Hsp70. Additionally, our study only used one gene as a model system for highly active transcription. It is possible that the dynamics of these critical transcription factors differ at other genes, which are transcribed at different levels, though we note that PAF1 and Pol II show nearly identical dynamics at two different temperatures, corresponding to different levels of transcription. We note that Hsp70 has been extensively studied and used as a model gene that has general mechanistic features seen more broadly in genome-wide assays 3,21. Furthermore, our data on Pol II residence time and consequently elongation rate is similar to what others reported when calculating elongation rates genome-wide 47,57,58.
STAR Methods
RESOURCE AVAILABILITY
Lead contact
Further information and requests for resources and reagents should be directed to and will be fulfilled by the lead contact, John Lis (jtl10@cornell.edu)
Materials availability
Plasmids and Drosophila lines generated for this study are available upon request and will be fulfilled by the lead contact, John Lis (jtl10@cornell.edu).
Data and Code availability
Raw imaging data, excel workbooks documenting the analysis, Prism files documenting data fits, and western blot images have been deposited to Mendeley Data and are publicly available as of the date of publication. DOIs and links are listed in the key resources table and are available upon request and will be fulfilled by the lead contact, John Lis (jtl10@cornell.edu).
This paper does not report original code.
Any additional information required to reanalyze the data reported in this paper is available from the lead contact upon request.
Key Resource Table.
| REAGENT or RESOURCE | SOURCE | IDENTIFIER |
|---|---|---|
| Antibodies | ||
| Anti-GFP | Protein Tech | 50430-2-AP, RRID:AB_11042881 |
| Anti-Rabbit HRP | Thermo | 31460, RRID:AB_2532095 |
| Anti-Rpb1 Ser2 | Abcam | Ab5095 RRID:AB_304749 |
| Anti-Drosophila Rpb3 | Lab stock (Andrulis et al 2000) 65 | N/A |
| Goat Anti-Rabbit 800 | LiCor | 926-32211 |
| Bacterial and virus strains | ||
| DH5 Alpha Supercompetent Cells | NEB | C2987 |
| Biological samples | ||
| Chemicals, peptides, and recombinant proteins | ||
| Grace’s Insect Medium | Sigma | 45-G8142-500ML |
| Janelia Fluor 650x | Gift from Luke Lavis Janelia Research Farms | Available Now from Promega CS315104 |
| Janelia Fluor 549 | Gift from Luke Lavis Janelia Research Farms | Available Now from Promega GA1110 |
| BbsI Restriction Enzyme | NEB | R0539L |
| T4 DNA Ligase | NEB | M0202L |
| HiFi Assembly Master Mix | NEB | E2621L |
| RNase Cocktail | Thermo | AM2286 |
| Proteinase K | Thermo | AM2548 |
| Protease Inhibitor Cocktail | Thermo | A32963 |
| MNase | NEB | M0247S |
| Sybr Green | Thermo | S7567 |
| Phusion HF Buffer | NEB | B0518S |
| PVDF Membrane | Millipore | 0000167543 |
| Enhanced Chemiluminescence (ECL) | Bio-Rad | 170-5060 |
| CL-XPosure Film | Thermo | 34090 |
| NVP-2 | MedChemExpress | HY-122114A |
| THZ531 | Caymen Chemical | 26386-1 |
| Critical commercial assays | ||
| ENZA Endo-Free Plasmid Midi Kit | Omega | D6915-03 |
| ENZA Plasmid Mini Kit | Omega | D6942-02 |
| Deposited data | ||
| Imaging Data used for figures, Western Blots, and sequences for CRISPR HDR plasmids | This Paper | Mendeley Data: https://data.mendeley.com/preview/4rxj5g76z8?a=6e697080-4aff-4e3e-abeb-c8485503459c DOI: 10.17632/4rxj5g76z8.1 |
| Imaging Data Fig 1: Pol II and DSIF | This Paper |
https://data.mendeley.com/preview/4vhdtshgx7?a=6179b8da-ea08-4e9c-a298-f4f9ed32be73 DOI: 10.17632/4vhdtshgx7.1 |
| Imaging Data Fig 1: P-TEFb and PAF1 | This Paper |
https://data.mendeley.com/preview/sc442hnfj5?a=67646232-428c-4150-b4dc-64a0d36a9be3 DOI: 10.17632/sc442hnfj5.1 |
| Imaging Data Fig 1: Spt6, excel analysis and Prism Graph Pad Plots and fits | This Paper |
https://data.mendeley.com/preview/2xfxmb9zkh?a=c57fbc98-d5ad-4a81-a717-e6f2566579b0 DOI: 10.17632/2xfxmb9zkh.1 |
| Imaging Data Supplemental Figure 2 Raw Data | This Paper |
https://data.mendeley.com/preview/crw4c8nb3y?a=b1654f18-50e8-4dbc-9410-07b3a3b0ee84 DOI: 10.17632/crw4c8nb3y.1 |
| Imaging Data Supplemental Figure 3 Dataset | This Paper |
https://data.mendeley.com/preview/tbb6r7cfzc?a=7e030c1d-c7d9-47e5-94d9-3852093237fd DOI: 10.17632/tbb6r7cfzc.1 |
| Imaging Data Figure 2 and Supplemental Figure 4 Raw Data, excel analysis, Prism graphs and fits | This Paper |
https://data.mendeley.com/preview/gy58myshy9?a=ceea7834-75db-4d62-bd9b-74d236d7e7a7 DOI: 10.17632/gy58myshy9.1 |
| Imaging Data Figure 3 and Supplemental Figure 5 Raw Data, excel analysis and Prism plots and T-test | This Paper |
https://data.mendeley.com/preview/yvbcw7m3dp?a=2c97b57c-e002-4ec3-a13f-85b69d703cc1 DOI: 10.17632/yvbcw7m3dp.1 |
| Imaging Data Fig 4. Pol II, PAF1, Ctr9, Spt6 | This Paper |
https://data.mendeley.com/preview/9t8wddtwsn?a=5e9628f3-5b8d-4a73-a3aa-1ce1ca9b1eda DOI: 10.17632/9t8wddtwsn.1 |
| Imaging Data Figure 4 NELF-A and Supplemental Figure 6 Raw data, excel analysis and Prism plots and T-tests | This Paper |
https://data.mendeley.com/preview/45j7d538cj?a=d9fbb3c7-61c3-4647-ac0a-606070b112c9 DOI: 10.17632/45j7d538cj.1 |
| Imaging Data Figure 5 Cdc73 RNAi Pol II PA-GFP decay. | This Paper |
https://data.mendeley.com/preview/ypyy9k5bfj?a=86fe214f-a54c-411d-9171-be13dbe982ce DOI: 10.17632/ypyy9k5bfj.1 |
| Imaging Data Figure 5. Luciferase RNAi data Pol II photoactivation and decay | This Paper |
https://data.mendeley.com/preview/dy7kjr8jrt?a=44e6db3f-cdfc-4c56-a25c-def729fdeed7 DOI: 0.17632/dy7kjr8jrt.1 |
| Imaging Data Figure 5 MS2 Raw data both RNAi | This Paper |
https://data.mendeley.com/preview/wp82jngz8s?a=d093e582-03d9-445f-9960-0f7fbce4d149 DOI: 10.17632/wp82jngz8s.1 |
| Imaging Data. Supplemental Figure 7C Raw Data | This Paper |
https://data.mendeley.com/preview/jpwfvsv6x4?a=b508bfdb-3afe-4b7b-b57a-0e6af56eeb27 DOI: 10.17632/jpwfvsv6x4.1 |
| Supplemental Figure 7H Raw Data | This Paper |
https://data.mendeley.com/preview/8dkzfjkxr2?a=3db6bb5d-22dc-44cd-a719-17fbc2f78beb DOI: 10.17632/8dkzfjkxr2.1 |
| Experimental models: Cell lines | ||
| Experimental models: Organisms/strains | ||
| Fly: y1w1118 | Bloomington Stock Center | #6598 |
| Fly: PiggyBac Transposase | Bloomington Stock Center | #8285 |
| Fly: FM7A Balancer | Bloomington Stock Center | #785 |
| Fly: Tm3,Sb/Tm6b Tb Balancer | This Paper | N/A |
| Fly: Cyo/Xasta ; Tm6b,Tb/Xasta | Gift from Dan Barbash | N/A |
| Fly: Luciferase RNAi | Bloomington Stock Center | 31603 |
| Fly: Spt6 RNAi | Bloomington Stock Center | 32373 |
| Fly: Cdc73/Hyx RNAi | Bloomington Stock Center | 31722 |
| Fly: Rpb9-Halo | This Paper | N/A |
| Fly: Rpb9-PA-GFP | This Paper | N/A |
| Fly: Rpb9-PA-TagRFP | This Paper | N/A |
| Fly: Halo-NELF-A | This Paper | N/A |
| Fly: Spt5-PA-GFP | This Paper | N/A |
| Fly: Cyclin-T-PA-GFP | This Paper | N/A |
| Fly: PAF1-Halo | This Paper | N/A |
| Fly: PAF1-PA-GFP | This Paper | N/A |
| Fly: Ctr9-Halo | This Paper | N/A |
| Fly: Ctr9-PA-GFP | This Paper | N/A |
| Fly: Spt6-PA-GFP | This Paper | N/A |
| Fly: HSF-mNeonGreen | This Paper | N/A |
| Fly: HSF-Halo | This Paper | N/A |
| Fly: Gal4 | Bloomington Stock Center | 6979 |
| Fly: Gal4 | Bloomington Stock Center | 6983 |
| Fly: Hsp70Transgene, LacI-mCherry ; hsp83-MCP-GFP | Buckley et al. 2014 25 | N/A |
| Oligonucleotides | ||
| See Table S2 | This Paper | N/A |
| Recombinant DNA | ||
| pCFD3-dU6 3gRNA | DGRC | RRID:DGRC_1435 1435 |
| pHD-Scarless-dsRed | DGRC | RRID:DGRC_1364 1364 |
| EasyFusion Halo | Addgene | 112850 |
| pTW-Rpb9-paG | Buckley et al. 2014 25 | N//A |
| pTG603 HSF-mNeonGreen homology donor | This Paper | N/A |
| pTG607 HSF-Halo HDR template | This Paper | N/A |
| pTG610 HSF-sgRNA | This Paper | N/A |
| Rpb9-Halo Homology Donor | This Paper | N/A |
| Rpb9-PA-GFP Homology Donor | This Paper | N/A |
| Rpb9-PA-TagRFP Homology Donor | This Paper | N/A |
| Rpb9 sgRNA | This Paper | N/A |
| Halo-NELF-A Homology Donor | This Paper | N/A |
| NELF-A sgRNA | This Paper | N/A |
| Spt5-PA-GFP Homology Donor | This Paper | N/A |
| Spt5 sgRNA | This Paper | N/A |
| Cyclin-T-PA-GFP Homology Donor | This Paper | N/A |
| Cyclin-T sgRNA | This Paper | N/A |
| PAF1-Halo Homology Donor | This Paper | N/A |
| PAF1-PA-GFP Homology Donor | This Paper | N/A |
| PAF1 sgRNA | This Paper | N/A |
| Ctr9-Halo Homology Donor | This Paper | N/A |
| Ctr9-PA-GFP Homology Donor | This Paper | N/A |
| Ctr9 sgRNA | This Paper | N/A |
| Spt6-PA-GFP Homology Donor | This Paper | N/A |
| Software and algorithms | ||
| FIJI Version 2.14.0 | Schindelin et al. 2012 | https://imagej.net/software/fiji/ |
| PRISM Version 10.1.1 | https://www.graphpad.com/features | N/A |
| Microsoft Excel 16.16.27 | https://www.microsoft.com/en-us/microsoft-365/p/excel-home-and-student/CFQ7TTC0HLKR?activetab=pivot:overviewtab | N/A |
| flyCRISPR Target Finder | Gratz, S.J.*, Ukken, F.P.*, et al. (2014) | http://targetfinder.flycrispr.neuro.brown.edu/ |
| Other | ||
| 35 mm PolyD-Lysine Coated No 1.5 Imaging Dishes | MatTek | P35GC-1.5-14-C |
EXPERIMENTAL MODEL AND STUDY PARTICIPANT DETAILS
Drosophila melanogaster stocks
All fly lines were maintained on glucose, agar, yeast food (D Food prepared by the Cornell Fly Kitchen https://cornellfly.wordpress.com/d-food/). Flies were cultured at 22°C and were transferred weekly or biweekly. For crosses to generate larvae suitable for imaging, we crossed 6–9 female virgins with 2–3 males, flies were transferred to a new vial every 1–2 days to prevent larvae overcrowding which yields larvae with smaller salivary glands. Wandering third instar larvae were used and salivary glands were carefully dissected in Grace’s Insect Medium (Sigma G8142). When collecting imaging data, we were careful to make sure the wandering third instar larvae were not too old, (no spiracles were visible emerging from the head), to minimize glue production in the glands and to minimize expression of the ecdysone genes, which are challenging to distinguish from the hsp70 genes. Additional details about CRISPR tagging and selecting flies can be found in the Methods Details below.
METHOD DETAILS
Designing and Cloning Plasmids for Fly Editing
Protein fusions were designed using input from a number of sources. First, if we had plasmids that were used to produce tagged factors in transgenic expression lines (e.g., Rpb9 25), we added fusion proteins to the same terminus of the endogenous gene. For proteins that we had not previously tagged, we examined cryo-EM structures from Vos et al. 7,12,59 to see if one terminus appeared less sterically constrained. Finally, (for some later lines) we looked in the Open Cell atlas 60 to examine which terminus had been successfully targeted.
After determining which terminus to tag, we used FlyCRISPR Target Finder 61 to determine the sgRNA sequence to use. We copied approximately 200 bases (from FlyBase 62) flanking either the start or stop codon and used NGG PAM only and maximum stringency settings. We found that our transformant recovery success was greatest for guide sequences as close to the desired cut site as possible, (just before stop codon for C-terminus fusions and just after the ATG start codon in N-terminal fusions), even if there were a couple more predicted off-target cut sites. Oligos encoding the sgRNA sequence were ordered from IDT, phosphorylated and annealed with a cooling rate of 0.1°C per second in a thermocycler. Phosphorylated and annealed oligos were ligated into BbsI digested and gel extracted pCFD3-dU6:3gRNA (acquired from DGRC Stock number 1435) using T4 DNA Ligase (NEB). Ligations were transformed into DH5 alpha, colonies were grown and sequence verified.
We used two different strategies to recover tagged transformants. 1) No selectable marker and “brute force” with PCR and 2) Insert an excisable dsRed cassette (from FlyCRISPR Scarless Editing https://flycrispr.org/scarless-gene-editing/). For both cases 1000 bp homology arms were cloned from D. melanogaster (Bloomington stock 6598) genomic DNA. (Shown Schematically in Supplemental Figure 1A, C). For lines generated without a selectable marker, PA-GFP was amplified from the plasmid denoted “pTW-Rpb9-paG” from Buckley et al.2014 25 and the HaloTag sequence was amplified from the Easy Fusion Halo plasmid (Addgene 112850). A four-piece HiFi Assembly (NEB 2x Master Mix E2621L) was performed with PCR amplified fragment of Amp/Ori, the 5’ homology arm, insert protein, and the 3’ homology arm. We used 75 ng of Amp/Ori fragment and 1:1 molar ratio of each other fragment in the assemblies. All fly lines in this study contained the same linker, a 6 amino acid GGSGGS peptide whether the fusion was attached to the N or C-terminus.
For lines generated with the dsRed selectable marker, the same Amp/Ori PCR amplified fragment was used as above. The excisable dsRed marker (including both PBac recognition sequences) was amplified from the pHD-ScarlessDsRed plasmid (DGRC Stock #1364). The dsRed cassette was inserted approximately 200 bp upstream or downstream of the start or stop codon (outside of the native transcript). A six-piece HiFi assembly was performed including the Amp/Ori fragment, a 5’ and 3’ homology arm, the tag of interest, the dsRed excisable cassette and a short spacer region of genomic DNA between the dsRed cassette and the desired tag. We used 75 ng of Amp/Ori fragment and a 1:1 molar ratio of all other fragments except the short “spacer fragment” we used 5–7 molar equivalents. All homology directed repair plasmids were transformed into DH5 alpha, colonies were grown up, and sequence verified with NanoPore whole plasmid sequencing from Plasmidsaurus (Eugene OR). After confirming sequences, plasmids were re-transformed into DH5 alpha, single colonies were grown in 50 mL of LB + 100 μg/ml Ampicillin and high-quality plasmid was purified using an Omega EndoFree Midi-Prep Kit (Omega SKU: D6915–03). DNA was sequence verified by NanoPore sequencing performed by Plasmidsaurus (Eugene OR) and then was concentrated to 800 ng/μL by ethanol precipitation and resuspended in DEPC treated MilliQ water.
Generating CRISPR-Cas9 Edited Fly Lines:
30 μg of concentrated DNA (both the homology repair and sgRNA plasmids in separate tubes) was sent to Rainbow Transgenic Flies Inc. (Camarillo, CA) for injection into fly embryos. If the targeted gene was on the X chromosome or chromosome 2, the nos-Cas9 attp2 line was injected, and for genes on chromosome 3 the nos-Cas9 attp40 line was used.
The following is shown schematically in Supplemental Figure 1A–B. Individual injected male flies were crossed with three y1w1118 females (Bloomington Stock #6598), and three injected females were crossed with two y1w1118 males. For lines with the dsRed visible marker, progeny were screened for bright red fluorescent eyes (or for flies with visible red eyes, the body of the fly is visibly fluorescent red). Flies were out crossed to the y1w1118 line for three generations before balancing and isolating homozygotes. To excise the visible dsRed, we crossed homozygous edited flies with a fly containing PiggyBac Transposase (Bloomington Stock #8285) at the recommendation of Professor Jill Wildonger and Josephine Mitchell at University of Wisconsin, Madison). This fly line contains PiggyBac Transposase on a Curly chromosome. To select for the loss of dsRed, we closely examined the eyes of curly-winged progeny and selected individual flies that showed a mosaic red eye pattern (See Supplemental Figure 1A). We crossed the mosaic red-eye flies to flies containing a balancer on the corresponding chromosome. In the resulting progeny we selected flies that completely lost their red fluorescent eyes. After removing the balancer, PCR from a squashed fly (described below) was performed to confirm the flies were homozygous for the knock in.
For lines that did not have a visible marker, we followed a similar scheme as above, except we outcrossed the transformed flies for three generations, then balanced the flies and removed the balancer (schematically shown in Supplemental Figure 1C). Screening was performed by PCR along the way. After crosses generated a suitable number of larvae, the injected fly was squished in 200 μL of fly squish buffer (10 mM Tris pH = 8.0, 1 mM EDTA, 25 mM NaCl and 2 μL of RNase Cocktail (Thermo AM2286). The squashed fly was incubated at 37°C for 2 hours, then 1 μL of Proteinase K (NEB P8107S) was added and incubated at 37°C for 1 hour. Proteinase K was inactivated by boiling the sample at 95°C for 5 minutes. 20 μL PCR’s were performed using homemade Phusion polymerase and 0.7μL of squish prep. For the first cross (from injected flies) primers were used that bound to the knocked-in tag and to the 5’ or 3’ homology arm. Subsequent PCR’s used primers that flank the insertion site (one binds the 5’ homology arm the other binds the 3’ homology arm), the knock-in tag generates a larger band than the wild type allele. After three generations of outcrossing, flies were balanced, then the balancer was removed and PCR was performed to confirm a homozygous fly (shown in Supplemental Figure 1D).
In-gel Fluorescence Assay:
To confirm that proteins were expressed as full-length HaloTag fusions, we performed in-gel fluorescence assays. Briefly, 5 flies were squished in 135 μL of fly squish buffer (10 mM Tris pH = 8.0, 1 mM EDTA, 25 mM NaCl) supplemented with 1x Pierce Protease Inhibitor Tablet (Thermo A32963). 2 μL of 100 μM JFX650 (kindly provided by Luke Lavis at Janelia Research Campus) was added to the mixture and incubated in the dark for 20 min. Next, to aid protein solubilization, 15 μL of 10% SDS was added. 20 μL of solution was removed from the top of the tube and 5 μL of 5x SDS Loading buffer (5% B-mercaptoethanol, 0.02% bromophenol blue, 30% glycerol, 10% sodium dodecyl sulfate, 250 mM Tris pH = 6.8) was added. Samples were boiled at 95°C for 5 min and 20 μL was loaded onto a 6–15% gradient SDS PAGE. Samples were run slowly until the visible dye front just ran off the bottom of the gel. (Free JFX650 runs with the dye front). The gel was imaged on an Amersham Typhoon using the Cy5 laser (635 nm excitation, 670BP30 filter) (shown in Supplemental Figure 1E).
Western Blot
To confirm that proteins were expressed as full-length PA-GFP fusions, we performed Western blots probing for GFP. To verify protein fusions, 3 adult D. melanogaster were squished in 100 μL of Fly Squish Buffer (10 mM Tris pH = 8.0, 1 mM EDTA, 25 mM NaCl). supplemented with 1x Pierce Protease Inhibitor Tablet (Thermo A32963). After the flies were squished, SDS was added up to 10% to aid protein solubilization. 20 μL of solution was removed from the top of the tube and 5 μL of 5x SDS Loading buffer (5% B-mercaptoethanol, 0.02% bromophenol blue, 30% glycerol, 10% sodium dodecyl sulfate, 250 mM Tris pH = 6.8) was added. Samples were boiled at 95°C for 5 min and 10–20 μL was loaded onto a 6–15% gradient SDS PAGE. The gel was run until the loading dye reached the bottom of the gel. The gel, 5 pieces of Wattman Paper, and the PVDF membrane (after a dip in 100% methanol) were soaked in 25 mM Tris-base, 192 mM glycine and 10% methanol. The gel was transferred to a 0.45 μm PVDF membrane (Millipore 0000167543) for 1 hour at 23 volts max, 400 mA max using a BioRad Trans-Blot SD Semi-Dry transfer cell. The membrane was stained with Ponceau S solution to verify transfer and assess loading consistency. The membrane was then blocked with PBS-T + 5% milk (137 mM NaCl, 2.7 mM KCl, 10 mM Na2HPO4, 1.8 mM KH2PO4, and 0.1% Tween-20) for 30 min at room temperature (22°C). To detect GFP we used a 1:2500 dilution of ProteinTech anti-GFP Rabbit antibody(50430–2-AP) in PBS-T + 5% milk and incubated overnight at 4°C. The following day the membrane was washed 3 times for 5 minutes with PBS-T, incubated with 1:10,000 goat-HRP anti-Rabbit (Thermo 31460) for 30 min at room temperature. The membrane was washed 3 times for 5 minutes and then developed with Clarity Western ECL substrate (Bio-Rad 170–5060) with CL-XPosure Film (Thermo 34090) (See Supplemental Figure 1F and G). Later Western Blots were performed as indicated except in place of HRP development, blots were imaged using LiCor anti-Rabbit Goat 800 (LiCor 926–32211) secondary. LiCor secondary antibody was diluted at 1:13,000 in PBS-T and incubated with the blot for 30 min at room temp. The blot was wash 3×5 with PBS-T, then one time with PBS and was then scanned with using an Odyssey M scanner (LI-COR Biotech, Lincoln NE).
Dissection of Salivary Glands for Microscopy:
Crosses between homozygous fly lines containing factors with PA-GFP and HaloTag factors were set up on D Food prepared by the Cornell Fly Kitchen https://cornellfly.wordpress.com/d-food/. Approximately 6–9 females and 3 males were crossed and flies were switched to a new vial every day or two to prevent overcrowding of the larvae; as shown in Figure 1A, progeny are double heterozygotes for both the PA-GFP tagged factor and the HaloTagged factor. As described previously 63, wandering third instar larvae were dissected in wells of a small 8-well glass dish containing Grace’s Insect Medium (Sigma G8142). Glands were stained by submerging them in 400 μL of Grace’s Insect Medium containing 200 nM JFX650 for 10 minutes. Glands were washed by transferring them into Grace’s without dye two times for 5 minutes each. During the staining process, some glands turn opaque white in color: these are not used as most of the cells appear to be dead. Healthy glands were mounted in a new, clean MatTek dish (P35GC-1.5–14-C) containing 200 μL of Grace’s medium. To hold the glands to the bottom, the gland duct was gently tapped onto the bottom coverslip and residual fat bodies flanking the glands were gently tapped down as well. A 22 mm square coverslip was placed over top of the well. This prevents liquid evaporation and prevents liquid from sloshing and dislodging the gland from the floor.
Heat shock was induced by placing the mounted gland on a heat block with the wells filled with water set to 36.5°C. After approximately 4 minutes of heat shock, the sample was transferred to a Zeiss LSM880 inverted microscope with a sealed incubation chamber measuring 36.5°C. The chamber was preheated for approximately 30 minutes to ensure the entire chamber and the objective lens reached a constant temperature. All imaging, photoactivation and bleaching was performed with a Zeiss C-Apochromat 40x/1.2 NA water immersion objective lens. The gland was quickly located in brightfield. Next, an individual nucleus was located by looking for a clear heat shock doublet (the two brightest puffs in the gland) in the far-red channel. We focused on nuclei near the bottom coverslip as these were the brightest and clearest.
Whole Puff Photoactivation and FRAP Acquisition
Imaging data was acquired as follows. Approximately 6–10 minutes post-induction of heat shock, a ten-slice z-stack was recorded pre-bleaching/pre-photoactivation. The gland was simultaneously scanned with a 488 nm Argon laser (127 μW in the sample plane, 9% power) and a 633 nm laser (63.8 μW, 4.5% power). The 488 and 633 excited emissions were collected from 490 to 560 nm and 638 to 695 nm, respectively, using a pinhole setting of 1.5 Airy Units, (relative to the 488 nm excited fluorescence emission) yielding an optical section thickness of ~0.74 μm. Following the first image, a region of interest corresponding to one of the two Hsp70 puffs was simultaneously photo-bleached (HaloTag) by the 633 nm laser at 1.36 mW at the sample, and photoactivated (PA-GFP) by a Spectra-Physics Insight femtosecond 2-photon laser set to 810 nm delivering ~32 mW for 60 iterations (0.53 seconds per iteration). Immediately following photo-bleaching/photoactivation, a 10-slice z-stack was taken using 0.74 μm steps in z. This first z-stack captures some rapidly diffusing PA-GFP molecules, so for analysis of binding time this frame was omitted. Seven seconds after photo-bleaching/photoactivation another 10-slice z-stack was taken (this second z-stack was used as the initial signal to calculate decay curves) and subsequent z-stacks were taken every 10 seconds for a total of 32 z-stacks. Nuclei that drifted in Z were not analyzed; those that drifted in XY but remained in the same focal plane were used after adjusting XY coordinates. The number of replicates (n) for each experiment are listed in the figure legend. For the whole puff photoactivation experiments, each n is from a single nucleus from a different larva, thus each replicate is biologically independent.
Half Puff Photoactivation Acquisition
For half puff experiments, the same sample preparation and heat shock was performed as described above with the following changes. After locating the nuclei to be imaged, a region of interest was marked targeting half of one of the Hsp70 puffs. The same laser power, bleaching parameters, and pinhole settings as described above were used. A smaller 4-slice z-stack (0.74 μm spacing) was acquired every three seconds for a total of 41 images. As in the whole puff experiments, the first z-stack was omitted to allow rapidly diffusing molecules to leave the region of interest. The z-stack acquired at 3 seconds post-photoactivation was used as the first image in the analysis. In the half-puff experiments, the n for each factor is reported in the figure legend. Because the half puff experiments are shorter than the whole puff experiments for some samples multiple nuclei from the same gland were imaged, n refers to unique nuclei. The number of biologically independent glands observed was: Pol II = 12, DSIF = 12, P-TEFb = 11, PAF1 = 11, Spt6 = 12.
Photobleaching Correction:
To correct for photobleaching, we acquired bleaching data during the same imaging sessions as photoactivation data. Bleaching data sets were acquired using identical settings as the photoactivation data: 6–10 min into heat shock, a 488 nm Argon laser at 127 μW (9% power) and a 633 nm laser at 63.8 μW (4.5% power) was used and the pinhole setting was set to 1.5 Airy Units. Ten-slice stacks, centered around the focal point of photoactivation, were collected every 10 seconds (for whole puff activation) or 4-slice stacks every 3 seconds (for half puff activation). The only difference was that a 405 nm laser (at 500 μW in the sample plane) was used to photoactivate the sample (instead of the two-photon laser) and no 633 nm bleaching was performed. The 405 nm laser photoactivates the entire volume of the cell (as opposed to the 2-photon photoactivation which only photoactivates a thin section in z). To determine a photobleaching correction, we measured the total nuclear PA-GFP signal (in the z-slices acquired), as a function of scan number. We noticed that in the second frame after photoactivation the PA-GFP signal drops sharply, but then in the third frame the signal rebounds before subsequent frames show a consistent bleaching pattern (Supplemental Figure 2B and C). Rather than attempt to fit a model to the bleaching data, we determined the average relative PA-GFP signal after each frame and applied a correction. We assume that no PA-GFP signal leaves the nucleus during the imaging time frame, so apart from bleaching, the PA-GFP signal should remain at a normalized level of 1. As a point of comparison, we fit a linear model to a semi-log plot of normalized fluorescence intensity to scan number and found that approximated 0.13% of PA-GFP signal is lost per laser scan, or 1.3% of signal is lost per 10-slice z-stack. Both corrections performed similarly.
Image Analysis:
All image analysis was performed with ImageJ/FIJI (Version 2.14.0) 64. Briefly, images were opened in FIJI and maximum intensity projections of 10 (whole puff activation experiments) or 4 (half puff activation experiments) slice z-stacks were made. An ROI was drawn around the photoactivated Hsp70 puff as close to the edge of the photoactivation signal as possible. The ROI area, mean, and integrated intensity were measured by adding the ROI to the ROI manager tool. The same size ROI was used for each frame in the movie. To correct for gland movement, we toggled back and forth between the 488 nm and 633 nm channels to realign the ROI in the 633 nm channel. After analyzing all frames in the PA-GFP channel, we copied the data into an excel document. We then used the same ROI and measured the intensities in the 633 nm channel. We next measured the background in the whole nucleus (whole puff photoactivation) or adjacent to the puff (half puff activation, described in more detail below). For the whole puff activation experiments, we measured the mean intensity of the whole nucleus, omitting any visible puffs and the nucleolus (if it was visible in the imaged section). We then scaled the average background intensity by the size of the whole puff ROI to acquire an “average background intensity”. We then corrected the images for photo-bleaching as described above.
To plot relative fluorescence intensity as a function of time, we subtracted the initial, pre-photoactivation signal from each time point of the image time series, then we normalized the second frame post-photoactivation to 1. We chose to omit the first frame immediately after photoactivation because we frequently observed a large “cloud” of photoactivated molecules around the puff. This cloud was present for the first frame acquired immediately after photoactivation but dissipated rapidly and was not present for the second frame (acquired 7 or 3 seconds after photoactivation for whole and half puff experiments respectively).
Finally, we plotted the data in GraphPad Prism (Version 10.1.1), and fit a single exponential decay to the curves. Even though there are multiple ways that some proteins, such as Pol II can leave the Hsp70 locus (finish transcription of the gene or premature termination), we found that a single exponential decay fits the data just about as well as a 2-component exponential decay. Therefore, we opted to use the simpler model to describe the PA-GFP signal decay.
Half Puff Background Subtraction:
To quantify photoactivated signal in the non-targeted half as accurately as possible, we used a different background subtraction than for the whole puff experiments. Immediately after photoactivation, non-bound molecules diffuse away from the targeted region and as time passes bound molecules dissociate and diffuse away from the puff. To account for the background of diffusing molecules, we used the neighboring space outside of the targeted half, opposite the non-targeted half, as our background to subtract (Supplemental Figure 2C). This allowed us to monitor the background due to diffusion that is the same distance and orientation from the targeted half as the non-targeted half. Following background subtraction from both the targeted and non-targeted halves of the puff, subsequent analysis was the same as described above for the whole puff photoactivation experiments.
Drug Treatment and RNAi Knock-down Experiments:
Experiments with drug treatments and RNAi were performed essentially the same as the Photoactivation/FRAP experiments described above. For drug treatments salivary glands were dissected in Grace’s insect medium and stained with 200 nM JFX650 in Grace’s Insect Medium. Glands were carefully separated at the duct and one lobe was incubated in Grace’s Insect Medium containing drug (either 3 μM NVP-2 (MedChemExpress HY-122114A) or 500 nM THZ531 Caymen Chemical 26386–1) and the other lobe was incubated in Grace’s containing the equivalent volume of DMSO for ten minutes. Glands were then mounted on MatTek dishes containing 200 μL of Grace’s plus either DMSO or the same concentration of drug.
For RNAi experiments flies containing the salivary gland-specific Gal4 driver (Bloomington Stock Number 6979) and endogenously tagged Pol II-PA-GFP were crossed to flies containing endogenously tagged HSF-Halo and UAS-RNAi inserted at attP2. The RNAi lines were acquired from Bloomington Stock Center and produced by the Transgenic RNAi Project (TRiP 51). For a control, we used a RNAi against the Luciferase Gene (Bloomington Stock Center 31603). To target specific factors for knockdown, we used a RNAi against the PAF1 component Cdc73 (denoted hyx in Drosophila (Bloomington Stock Center 31722) or a RNAi against Spt6 (Bloomington Stock Center 32373). Glands were dissected from wandering third instar larvae as before. The crosses to the Cdc73 and Spt6 RNAi’s yielded much smaller glands. Care was taken to avoid harming the glands during dissection.
Quantification of Hsp70 associated factors at steady state
Analysis of the levels of factor present at the Hsp70 loci (Figures 3 and 4) was performed in FIJI/ImageJ as follows. Max intensity projections of the whole z-stack (encompassing the entire volume of several nuclei) were created. Using the HSF-mNG (or HSF-Halo), (for Figure 4) or the Pol II-PA-TagRFP (in Figure 3) an ROI was drawn around both Hsp70 puffs. In instances where the Hsp70 doublet is hard to make out in the HSF channel (Figure 4), we verified that the ROI encompassed the puffs by checking in the opposite channel (HaloTag except for Spt6-PA-GFP where the color channels are reversed). We then measured the entire area of the nucleus (to measure the puff size/nuclear area ratio) and then measured background by selecting a large ROI that did not encompass the nucleolus nor any visible puffs. To subtract background, we scaled the average intensity of the background region to the area of the Hsp70 puffs for each nucleus. We then subtracted size-scaled background from the intensity at the Hsp70 puffs. N denotes the number of individual nuclei and is written in the figure legends. Finally, T-tests were performed to assess if two samples were statistically different (for instance control and drug treated samples) and a one-way ANOVA was used if more than two samples were compared. Both tests were performed using GraphPad PRISM version 10.1.1. and calculated p-values are displayed in the figures.
MNase Digest Nucleosome Protection Assay:
We based this experiment off the procedure described by Petesch and Lis 34 but adjusted it to work for salivary glands instead of S2 cultured cells. Forty pairs of salivary glands from y1w1118 (Bloomington Stock #6598) third instar wandering larvae were dissected and transferred into 3 dishes each containing 2 mL of 22°C Grace’s Insect Medium (the lid of a 35 mm dish was used to allow the glands sufficient oxygen during the dissection process, which took ~1 hour). To induce an instantaneous heat shock pre-warmed media was quickly added to the glands, then temperature was maintained by moving the dish from the bench to a pre-warmed heat block. For the full 36.5°C heat shock 2 mL of media pre-warmed to 52°C was added, for the moderate heat shock, 2 mL of 43°C media was added, and for the non-heat shock, 2 mL more 22°C media was added. After 7-min all dishes were transferred to a heat block filled with water at room temperature and allowed to cool for 1 minute. Formaldehyde was added to 1% final concentration and glands cross-linked for 10 min at 22°C. Glycine was added to 300 mM final and the samples were incubated for 5 min. For each sample, glands were carefully transferred (by forceps as they stick to the inside of pipette tips) into 1 mL of pre-chilled nuclear isolation buffer (110 mM NaCl, 1.9 mM KCl, 10 mM Tris pH = 8.0, 1 mM MgCl2, 0.1% spermidine and 1% NP-40 in a 1 mL dounce homogenizer. Glands were broken with 30 strokes using a tight pestle. Gland nuclei and debris was transferred to a 1.7 mL tube, residual nuclei were washed from the walls of the dounce with 500 μL more nuclei isolation buffer. A quick 5 second bath sonicator (Diagenode Bioruptor) pulse was used to completely destroy the gland structure. Samples were spun at 500 g for 5 min, resuspended in 1 mL of nuclei isolation buffer with only 0.2% NP-40 and no Spermidine. Samples were spun at 500 g for 5 min and the resulting pellet was resuspend in 1 mL of MNase Buffer (50 mM Tris pH = 7.9, 5 mM CaCl2 and 0.2% NP-40. Samples were sonicated for a 5 sec pulse (Dagenode Bioruptor) to break up clumps. The resuspended pellet was evenly partitioned into two tubes. Samples were spun down at 500 g for 5 min, all the supernatant was removed all and 100 μL of MNase buffer was added. Following, 125 U of MNase (NEB M0247S) was added to one tube of each sample and MNase buffer to the other, samples were incubated at 37°C for 30 min. MNase was inactivated by adding EGTA to a 20 mM final concentration. RNA was digested using 2 μL of RNase cocktail for 60 min at 37°C. DNA was isolated by phenol chloroform extraction and ethanol precipitation. The DNA pellet was resuspended in 17 μL of MilliQ water, and was quantified by Qubit dsDNA High Sensitivity Assay. For all -MNase samples, the concentration of DNA was brought to the same level but for each paired +MNase and −MNase the ratio of DNA was kept constant.
qPCR:
Sequences for qPCR primers were taken from Petesch and Lis 2008 34, standard curves were performed to validate primer efficiency before further use. For each 40 μL PCR reaction, 2.5 ng of genomic DNA was used as input. PCR was performed using Phusion Polymerase (made in lab) and Sybr Green (Thermo S7567). Final concentrations were 1x Phusion HF Reaction Buffer (NEB B0518S), 0.2 mM dNTPs, 0.5 μM primer and 1x Sybr Green. Three technical replicates, each 10 μL, were partitioned into wells of a clear 384 well plate. qPCR was performed using a Roche LightCycler® 480. Reactions were denatured at 98°C for 10 sec, held at 65°C for 20 sec and extended at 72°C for 10 sec for 40 cycles. All Cp’s used were in the linear range for the primer set. Data was analyzed using the 2−ΔΔCt method 2-[Hsp70 gene primer (Non-digested – Digested) – Downstream of Hsp70 Primer (Non-digested – Digested)] where the Hsp70 gene primer corresponds to primer pairs at positions 1–5 in Supplemental Figure 7D and Downstream of Hsp70 primer refers to primer pairs 6 and 7 in Supplemental Figure 7D). After performing the 2−ΔΔCt calculation, each experiment was normalized to 1 at Non-heat shock (22°C). Three independent biological replicates were performed. The replicates were averaged and a T-test was performed to assess statistical significance using Prism version 10.1.1.
QUANTIFICATION AND STATISTICAL ANALYSIS
Photoactivation and FRAP Analysis:
For PA-GFP photoactivation and HaloTag FRAP experiments the mean has been plotted with 95% confidence intervals (calculated using Prims Version 10.1.1). For single exponential fits to the data, all parameters and 95% confidence intervals are reported (See Supplemental Figure 3A, Supplemental Figure 4 C, and Supplemental Figure 7D. The number of nuclei imaged is denoted in the figure legends. We chose to plot the data with 95% confidence intervals to allow for comparison of each factor to Pol II. Although blinding was not performed, the experiments offer a level of blinding because prior to photoactivation the level of PA-GFP at Hsp70 is not visible. We chose nuclei to image based on two criteria: 1. Proximity to the coverslip and 2. Morphology of the Hsp70 puffs. Nuclei that are not near the surface of the coverslip are dimmer and do not photoactive/bleach as well due to light absorption, so nuclei that were near the surface of the gland were used. We also selected for nuclei where a clear Hsp70 doublet was visible. In some nuclei the two puffs appear like a single puff due to the orientation of the chromosomes. Sectioning in Z it is clear that there are two puffs, but to allow for my precise targeting for photoactivation and subsequent analysis we chose nuclei where two Hsp70 puffs were clearly distinct. We imaged each factor over at least two days and were satisfied that each factor was examined roughly the same number of times.
Quantification of Factor Abundance:
For Figures 3, 4 and Supplemental Figure 7A–C, we quantified signal at the Hsp70 puffs and in the whole nucleus. We used the same criteria to choose nuclei to image as discussed above (for the data in Figure 3 because both tags are photoactivated, only selection for nuclei near the surface was performed). The number of individual nuclei observed are quantified in the figure legends. For comparison of only two groups (+/− drug for instance) a non-paired T-test was performed using Prism Version 10.1.1. P-values are displayed in the figure. For comparisons for three or more samples a one-way ANOVA was performed using Prism Version 10.1.1 and p-values are indicated in the figure.
Supplementary Material
Data S1: Whole puff photoactivation representative movies.
Related to Figure 1.
A. Pol II-PA-GFP Decay. Movie of representative image shown in Figure 1D, first row.
B. PAF1-Halo FRAP. Movie of representative image shown in Figure 1D, first row.
C. Merge of Pol II-PA-GFP and PAF1-Halo. Movie of representative image shown in Figure 1D, first row.
D. DSIF-PA-GFP decay. Movie of representative image shown in Figure 1D, second row.
E. Pol II-Halo FRAP. Movie of representative image shown in Figure 1D, second row.
F. Merge of DSIF-PA-GFP and Pol II Halo. Movie of representative image shown in Figure 1D, second row.
G. P-TEFb-PA-GFP decay. Movie of representative image shown in Figure 1D, third row.
H. Merge of P-TEFb-PA-GFP and HSF-Halo. Movie of representative image shown in Figure 1D, third row.
I. PAF1-PA-GFP decay. Movie of representative image shown in Figure 1D, fourth row
J. Pol II-Halo FRAP. Movie of representative image shown in Figure 1D, fourth row
K. Merge of PAF1-PA-GFP and Pol II Halo. Movie of representative image shown in Figure 1D, fourth row.
L. Spt6-PA-GFP decay. Movie of representative image shown in Figure 1D, fifth row
M. PAF1-Halo FRAP. Movie of representative image shown in Figure 1D, fifth row
N. Merge of Spt6-PA-GFP and PAF1 Halo. Movie of representative image shown in Figure 1D, fifth row.
The first frame of each movie shows pre-photoactivation, the second frame shows immediately after photoactivation. The third frame is acquired 7 seconds post-photoactivation, all subsequent frames are taken every 10 seconds. PA-GFP is colored green, JFX650 HaloTag dye is colored magenta.
Data S2: Half-puff photoactivation Representative Movies.
Related to Figure 2.
A. Merge of Pol II-PA-GFP and PAF1-Halo. Movie of representative image shown in Figure 2C first row.
B. Pol II-PA-GFP decay. Movie of representative image shown in Figure 2C first row.
C. Merge of DSIF-PA-GFP and PAF1-Halo. Movie of representative image shown in Figure 2C second row.
D. DSIF-PA-GFP decay. Movie of representative image shown in Figure 2C second row.
E. Merge of P-TEFb-PA-GFP and HSF-Halo. Movie of representative image shown in Figure 2C third row.
F. P-TEFb-PA-GFP decay. Movie of representative image shown in Figure 2C third row.
G. Merge of PAF1-PA-GFP and Pol II-Halo. Movie of representative image shown in Figure 2C fourth row.
H. PAF1-PA-GFP decay. Movie of representative image shown in Figure 2C fourth row.
I. Merge of Spt6-PA-GFP and PAF1-Halo. Movie of representative image shown in Figure 2C fifth row.
J. Spt6-PA-GFP decay. Movie of representative image shown in Figure 2C fifth row.
The first frame of each movie shows pre-photoactivation, the second frame shows immediately after photoactivation. The third frame is acquired 3 seconds post-photoactivation, all subsequent frames are taken every 4 seconds. In the merge, PA-GFP is colored green and JFX650 HaloTag dye is colored magenta. In the PA-GFP only videos, PA-GFP is intensity scaled, white is high signal, blue is low signal.
Supplemental Table 2. Oligos Used
This excel file shows the names, sequences and describes the use of each oligo. Oligos are grouped together based on their use. Requests for the plasmid or plasmid sequences can be made to the corresponding author.
Highlights:
In early heat shock, Pol II and DSIF are not recycled for rounds of transcription
P-TEFb and PAF1 transiently associate with Pol II, Spt6 interacts stably
PAF1 and Spt6 are not recruited to Pol II without P-TEFb activity
PAF1 aids Pol II elongation particularly when nucleosomes are encountered
Acknowledgments
Thank you to members of the Lis Lab, past and present for helpful discussions. A special thank you to Janis Werner for help generating transgenic flies and testing them. We thank Luke Lavis at Janelia Research Campus for providing HaloTag JF dyes. Thanks to Mike Stadler and Colleen Hannon for providing plasmids and advice on genome editing. Thanks to Maren Bell for providing advice on fly genetics and assistance with fly stock maintenance. Imaging data was acquired through the Cornell Institute of Biotechnology’s BRC Imaging Facility (RRID:SCR_021741), with NYSTEM (C029155) and NIH (S10OD018516) funding for the shared Zeiss LSM880 confocal/multiphoton microscope. This work was supported by NIH grant RM1 GM139738 to John T. Lis, and this material is based upon work supported by the National Science Foundation Graduate Research Fellowship to P. Versluis under Grant No. 2139899.
Footnotes
Declaration of Interests
The authors declare no competing interests.
Publisher's Disclaimer: This is a PDF file of an unedited manuscript that has been accepted for publication. As a service to our customers we are providing this early version of the manuscript. The manuscript will undergo copyediting, typesetting, and review of the resulting proof before it is published in its final form. Please note that during the production process errors may be discovered which could affect the content, and all legal disclaimers that apply to the journal pertain.
References
- 1.Struhl K (1989). MOLECULAR MECHANISMS OF TRANSCRIPTIONAL REGULATION IN YEAST. Annu. Rev. Biochem. 58, 1051–1077. DOI: 10.1146/annurev.bi.58.070189.005155 [DOI] [PubMed] [Google Scholar]
- 2.Klemm SL, Shipony Z & Greenleaf WJ (2019). Chromatin accessibility and the regulatory epigenome. Nat. Rev. Genet. 20, 207–220. DOI: 10.1038/s41576-018-0089-8 [DOI] [PubMed] [Google Scholar]
- 3.Core L & Adelman K (2019). Promoter-proximal pause of RNA Polymerase II: a nexus of gene regulation. Genes Dev. 33, 1–24. DOI: 10.1101/gad.325142.119 [DOI] [PMC free article] [PubMed] [Google Scholar]
- •4.Adelman K & Lis JT (2012). Promoter-proximal pausing of RNA polymerase II: emerging roles in metazoans. Nat. Rev. Genet. 13, 720–31. DOI: 10.1038/nrg3293 [DOI] [PMC free article] [PubMed] [Google Scholar]
- 5.Chen FX, Smith ER & Shilatifard A (2018). Born to run: Control of transcription elongation by RNA polymerase II. Nature Reviews Molecular Cell Biology 19, 464–478. DOI: 10.1038/s41580-018-0010-5 [DOI] [PubMed] [Google Scholar]
- 6.Qiu Y & Gilmour DS (2017). Identification of regions in the Spt5 subunit of DRB sensitivity inducing factor (DSIF) that are involved in promoter-proximal pausing. J. Biol. Chem. 292, 5555–5570. DOI: 10.1074/jbc.M116.760751 [DOI] [PMC free article] [PubMed] [Google Scholar]
- 7.Vos SM, Farnung L, Urlaub H & Cramer P (2018). Structure of paused transcription complex Pol II-DSIF-NELF. Nature 560, 601–606. DOI: 10.1038/s41586-018-0442-2 [DOI] [PMC free article] [PubMed] [Google Scholar]
- 8.Yamaguchi Y, Takagi T, Wada T, Yano K, Furuya A, Sugimoto S, Hasegawa J, Handa H. (1999). NELF, a multisubunit complex containing RD, cooperates with DSIF to repress RNA polymerase II elongation. Cell 97, 41–51. DOI: 10.1016/s0092-8674(00)80713-8 [DOI] [PubMed] [Google Scholar]
- 9.Yamaguchi Y, Inukai N, Narita T, Wada T & Handa H (2002). Evidence that Negative Elongation Factor Represses Transcription Elongation through Binding to a DRB Sensitivity-Inducing Factor/RNA Polymerase II Complex and RNA. Mol. Cell. Biol. 22, 2918–2927. DOI: 10.1128/MCB.22.9.2918-2927.2002 [DOI] [PMC free article] [PubMed] [Google Scholar]
- •10.Matija Peterlin B & Price DH (2006). Controlling the Elongation Phase of Transcription with P-TEFb. Mol. Cell 23, 297–305. DOI: 10.1016/j.molcel.2006.06.014 [DOI] [PubMed] [Google Scholar]
- 11.Chao S-H & Price DH (2001). Flavopiridol Inactivates P-TEFb and Blocks Most RNA Polymerase II Transcription in Vivo*. J. Biol. Chem. 276, 31793–31799. DOI: 10.1074/jbc.M102306200 [DOI] [PubMed] [Google Scholar]
- 12.Vos SM, Farnung L, Boehning M, Wigge C, Linden A, Urlaub H, Cramer P (2018). Structure of activated transcription complex Pol II-DSIF-PAF-SPT6. Nature 560, 607–612. DOI: 10.1038/s41586-018-0440-4 [DOI] [PubMed] [Google Scholar]
- 13.Proudfoot NJ (2016).Transcriptional termination in mammals: Stopping the RNA polymerase II juggernaut. Science. 352, 6291. DOI: 10.1126/science.aad9926 [DOI] [PMC free article] [PubMed] [Google Scholar]
- 14.Osman S & Cramer P (2020). Structural Biology of RNA Polymerase II Transcription: 20 Years On. Annu Rev Cell Dev Biol. 36, 1–34. DOI: 10.1146/annurev-cellbio-042020 [DOI] [PubMed] [Google Scholar]
- 15.Yao J, Munson KM, Webb WW & Lis JT (2006). Dynamics of heat shock factor association with native gene loci in living cells. Nature 442, 1050–1053. DOI: 10.1038/nature05025 [DOI] [PubMed] [Google Scholar]
- 16.Yao J, Ardehali MB, Fecko CJ, Webb WW & Lis JT (2007). Intranuclear Distribution and Local Dynamics of RNA Polymerase II during Transcription Activation. Mol. Cell 28, 978–990. DOI: 10.1016/j.molcel.2007.10.017 [DOI] [PubMed] [Google Scholar]
- •17.Zobeck KL, Buckley MS, Zipfel WR & Lis JT (2010). Recruitment Timing and Dynamics of Transcription Factors at the Hsp70 Loci in Living Cells. Mol. Cell 40, 965–975. DOI: 10.1016/j.molcel.2010.11.022 [DOI] [PMC free article] [PubMed] [Google Scholar]
- 18.Stormo BM & Fox DT (2017). Polyteny: still a giant player in chromosome research. Chromosom. Res. 25, 201–214. DOI: 10.1007/s10577-017-9562-z [DOI] [PMC free article] [PubMed] [Google Scholar]
- •19.Zhimulev IF, Belyaeva ES, Semeshin VF, Koryakov DE, Demakov SA, Demakova OV, Pokholkova GV, Andreyeva EN. (2004). Polytene Chromosomes: 70 Years of Genetic Research. Int. Rev. Cytol. 241, 203–275. DOI: 10.1016/S0074-7696(04)41004-3 [DOI] [PubMed] [Google Scholar]
- 20.Eagen KP, Hartl TA & Kornberg RD (2015). Stable Chromosome Condensation Revealed by Chromosome Conformation Capture. Cell 163, 934–946. DOI: 10.1016/j.cell.2015.10.026 [DOI] [PMC free article] [PubMed] [Google Scholar]
- 21.Ni Z, Saunders A, Fuda NJ, Yao J, Suarez J, Webb WW, Lis JT (2008). P-TEFb is Critical for the Maturation of RNA Polymerase II into Productive Elongation In Vivo. Mol. Cell. Biol. 28, 1161–1170. DOI: 10.1128/MCB.01859-07 [DOI] [PMC free article] [PubMed] [Google Scholar]
- 22.Ardehali MB, Yao J, Adelman K Fuda NJ, Petesch SJ, Webb WW, Lis JT (2009). Spt6 enhances the elongation rate of RNA polymerase II in vivo. EMBO J. 28, 1067–1077. DOI: 10.1038/emboj.2009.56 [DOI] [PMC free article] [PubMed] [Google Scholar]
- 23.Adelman K, Marr MT, Werner J, Saunders A, Ni Z, Andrulis ED, Lis JT (2005). Efficient release from promoter-proximal stall sites requires transcript cleavage factor TFIIS. Mol. Cell 17, 103–112. DOI: 10.1016/j.molcel.2004.11.028 [DOI] [PubMed] [Google Scholar]
- 24.Tang X, Li T, Liu S, Wisniewski J, Zheng Q, Ron Y, Lavis LD, Wu C (2022). Kinetic principles underlying pioneer function of GAGA transcription factor in live cells. Nat. Struct. Mol. Biol. 29, 665–676. DOI: 10.1038/s41594-022-00800-z [DOI] [PMC free article] [PubMed] [Google Scholar]
- 25.Buckley MS, Kwak H, Zipfel WR & Lis JT (2014). Kinetics of promoter Pol II on Hsp70 reveal stable pausing and key insights into its regulation. Genes Dev. 28, 14–19. DOI: 10.1101/gad.231886.113 [DOI] [PMC free article] [PubMed] [Google Scholar]
- 26.Los GV, Encell LP, McDougall MG, Hartzell DD, Karassina N, Zimprich C, Wood MG, Learish R, Ohana RF, Urh M, et al. (2008). HaloTag: A Novel Protein Labeling Technology for Cell Imaging and Protein Analysis. ACS Chem. Biol. 3, 373–382. DOI: 10.1021/cb800025k [DOI] [PubMed] [Google Scholar]
- 27.Patterson GH & Lippincott-Schwartz J (2002). A photoactivatable GFP for selective photolabeling of proteins and cells. Science 297, 1873–1877. DOI: 10.1126/science.1074952 [DOI] [PubMed] [Google Scholar]
- 28.Ashburner M (1970). Patterns of puffing activity in the salivary gland chromosomes of Drosophila - V. Responses to environmental treatments. Chromosoma 31, 356–376. DOI: 10.1007/BF00321231 [DOI] [PubMed] [Google Scholar]
- 29.Hoskins RA, Carlson JW, Wan KH, Park S, Mendez I, Galle SE, Booth BW, Pfeiffer BD, George RA, Svirskas R, et al. (2015). The Release 6 reference sequence of the Drosophila melanogaster genome. Genome Res. 25, 445–458. DOI: 10.1101/gr.185579.114 [DOI] [PMC free article] [PubMed] [Google Scholar]
- •30.Cunningham F, Allen JE, Allen J, Alvarez-Jarreta J, Amode MR, Armean IM, Austine-Orimoloye O, Azov AG, Barnes I, Bennett R, et al. (2022). Ensembl. Nucleic Acids Res. 50, 988–995. DOI: 10.1093/nar/gkab1049 [DOI] [PMC free article] [PubMed] [Google Scholar]
- 31.Missra A & Gilmour DS (2010). Interactions between DSIF (DRB sensitivity inducing factor), NELF (negative elongation factor), and the Drosophila RNA polymerase II transcription elongation complex. PNAS. 107,11301–11306. DOI: 10.1073/pnas.1000681107 [DOI] [PMC free article] [PubMed] [Google Scholar]
- 32.Fant CB, Levandowski CB, Gupta K, Maas ZL, Moir J, Rubin JD, Sawyer A, Esbin MN, Rimel JK, Luyyties O, et al. (2020). TFIID Enables RNA Polymerase II Promoter-Proximal Pausing. Mol. Cell. 78, 785–793. DOI: 10.1016/j.molcel.2020.03.008 [DOI] [PMC free article] [PubMed] [Google Scholar]
- •33.Guertin MJ, Petesch SJ, Zobeck KL, Min IM & Lis JT (2010). Drosophila heat shock system as a general model to investigate transcriptional regulation. Cold Spring Harb. Symp. Quant. Biol. 75, 1–9. DOI: 10.1101/sqb.2010.75.039 [DOI] [PMC free article] [PubMed] [Google Scholar]
- •34.Petesch SJ & Lis JT (2008). Rapid, Transcription-Independent Loss of Nucleosomes over a Large Chromatin Domain at Hsp70 Loci. Cell 134, 74–84. DOI: 10.1016/j.cell.2008.05.029 [DOI] [PMC free article] [PubMed] [Google Scholar]
- •35.Lis JT (1998). Promoter-associated pausing in promoter architecture and postinitiation transcriptional regulation. Cold Spring Harb. Symp. Quant. Biol. 63, 347–356. DOI: 10.1101/sqb.1998.63.347 [DOI] [PubMed] [Google Scholar]
- 36.O’Brien T & Lis JT (1993). Rapid Changes in Drosophila Transcription after an Instantaneous Heat Shock. MOLECULAR AND CELLULAR BIOLOGY. 13, 3456–3463 DOI: 10.1128/mcb.13.6.3456-3463.1993 [DOI] [PMC free article] [PubMed] [Google Scholar]
- •37.Aoi Y, Takahashi YH, Shah AP, Iwanaszko M, Rendleman EJ, Khan NH, Cho BK, Goo YA, Ganesan S, Kelleher NL, Shilatifard A (2021). SPT5 stabilization of promoter-proximal RNA polymerase II. Mol. Cell 81, 4413–4424 DOI: 10.1016/j.molcel.2021.08.006. [DOI] [PMC free article] [PubMed] [Google Scholar]
- 38.Hu S, Peng L, Xu C, Wang Z, Song A, Chen FX (2021). SPT5 stabilizes RNA polymerase II, orchestrates transcription cycles, and maintains the enhancer landscape. Mol. Cell. 81, 4425–4439. DOI: 10.1016/j.molcel.2021.08.029 [DOI] [PubMed] [Google Scholar]
- 39.Adelman K, Wei W, Ardehali MB, Werner J, Zhu B, Reinberg D, Lis JT (2006). Drosophila Paf1 Modulates Chromatin Structure at Actively Transcribed Genes ‡. Mol. Cell. Biol. 26, 250–260. DOI: 10.1128/MCB.26.1.250-260.2006 [DOI] [PMC free article] [PubMed] [Google Scholar]
- 40.Aoi Y, Shah AP, Ganesan S, Soliman SHA Cho B, Goo YA, Kelleher NL, Shilatifard A (2022). SPT6 functions in transcriptional pause / release via PAF1C recruitment. Mol. Cell. 82, 3412–3423. DOI: 10.1016/j.molcel.2022.06.037 [DOI] [PMC free article] [PubMed] [Google Scholar]
- 41.Zumer K, Maier KC, Farnung L, Jaeger MG, Rus P, Winter G, Cramer P (2021). Two distinct mechanisms of RNA polymerase II elongation stimulation in vivo. Mol. Cell. 81, 3096–3109. DOI: 10.1016/j.molcel.2021.05.028 [DOI] [PubMed] [Google Scholar]
- 42.Subach FV, Patterson GH, Renz M, Lippincott-Schwartz J & Verkhusha VV (2010). Bright monomeric photoactivatable red fluorescent protein for two-color super-resolution sptPALM of live cells. J. Am. Chem. Soc. 132, 6481–6491. DOI: 10.1021/ja100906g [DOI] [PMC free article] [PubMed] [Google Scholar]
- 43.Chen FX Woodfin AR, Gardini A, Rickels RA, Marshall SA, Smith ER, Shiekhattar R, Shilatifard A (2015). PAF1, a Molecular Regulator of Promoter-Proximal Pausing by RNA Polymerase II. Cell 162, 1003–1015. DOI: 10.1016/j.cell.2015.07.042 [DOI] [PMC free article] [PubMed] [Google Scholar]
- 44.Hou L, Wang Y, Liu Y, Zhang N, Shamovsky I, Nudler E, Tian B, Dynlacht BD (2019). Paf1C regulates RNA polymerase II progression by modulating elongation rate. PNAS. 116, 14583–14592. DOI: 10.1073/pnas.1904324116 [DOI] [PMC free article] [PubMed] [Google Scholar]
- 45.Olson CM, Jiang B, Erb MA, Liang Y, Doctor ZM, Zhang Z, Zhang T, Kwiatkowski N, Boukhali M, Green JL, et al. (2017). Pharmacological perturbation of CDK9 using selective CDK9 inhibition or degradation. Nat. Chem. Biol. 14, 163–170. DOI: 10.1038/nCHeMBIO.2538. [DOI] [PMC free article] [PubMed] [Google Scholar]
- •46.Shaner NC, Lambert GG, Chammas A, Ni Y, Cranfill PJ, Baird MA, Sell BR, Allen JR, Day RN, Israelsson M, Davidson MW, Wang J (2013). A bright monomeric green fluorescent protein derived from Branchiostoma lanceolatum. Nat. Methods 10, 407–409. DOI: 10.1038/nmeth.2413. [DOI] [PMC free article] [PubMed] [Google Scholar]
- 47.Jonkers I, Kwak H & Lis JT (2014). Genome-wide dynamics of Pol II elongation and its interplay with promoter proximal pausing, chromatin, and exons. Elife 3, 2407. DOI: 10.7554/eLife.02407 [DOI] [PMC free article] [PubMed] [Google Scholar]
- 48.Tellier M, Zaborowska J, Caizzi L, Mohammad E, Velychko T, Schwalb B, Ferrer-Vicens I, Blears D, Nojima T, Cramer P, Murphy S (2020). CDK12 globally stimulates RNA polymerase II transcription elongation and carboxyl-terminal domain phosphorylation. Nucleic Acids Res. 48, 7712–7727. DOI: 10.1093/nar/gkaa514. [DOI] [PMC free article] [PubMed] [Google Scholar]
- 49.Duarte FM, Fuda NJ, Mahat DB, Core LJ, Guertin MJ, Lis JT (2016). Transcription factors GAF and HSF act at distinct regulatory steps to modulate stress-induced gene activation. Genes Dev. 30, 1731–46. DOI: 10.1101/gad.284430.116 [DOI] [PMC free article] [PubMed] [Google Scholar]
- 50.DeBerardine M, Booth GT, Versluis PP & Lis JT (2023). The NELF pausing checkpoint mediates the functional divergence of Cdk9. Nat. Commun. 14, 2762, 1–15. DOI: 10.1038/s41467-023-38359-y [DOI] [PMC free article] [PubMed] [Google Scholar]
- 51.Hu Y, Comjean A, Rodiger J, Liu Y, Gao Y, Chung V, Zirin J, Perrimon N, Mohr SE (2021). FlyRNAi.org-the database of the Drosophila RNAi screening center and transgenic RNAi project: 2021 update. Nucleic Acids Res. 49, 908–915. DOI: 10.1093/nar/gkaa936 [DOI] [PMC free article] [PubMed] [Google Scholar]
- 52.O’Brien T & Lis JT (1991). RNA polymerase II pauses at the 5’ end of the transcriptionally induced Drosophila hsp70 gene. Mol. Cell. Biol. 11, 5285–5290. DOI: 10.1128/mcb.11.10.5285-5290.1991 [DOI] [PMC free article] [PubMed] [Google Scholar]
- •53.Laybourn PJ & Dahmus ME (1990). Phosphorylation of RNA polymerase IIA occurs subsequent to interaction with the promoter and before the initiation of transcription. J. Biol. Chem. 265, 13165–13173. [PubMed] [Google Scholar]
- 54.Fuda NJ, Buckley MS, Wei W, Core LJ, Waters CT, Reinberg D, Lis JT (2012). Fcp1 Dephosphorylation of the RNA Polymerase II C-Terminal Domain Is Required for Efficient Transcription of Heat Shock Genes. Mol. Cell. Biol. 32, 3428–3437. DOI: 10.1128/MCB.00247-12 [DOI] [PMC free article] [PubMed] [Google Scholar]
- 55.Francette AM, Tripplehorn SA & Arndt KM (2021). The Paf1 Complex: A Keystone of Nuclear Regulation Operating at the Interface of Transcription and Chromatin. J. Mol. Biol. 433, 166979. DOI: 10.1016/j.jmb.2021.166979 [DOI] [PMC free article] [PubMed] [Google Scholar]
- 56.Chen Y, Kokic G, Dienemann C, Dybkov O, Urlaub H, Cramer P (2023). Structure of the transcribing RNA polymerase II–Elongin complex. Nat. Struct. Mol. Biol. 30, 1925–1935. DOI: 10.1038/s41594-023-01138-w [DOI] [PMC free article] [PubMed] [Google Scholar]
- 57.Danko CG, Hah N, Luo X, Martins AL, Core L, Lis JT, Siepel A, Kraus WL (2013). Signaling Pathways Differentially Affect RNA Polymerase II Initiation, Pausing, and Elongation Rate in Cells. Mol. Cell 50, 212–222. DOI: 10.1016/j.molcel.2013.02.015 [DOI] [PMC free article] [PubMed] [Google Scholar]
- •58.Jonkers I & Lis JT (2015). Getting up to speed with transcription elongation by RNA polymerase II. Nat. Rev. Mol. Cell Biol. 16, 167–177. DOI: 10.1038/nrm3953 [DOI] [PMC free article] [PubMed] [Google Scholar]
- 59.Vos SM, Farnung L, Linden A, Urlaub H & Cramer P (2020). Structure of complete Pol II-DSIF-PAF-SPT6 transcription complex reveals RTF1 allosteric activation. Nat Struct Mol Biol. 27, 668–677. DOI: 10.1038/s41594-020-0437-1 [DOI] [PubMed] [Google Scholar]
- •60.Cho NH, Cheveralls KC, Brunner AD, Kim K, Michaelis AC, Raghavan P, Kobayashi H, Savy L, Li JY, Canaj H, et al. (2022). OpenCell: Endogenous tagging for the cartography of human cellular organization. Science. 375, 6585 DOI: 10.1126/science.abi6983 [DOI] [PMC free article] [PubMed] [Google Scholar]
- 61.Gratz SJ, Ukken FP, Rubinstein CD, Thiede G, Donohue LK, Cummings AM, O’Connor-Giles KM (2014). Highly specific and efficient CRISPR/Cas9-catalyzed homology-directed repair in Drosophila. Genetics 196, 961–97. DOI: 10.1534/genetics.113.160713 [DOI] [PMC free article] [PubMed] [Google Scholar]
- •62.Gramates LS, Agapite J, Attrill H, Calvi BR, Crosby MA, DosSantos G, Goodman JL, Goutte-Gattat D, Jenkins VK, Kaufman T, et al. (2022). FlyBase: a guided tour of highlighted features. Genetics 220, (4). DOI: 10.1093/genetics/iyac035 [DOI] [PMC free article] [PubMed] [Google Scholar]
- •63.Yao J, Zobeck KL, Lis JT & Webb WW (2008). Imaging transcription dynamics at endogenous genes in living Drosophila tissues. Methods 45, 233–241. DOI: 10.1016/j.ymeth.2008.06.004 [DOI] [PMC free article] [PubMed] [Google Scholar]
- •64.Schindelin J, Arganda-Carreras I, Frise E, Kaynig V, Longair M, Pietzsch T, Preibisch S, Rueden C, Saalfeld S, Schmid B, et al. (2012). Fiji: an open-source platform for biological-image analysis. Nat. Methods. 9, 676–682 (2012). DOI: 10.1038/nmeth.2019 [DOI] [PMC free article] [PubMed] [Google Scholar]
- 65.Andrulis ED, Guzmán E, Döring P, Werner J & Lis JT (2000). High-resolution localization of Drosophila Spt5 and Spt6 at heat shock genes in vivo: Roles in promoter proximal pausing and transcription elongation. Genes Dev. 14, 2635–2649. DOI: 10.1101/gad.844200 [DOI] [PMC free article] [PubMed] [Google Scholar]
- •66.Zhang T, Kwiatkowski N, Olson CM, Dixon-Clarke SE, Abraham BJ, Greifenberg AK, Ficarro SB, Elkins JM, Liang Y, Hannett NM, et al. (2016). Covalent targeting of remote cysteine residues to develop CDK12 and CDK13 inhibitors. Nat. Chem. Biol. 12, 876–884. DOI: 10.1038/nchembio.2166 [DOI] [PMC free article] [PubMed] [Google Scholar]
Associated Data
This section collects any data citations, data availability statements, or supplementary materials included in this article.
Supplementary Materials
Data S1: Whole puff photoactivation representative movies.
Related to Figure 1.
A. Pol II-PA-GFP Decay. Movie of representative image shown in Figure 1D, first row.
B. PAF1-Halo FRAP. Movie of representative image shown in Figure 1D, first row.
C. Merge of Pol II-PA-GFP and PAF1-Halo. Movie of representative image shown in Figure 1D, first row.
D. DSIF-PA-GFP decay. Movie of representative image shown in Figure 1D, second row.
E. Pol II-Halo FRAP. Movie of representative image shown in Figure 1D, second row.
F. Merge of DSIF-PA-GFP and Pol II Halo. Movie of representative image shown in Figure 1D, second row.
G. P-TEFb-PA-GFP decay. Movie of representative image shown in Figure 1D, third row.
H. Merge of P-TEFb-PA-GFP and HSF-Halo. Movie of representative image shown in Figure 1D, third row.
I. PAF1-PA-GFP decay. Movie of representative image shown in Figure 1D, fourth row
J. Pol II-Halo FRAP. Movie of representative image shown in Figure 1D, fourth row
K. Merge of PAF1-PA-GFP and Pol II Halo. Movie of representative image shown in Figure 1D, fourth row.
L. Spt6-PA-GFP decay. Movie of representative image shown in Figure 1D, fifth row
M. PAF1-Halo FRAP. Movie of representative image shown in Figure 1D, fifth row
N. Merge of Spt6-PA-GFP and PAF1 Halo. Movie of representative image shown in Figure 1D, fifth row.
The first frame of each movie shows pre-photoactivation, the second frame shows immediately after photoactivation. The third frame is acquired 7 seconds post-photoactivation, all subsequent frames are taken every 10 seconds. PA-GFP is colored green, JFX650 HaloTag dye is colored magenta.
Data S2: Half-puff photoactivation Representative Movies.
Related to Figure 2.
A. Merge of Pol II-PA-GFP and PAF1-Halo. Movie of representative image shown in Figure 2C first row.
B. Pol II-PA-GFP decay. Movie of representative image shown in Figure 2C first row.
C. Merge of DSIF-PA-GFP and PAF1-Halo. Movie of representative image shown in Figure 2C second row.
D. DSIF-PA-GFP decay. Movie of representative image shown in Figure 2C second row.
E. Merge of P-TEFb-PA-GFP and HSF-Halo. Movie of representative image shown in Figure 2C third row.
F. P-TEFb-PA-GFP decay. Movie of representative image shown in Figure 2C third row.
G. Merge of PAF1-PA-GFP and Pol II-Halo. Movie of representative image shown in Figure 2C fourth row.
H. PAF1-PA-GFP decay. Movie of representative image shown in Figure 2C fourth row.
I. Merge of Spt6-PA-GFP and PAF1-Halo. Movie of representative image shown in Figure 2C fifth row.
J. Spt6-PA-GFP decay. Movie of representative image shown in Figure 2C fifth row.
The first frame of each movie shows pre-photoactivation, the second frame shows immediately after photoactivation. The third frame is acquired 3 seconds post-photoactivation, all subsequent frames are taken every 4 seconds. In the merge, PA-GFP is colored green and JFX650 HaloTag dye is colored magenta. In the PA-GFP only videos, PA-GFP is intensity scaled, white is high signal, blue is low signal.
Supplemental Table 2. Oligos Used
This excel file shows the names, sequences and describes the use of each oligo. Oligos are grouped together based on their use. Requests for the plasmid or plasmid sequences can be made to the corresponding author.
Data Availability Statement
Raw imaging data, excel workbooks documenting the analysis, Prism files documenting data fits, and western blot images have been deposited to Mendeley Data and are publicly available as of the date of publication. DOIs and links are listed in the key resources table and are available upon request and will be fulfilled by the lead contact, John Lis (jtl10@cornell.edu).
This paper does not report original code.
Any additional information required to reanalyze the data reported in this paper is available from the lead contact upon request.
Key Resource Table.
| REAGENT or RESOURCE | SOURCE | IDENTIFIER |
|---|---|---|
| Antibodies | ||
| Anti-GFP | Protein Tech | 50430-2-AP, RRID:AB_11042881 |
| Anti-Rabbit HRP | Thermo | 31460, RRID:AB_2532095 |
| Anti-Rpb1 Ser2 | Abcam | Ab5095 RRID:AB_304749 |
| Anti-Drosophila Rpb3 | Lab stock (Andrulis et al 2000) 65 | N/A |
| Goat Anti-Rabbit 800 | LiCor | 926-32211 |
| Bacterial and virus strains | ||
| DH5 Alpha Supercompetent Cells | NEB | C2987 |
| Biological samples | ||
| Chemicals, peptides, and recombinant proteins | ||
| Grace’s Insect Medium | Sigma | 45-G8142-500ML |
| Janelia Fluor 650x | Gift from Luke Lavis Janelia Research Farms | Available Now from Promega CS315104 |
| Janelia Fluor 549 | Gift from Luke Lavis Janelia Research Farms | Available Now from Promega GA1110 |
| BbsI Restriction Enzyme | NEB | R0539L |
| T4 DNA Ligase | NEB | M0202L |
| HiFi Assembly Master Mix | NEB | E2621L |
| RNase Cocktail | Thermo | AM2286 |
| Proteinase K | Thermo | AM2548 |
| Protease Inhibitor Cocktail | Thermo | A32963 |
| MNase | NEB | M0247S |
| Sybr Green | Thermo | S7567 |
| Phusion HF Buffer | NEB | B0518S |
| PVDF Membrane | Millipore | 0000167543 |
| Enhanced Chemiluminescence (ECL) | Bio-Rad | 170-5060 |
| CL-XPosure Film | Thermo | 34090 |
| NVP-2 | MedChemExpress | HY-122114A |
| THZ531 | Caymen Chemical | 26386-1 |
| Critical commercial assays | ||
| ENZA Endo-Free Plasmid Midi Kit | Omega | D6915-03 |
| ENZA Plasmid Mini Kit | Omega | D6942-02 |
| Deposited data | ||
| Imaging Data used for figures, Western Blots, and sequences for CRISPR HDR plasmids | This Paper | Mendeley Data: https://data.mendeley.com/preview/4rxj5g76z8?a=6e697080-4aff-4e3e-abeb-c8485503459c DOI: 10.17632/4rxj5g76z8.1 |
| Imaging Data Fig 1: Pol II and DSIF | This Paper |
https://data.mendeley.com/preview/4vhdtshgx7?a=6179b8da-ea08-4e9c-a298-f4f9ed32be73 DOI: 10.17632/4vhdtshgx7.1 |
| Imaging Data Fig 1: P-TEFb and PAF1 | This Paper |
https://data.mendeley.com/preview/sc442hnfj5?a=67646232-428c-4150-b4dc-64a0d36a9be3 DOI: 10.17632/sc442hnfj5.1 |
| Imaging Data Fig 1: Spt6, excel analysis and Prism Graph Pad Plots and fits | This Paper |
https://data.mendeley.com/preview/2xfxmb9zkh?a=c57fbc98-d5ad-4a81-a717-e6f2566579b0 DOI: 10.17632/2xfxmb9zkh.1 |
| Imaging Data Supplemental Figure 2 Raw Data | This Paper |
https://data.mendeley.com/preview/crw4c8nb3y?a=b1654f18-50e8-4dbc-9410-07b3a3b0ee84 DOI: 10.17632/crw4c8nb3y.1 |
| Imaging Data Supplemental Figure 3 Dataset | This Paper |
https://data.mendeley.com/preview/tbb6r7cfzc?a=7e030c1d-c7d9-47e5-94d9-3852093237fd DOI: 10.17632/tbb6r7cfzc.1 |
| Imaging Data Figure 2 and Supplemental Figure 4 Raw Data, excel analysis, Prism graphs and fits | This Paper |
https://data.mendeley.com/preview/gy58myshy9?a=ceea7834-75db-4d62-bd9b-74d236d7e7a7 DOI: 10.17632/gy58myshy9.1 |
| Imaging Data Figure 3 and Supplemental Figure 5 Raw Data, excel analysis and Prism plots and T-test | This Paper |
https://data.mendeley.com/preview/yvbcw7m3dp?a=2c97b57c-e002-4ec3-a13f-85b69d703cc1 DOI: 10.17632/yvbcw7m3dp.1 |
| Imaging Data Fig 4. Pol II, PAF1, Ctr9, Spt6 | This Paper |
https://data.mendeley.com/preview/9t8wddtwsn?a=5e9628f3-5b8d-4a73-a3aa-1ce1ca9b1eda DOI: 10.17632/9t8wddtwsn.1 |
| Imaging Data Figure 4 NELF-A and Supplemental Figure 6 Raw data, excel analysis and Prism plots and T-tests | This Paper |
https://data.mendeley.com/preview/45j7d538cj?a=d9fbb3c7-61c3-4647-ac0a-606070b112c9 DOI: 10.17632/45j7d538cj.1 |
| Imaging Data Figure 5 Cdc73 RNAi Pol II PA-GFP decay. | This Paper |
https://data.mendeley.com/preview/ypyy9k5bfj?a=86fe214f-a54c-411d-9171-be13dbe982ce DOI: 10.17632/ypyy9k5bfj.1 |
| Imaging Data Figure 5. Luciferase RNAi data Pol II photoactivation and decay | This Paper |
https://data.mendeley.com/preview/dy7kjr8jrt?a=44e6db3f-cdfc-4c56-a25c-def729fdeed7 DOI: 0.17632/dy7kjr8jrt.1 |
| Imaging Data Figure 5 MS2 Raw data both RNAi | This Paper |
https://data.mendeley.com/preview/wp82jngz8s?a=d093e582-03d9-445f-9960-0f7fbce4d149 DOI: 10.17632/wp82jngz8s.1 |
| Imaging Data. Supplemental Figure 7C Raw Data | This Paper |
https://data.mendeley.com/preview/jpwfvsv6x4?a=b508bfdb-3afe-4b7b-b57a-0e6af56eeb27 DOI: 10.17632/jpwfvsv6x4.1 |
| Supplemental Figure 7H Raw Data | This Paper |
https://data.mendeley.com/preview/8dkzfjkxr2?a=3db6bb5d-22dc-44cd-a719-17fbc2f78beb DOI: 10.17632/8dkzfjkxr2.1 |
| Experimental models: Cell lines | ||
| Experimental models: Organisms/strains | ||
| Fly: y1w1118 | Bloomington Stock Center | #6598 |
| Fly: PiggyBac Transposase | Bloomington Stock Center | #8285 |
| Fly: FM7A Balancer | Bloomington Stock Center | #785 |
| Fly: Tm3,Sb/Tm6b Tb Balancer | This Paper | N/A |
| Fly: Cyo/Xasta ; Tm6b,Tb/Xasta | Gift from Dan Barbash | N/A |
| Fly: Luciferase RNAi | Bloomington Stock Center | 31603 |
| Fly: Spt6 RNAi | Bloomington Stock Center | 32373 |
| Fly: Cdc73/Hyx RNAi | Bloomington Stock Center | 31722 |
| Fly: Rpb9-Halo | This Paper | N/A |
| Fly: Rpb9-PA-GFP | This Paper | N/A |
| Fly: Rpb9-PA-TagRFP | This Paper | N/A |
| Fly: Halo-NELF-A | This Paper | N/A |
| Fly: Spt5-PA-GFP | This Paper | N/A |
| Fly: Cyclin-T-PA-GFP | This Paper | N/A |
| Fly: PAF1-Halo | This Paper | N/A |
| Fly: PAF1-PA-GFP | This Paper | N/A |
| Fly: Ctr9-Halo | This Paper | N/A |
| Fly: Ctr9-PA-GFP | This Paper | N/A |
| Fly: Spt6-PA-GFP | This Paper | N/A |
| Fly: HSF-mNeonGreen | This Paper | N/A |
| Fly: HSF-Halo | This Paper | N/A |
| Fly: Gal4 | Bloomington Stock Center | 6979 |
| Fly: Gal4 | Bloomington Stock Center | 6983 |
| Fly: Hsp70Transgene, LacI-mCherry ; hsp83-MCP-GFP | Buckley et al. 2014 25 | N/A |
| Oligonucleotides | ||
| See Table S2 | This Paper | N/A |
| Recombinant DNA | ||
| pCFD3-dU6 3gRNA | DGRC | RRID:DGRC_1435 1435 |
| pHD-Scarless-dsRed | DGRC | RRID:DGRC_1364 1364 |
| EasyFusion Halo | Addgene | 112850 |
| pTW-Rpb9-paG | Buckley et al. 2014 25 | N//A |
| pTG603 HSF-mNeonGreen homology donor | This Paper | N/A |
| pTG607 HSF-Halo HDR template | This Paper | N/A |
| pTG610 HSF-sgRNA | This Paper | N/A |
| Rpb9-Halo Homology Donor | This Paper | N/A |
| Rpb9-PA-GFP Homology Donor | This Paper | N/A |
| Rpb9-PA-TagRFP Homology Donor | This Paper | N/A |
| Rpb9 sgRNA | This Paper | N/A |
| Halo-NELF-A Homology Donor | This Paper | N/A |
| NELF-A sgRNA | This Paper | N/A |
| Spt5-PA-GFP Homology Donor | This Paper | N/A |
| Spt5 sgRNA | This Paper | N/A |
| Cyclin-T-PA-GFP Homology Donor | This Paper | N/A |
| Cyclin-T sgRNA | This Paper | N/A |
| PAF1-Halo Homology Donor | This Paper | N/A |
| PAF1-PA-GFP Homology Donor | This Paper | N/A |
| PAF1 sgRNA | This Paper | N/A |
| Ctr9-Halo Homology Donor | This Paper | N/A |
| Ctr9-PA-GFP Homology Donor | This Paper | N/A |
| Ctr9 sgRNA | This Paper | N/A |
| Spt6-PA-GFP Homology Donor | This Paper | N/A |
| Software and algorithms | ||
| FIJI Version 2.14.0 | Schindelin et al. 2012 | https://imagej.net/software/fiji/ |
| PRISM Version 10.1.1 | https://www.graphpad.com/features | N/A |
| Microsoft Excel 16.16.27 | https://www.microsoft.com/en-us/microsoft-365/p/excel-home-and-student/CFQ7TTC0HLKR?activetab=pivot:overviewtab | N/A |
| flyCRISPR Target Finder | Gratz, S.J.*, Ukken, F.P.*, et al. (2014) | http://targetfinder.flycrispr.neuro.brown.edu/ |
| Other | ||
| 35 mm PolyD-Lysine Coated No 1.5 Imaging Dishes | MatTek | P35GC-1.5-14-C |