Abstract
Graphene oxide flakes are considered as potential inhibitors for different pathogenic bacteria. However, the efficacy of inhibition changes for different types and strains of bacteria. In this work, we examine Pseudomonas aeruginosa and Staphylococcus aureus, two common hospital-acquired infections, which react quite differently to graphene oxide flakes. The minimum inhibitory tests yield two distinct outcomes: stopped proliferation for S. aureus versus almost no effect for P. aeruginosa. Integrating our experimental evidence with molecular dynamics simulations, we elucidate the molecular machinery involved, explaining the behavior we see in scanning electron microscopy images. According to our simulations, the peptidoglycan network, the outermost layer of S. aureus, is completely entangled with the flakes, acting as a hunting ground, which consequently results in the inhibition of the pathogen itself. Lipopolysaccharides, the outermost layer of P. aeruginosa, on the other hand, resist interacting with the flakes. Lipopolysaccharides make no effective contacts, and thus no effective inhibition of the pathogen takes place. Likewise, the electron microscopy images show complete coverage and wrapping of S. aureus. In contrast, for P. aeruginosa, barely any bacteria are spotted with any flakes on top except for some loosely half-covered cases. As we did not observe any damaged bacteria in our images, we exclude the knife-cutting inhibition mechanism and suggest the wrapping and trapping mechanism for S. aureus for our flakes' rather large size (average area of 0.05 μm2). The molecular machinery suggested in this work can be used for molecular engineering and functionalizing graphene flakes to inhibit different pathogens.
Keywords: wrapping graphene oxide, antibacterial nanomaterial, adhesion to the membrane, molecular dynamic approach
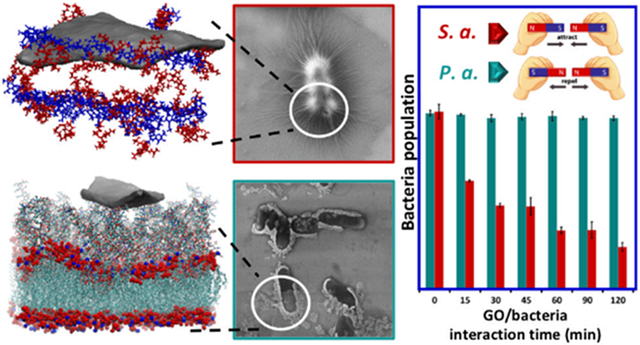
Graphical Abstract
1. INTRODUCTION
To address the threat posed by bacteria, organisms that evolved to survive in some of the most intense conditions found on Earth, we need to be creative, at least to the same extent as their pathogenic species undergo mutations and develop antibiotic resistance. Novel antibiotics and quaternary ammonium compounds,1 metal ions/oxides2, and antimicrobial peptides 3 are among different approaches used to combat this problem and yet each comes with its own set of side issues such as drug resistance, cytotoxicity, and high fabrication cost, respectively.
Ever since its discovery as a stand-alone sheet in 2004, graphene and its derivatives have been the most popular 2D, one-atom-thick materials. Very high mechanical stiffness and superb electronic transport properties paved the way for a broad range of applications from energy related technologies to electronics and biodevices. The integration of graphene with biomolecules goes back to 2008 when Liu et al. used the water solubility of graphene oxide (GO) to deliver insoluble cancer drugs.4 The effort continues to result in state-of-theart technologies with the representative work of Hajian et al. in 2019 where they choose graphene as the only optical material capable of following the rapid activity of a gene editing CRISPR/Cas9 protein.5 In 2010, the first antibacterial application of graphene derivatives was reported.6 Luckily it emerged as a compromise between cytotoxicity and antiseptic properties. Not only was it harmless to mammalian cells, but it was toxic enough to inhibit the growth of pathogenic bacteria such as Escherichia coli.4,6 Later, graphene and its derivatives with and without functionalization and hybrid components like Ag and Au were tested for bactericidal effects. Considering the high rate of hospital-acquired infections (the sixth leading cause of death in hospitals),7 G/GO antibacterial agents seem to be promising candidates to stop the proliferation of bacteria in such environments.8-15
Many different mechanisms of disruption have been proposed, some mechanical and some chemical. Tu et al.16 demonstrated how graphene dilutes the bacterial cell envelope by extracting phospholipids out of the membrane. Oxidative stresses 17 and electron transfer 18 are the two other chemical mechanisms proposed, mostly when another metallic component is incorporated with G/GO. For example, hydrophilic porous polyacrylonitrile/reduced graphene oxide-gpoly(amidoxime)-loaded Ag nanoparticles have been synthesised as a composite nanofiber membrane by combining electrospinning and hydrolysis methods. In this system, the light-induced hot electrons rapidly transfer from Ag to the conduction band of the composite and participate in the reactions to form a number of active radicals leading to a high photo-antibacterial performance against E. coli 8. Cheng et al. 9 loaded ceria nanoparticles on graphene nanocomposites and observed an enhanced antibacterial properties against E. coli and S. aureus due to numerous reactive oxygen species which originated from the excellent photo-induced electrons and holes separation ability in that composite. Similar results were obtained by Jang et al. 13 to remove several bacterial species and biofilms by bimetallic Ag/Cu nanoparticles decorated on GO flakes because of two metal ions’ release over time. Moreover, Akhavan et al.19 suggested that the sharp edges of the sheets are responsible for cell rupture whereas in a similar work the inhibition of bacterial growth was attributed to bacteria being wrapped and trapped by G/GO.20 To gain further insight into the details of the mechanism we need to zoom in and study the interaction of G/GO with biomolecules in general: amino acids and peptides, nucleic acids, sugars, and lipids. Whether we are studying the G/GO as a biosensor scaffold to detect a sequence on DNA, or as a nanocargo to deliver drugs or even an antibacterial agent to suppress pathogenic bacteria, a molecular level knowledge of the structure, dynamics, and interplay between the chemical components of the biomolecules with graphene is of great importance.
In this work, we studied the antibacterial effects of GO flakes with submicron average size on two main pathogenic hospital-acquired infections: the gram-positive Staphylococcus aureus (S. aureus) and the gram-negative Pseudomonas aeruginosa (P. aeruginosa). Starting with minimum inhibitory concentration (MIC) tests, the outcome was rather different for the two bacteria. This observation naturally directed the rest of the work towards finding the origins of the difference. Field-emission scanning electron microscopy (FESEM) images of unharmed bacteria maintaining their structural integrity made us speculate that a drastic difference in chemical affinity is responsible for GO flakes to attract and cover one bacterium while ignoring or even repelling the other. We used classical molecular dynamics (MD) simulations to further investigate the affinity. In agreement with our experimental results, MD simulations showed the same behavior and revealed the molecular origin for different affinities of the two bacteria towards GO flakes. According to our results, the affinity is highly dependent on the chemical composition of the outermost exposed layer of the bacterium cell, which limits our ability to generalize our conclusions to all gram-negative or all gram-positive species. Even different strains of similar bacteria have a distinct chemical composition at their outermost layer, which can in principle change the response of the bacteria towards GO flakes.
2. EXPERIMENTAL AND THEORETICAL METHODS
2.1. Materials
Graphite flakes, natural, −10 mesh, 99.9% (Alfa Aesar 43319) were used as the main material. Other chemicals used in the process of synthesis of graphene oxide are K2S2O8 (Merck 105091), P2O5 (Merck 100570), H2SO4 98% (Merck 112080), KMnO4 (Scharlau PO03301000), H2O2 (Merck 108597), HCl (Ghatran Shimi Co.). In the microbial section S. aureus (ATCC® 25923™) P. aeruginosa (ATCC® 27553™) and Mueller Hinton (both broth and agar) were used.
2.2. GO synthesis method
Graphene oxide flakes were prepared using the modified Hummers’ method as also applied in other reports21 with further modifications to increase the quality of the resultant GO flakes. Briefly, 2 g of K2S2O8, 2 g of P2O5, and 12 mL of 98% H2SO4 were mixed and heated to 80 °C in a water bath. 1 g of graphite flakes was added to the mixture, kept at 80 °C for 270 minutes and next, the mixture was sonicated for 15 minutes for better exfoliation. After this sonication step as the pretreatment step, the mixture was diluted using distilled water, filtered through a 0.22 μm nylon membrane using a vacuum filtration system and washed thoroughly with deionized water. The result was left to dry at room temperature and the main oxidation step followed after. The as-treated dry graphite flakes were added into 92 mL of H2SO4 in an ice bath. 5 g of KMnO4 was added slowly while stirring. The mixture was heated to 35 °C under vigorous stirring keeping for 4 hours. Next, 184 mL of DI water was slowly added; 15 min later, 560 mL of water and 10 mL of H2O2 were added. The final resulting material was centrifuged for 30 minutes at 10000 rpm, and then the solid product was collected and washed with 1:10 HCl in water. Lastly, graphite oxide was suspended in deionized water and run through a series of centrifugation steps in order to eliminate impurities and increase the pH of the suspension. The product GO contains a wide range of flake sizes (up to hundreds of micrometers in diameter). To control the size of the prepared GO flakes, the product was centrifuged for 30 minutes at 8000 rpm. Then, the supernatant part was sonicated to break down the flakes for 6 hours with the bath power of 200W.
2.3. Characterization methods and instruments
For ensuring the successful oxidation of graphite and synthesis of GO sheets, various characterization techniques including Fourier-transform infrared (FTIR), Raman, and UV-visible spectroscopy were applied, X-ray diffraction (XRD) patterns of the samples were also studied. To study the quality of produced flakes, spectroscopy techniques were applied to micro scales of the samples. For this purpose, a proper amount of GO suspension was dropped on the sample holder and dried in a vacuum. Then, using an optical microscope, the micro-FTIR measurements were carried out on a suitable place of each sample containing GO sheets, using Nicolet Nexus equipment coupled with a Thermo-Nicolet Continuum infrared microscope and a cooled MCT detector (77 K). The spectra were acquired by using the diamond anvil cell technique with a 15X infrared objective (64 scans, 1 cm−1 resolution). Compared with the KBr pellet technique, the micro-FTIR setup allows recording spectra with a minimal sample amount and from specific flake on the surface.
The micro-Raman spectra presented here have been recorded with a Jobin-Yvon Labram HR800UV spectrometer equipped with 632.8 nm He-Ne laser while the irradiation power at the sample was always of the order of a few mW to prevent laser-induced effects. Care has been adopted to verify the reproducibility of the spectra. GO flakes in the sample were analyzed in a back-scattering geometry by using the microscope with the 50X objective.
To investigate the crystalline structure of the flakes, X-ray diffraction was applied using a PANalytical (X’Pert PRO MPD) system while the XRD pattern was recorded for a small amount of GO suspension dropped and dried on the sample holder. Moreover, the optical properties were studied by a JASCO-V530 instrument using a GO suspension in a quartz cell and applying a double beam approach.
In order to analyze flake size distribution, atomic force microscopy (AFM) was utilized to prepare numerous images from GO flakes. For this purpose, 3 μL of GO suspension with the concentration of ~ 40 μg/mL was dropped on freshly cut mica (1 × 1 cm2) and dried at room temperature. A VEECO SPM device equipped with silicon tip with radius 20 nm in non-contact mode was used. Several images of the sample were provided to measure the area of a large number of flakes and generate a size distribution graph for each. Because the shape and geometry of flakes were not well-defined, the mean area of flakes has been considered to represent the size of flakes instead of their diameter and the standard deviation of flake size represents the variety of flake size.
FESEM was applied to study the interaction of bacteria and graphene oxide using MIRAIII, TESCAN-XMU system. For this technique, samples were made on highly doped p-type Si substrate (with good conductivity to avoid any coating prior to microscopy) by dropping 3 μL of properly diluted suspension made from the mixture of bacteria and GO samples (used in antibacterial tests as will be explained later).
In the synthesis steps, a Sigma 2-16P centrifuge device with rotor model 12181 and ultrasonic bath (Wisd, WUC-D10H) with adjustable power and frequency of 40 kHz was used.
2.4. Antibacterial susceptibility testing
In order to examine the antibacterial effect of GO against gram-positive and gram-negative targets, the minimum inhibitory concentration (MIC) was measured. In the MIC method, solutions of culture medium (Muller Hinton broth) containing different concentrations of GO samples were prepared. Bacteria were added to each sample tube from a source of freshly made 0.5 McFarland solution, reaching the final bacterial concentration of ~ 106 CFU/mL. All the samples were incubated overnight at a temperature of 37 °C. The tube with the lowest concentration of graphene oxide that has not become opaque is considered to have the minimum inhibitory concentration for GO.
The minimum bactericidal concentration (MBC) test was done following MIC to show whether bacteria have been killed or their growth has been inhibited. From all clear tubes in which bacteria growth was prohibited 10 μl of samples were taken out and added to plates containing growth medium. These plates were incubated overnight and checked for any growth of bacteria colonies. The minimum concentration of bactericidal material that leads to resultant growth of less than 0.1 % of initial inoculated bacterial concentration was considered as the MBC value. So, the MBC value can be equal to or more than the MIC value.
As a more quantitative examination of the antibacterial effect of GO, which can be more informative in comparing its influence on different bacteria, a similar process to MIC was carried out to measure the population of S. aureus and P. aeruginosa versus time. Here, for a given concentration of GO suspended in saline water, about 106 CFU/mL of bacteria was added and incubated. But, instead of only checking the transparency of tubes after overnight incubation, colony counting was carried out at the starting point, and after 15, 30, 45, 60, 90, and 120 minutes. For this purpose, a process similar to MBC was done where a suitable amount of each tube was diluted and spread fully on culture medium plates and incubated to the point (for example 21 hours in this work) where single colonies can be observed and counted. All experiments were repeated three times to ensure repeatability and reproducibility.
2.5. Theoretical methods
Lipopolysaccharides on top of the membrane are built according to CHARMM-GUI protocol with a laboratory-adapted (LA) lipid A22 and one O-antigen on top of the outer core. The membrane’s inner leaflet is made of phosphatidylethanolamine (POPE) and phosphatidylglycerol (POPG) phospholipids with a 3:1 ratio, while the outer leaflet is composed of 30 lipopolysaccharides (LPS) molecules. Necessary ions are added accordingly (Mg2+, Cl−, K+). The peptidoglycan mesh was taken from Gumbart et al.23 The CHARMM24 force field was used for all components of the cell wall. The graphene sheet was initially placed 4 nm above the cell wall for both systems. The graphene sheet size was chosen to fit inside the periodic box made for the cell wall. The shape of the flake is a rhomboid with diagonals 11 nm x 6 nm. Graphene force field parameters are the same as in the literature.25 Carbon atoms are modelled as uncharged Lennard-Jones particles with σCC = 3.58 Å and εCC = 0.0663 kcal/mol. Both systems are solvated in water. All simulations were performed with NAMD 2.11.26 For each system we performed 30 ns of production run in the NVE ensemble with the controlled temperature of 310 K. All visualization and analysis was carried out with VMD.27
3. RESULTS AND DISCUSSION
3.1. Characterization of the GO flakes
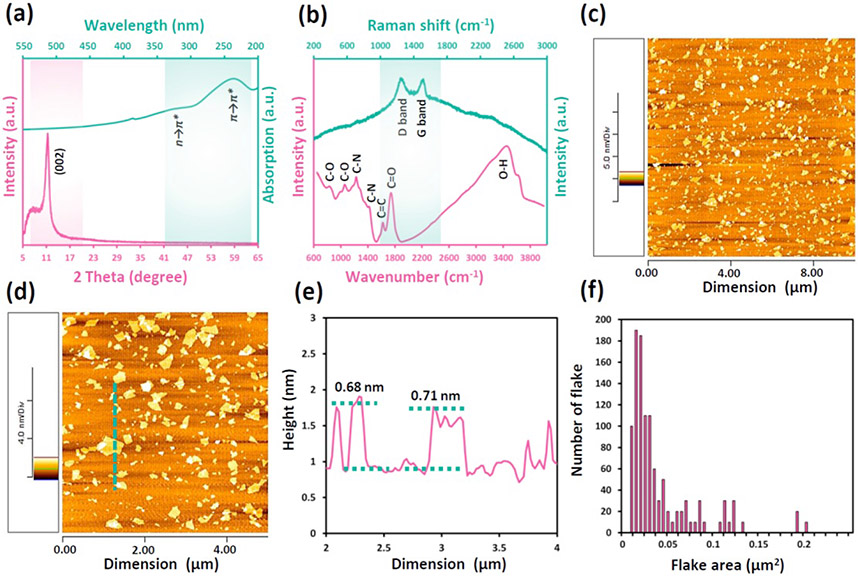
Various characterization techniques were utilized to verify the successful synthesis of graphene oxide in terms of its purity, types of functional groups, and flake size. Based on the XRD pattern of the sample (Figure 1a), the peak at 2θ = 11.244° is the fingerprint of GO flakes with corresponding d-spacing of 7.86267 Å while no other peak related to possible impurities was detected.28,29 Because the synthesis procedure of this sample was terminated at the sonication step (uncontrolled mincing of large flakes) instead of centrifuging (size classification), the small shoulder at 2θ ≈ 8° was detected related to the width distribution in the GO suspension.30 Moreover, Figure 1a presents the UV-Vis spectrum of the prepared GO suspension, which revealed the expected characteristic absorption peak of GO at the wavelength of 232 nm. This peak is ascribed to the π → π* transition of aromatic C─C bonds while a small shoulder at 300 nm is associated with the n → π* transition of C═O bonds.31,32
Figure 1.
(a) X-ray and optical absorption spectra, (b) micro-Raman and micro-FTIR spectra and (c,d) AFM images of the prepared GO sample. (e) Height profile of the GO flakes across the illustrated dashed line in (d). (f) Size distribution graph of the GO flakes in the provided suspension based on numerous analyzed AFM images. Small noise in (a) for optical spectra at 350 nm was related to switching the light source in the spectrometer and not to GO.
Micro-FTIR spectra of the sample (Figure 1b) indicated the presence of abundant oxygen contacting functional groups as well as no impurity in the flakes. Absorption peaks at 870, 1052, 1225, and 1738 cm−1 were assigned to epoxy groups, alkoxy stretching C-O, epoxy stretching C-O and carboxyl/carbonyl stretching C=O, respectively. 11,12 The peak at 1620 cm−1 was related to stretching C=C bonds as the carbon part while one at 3465 cm−1 was attributed to O-H bonds in absorbed water and/or carboxylic acid structures.33,34 The micro-Raman spectra of the prepared GO in Figure 1b contains the two peaks at 1600 and 1330 cm−1, which confirmed the formation of graphene oxide. These bands are characteristic features of sp2 carbon materials and have been called G and D bands, respectively.15,35 The D band appears in graphitic systems when some kind of disorder or discontinuity of the lattice occurs.36 It comes from transversal optical phonons around the Brillouin zone corner and the D label comes from "disorder".36 The D peak is assigned to a specific vibrational mode that can be defined as cooperative breathing of alternated hexagonal rings in the molecule.36 Graphite’s G band (from "graphite") refers to the degenerate optical phonon of the E2g symmetry of the graphene lattice.35,36
Statistical analysis of provided AFM images was performed to measure the flake size of GO sheets as well as their thickness. Figure 1c,d show typical top view images of the GO samples along with the corresponding height profile to evaluate flake thickness in Figure 1e and the obtained respective size distribution graphs in Figure 1f. The calculated mean area was 0.05 μm2 with a standard deviation of 0.21 μm2. According to height profiles, GO flakes revealed thicknesses in the 0.7-1.0 nm range, which showed the formation of the sheets mainly in single layer form.37,38 These values are definitely higher than that reported for single-layer graphene, due to the existence of oxygen-containing groups on the surface.
3.2. Antibacterial performance of GO flakes
3.2.1. Bacteriostatic performance against two bacteria
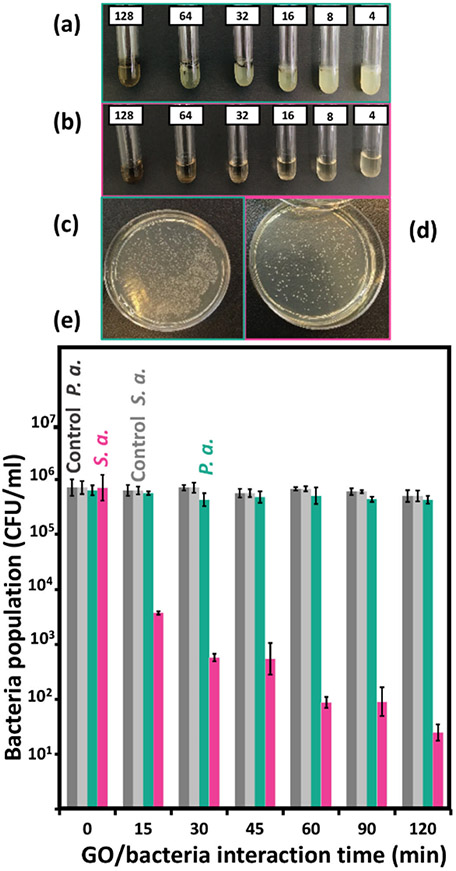
As the first test to evaluate the antibacterial performance of GO flakes against two types of bacteria, MIC experiments were done to explore the toxicity of each sample against standard strains of S. aureus and P. aeruginosa in the GO concentration range of 4-128 μg/ml. The results, which were determined visually based on images in Figure 2a,b for P. aeruginosa and S. aureus, respectively, and the method described before, revealed no inhibiting concentration of GO sheets against gram-negative bacteria. However, the MIC of 8 μg/ml, which led to a transparent tube, was obtained for the gram-positive pathogen. On the other hand, for the latter case, no MBC value was obtained, implying the antibacterial properties observed for GO against S. aureus was a bacteriostatic effect mainly due to isolating and wrapping the bacteria.
Figure 2.
Photo of MIC test tubes and resulting plates in colony count test after 2 hours for (a,c) P. aeruginosa and (b,d) S. aureus treated with GO flakes. (e) Obtained colony count results as compared with correspondence control tests for each type bacteria up to two hours.
To have a more detailed view of the kinetics of the GO antibacterial performance during interaction with bacteria, colony counting was done for both species of bacteria during two hours of interaction in a saline solution. For a better comparison, control tests were also carried out for both cases in which all conditions were the same except GO flakes were not added. As presented in Figure 2c-e, the result was consistent with MIC tests. When no GO was added to the bacterial suspension, almost no change in the bacteria’s rate of cell division was observed. To obtain better visualization of the test results, a logarithmic scale was used for the bacteria count axis. However, in the case of S. aureus bacteria treated with GO, a rapid drop in the population was seen initially, and continued interaction of bacteria with GO flakes led to a 76% decrease in the population after two hours. On the other hand, for P. aeruginosa this inhibitory effect was just 3%, statistically insignificant given the error bars. A similar result was also reported by Cai et al.39 in which higher antibacterial activity against gram-positive S. aureus than against gram-negative E. coli was observed.
3.2.2. Bacteria/GO interaction
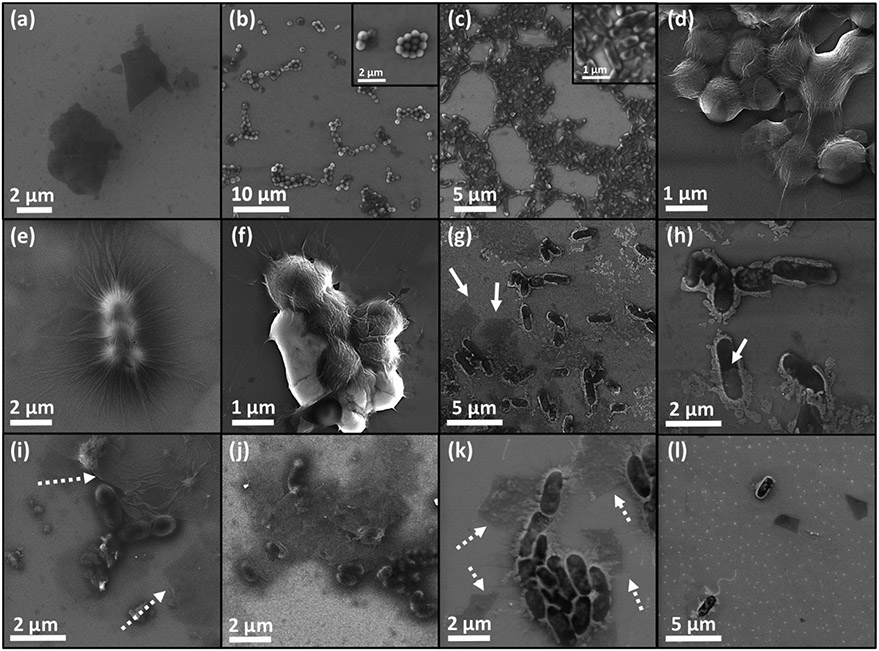
In order to explore the experimental aspects of bacteria/GO affinity and the physical form of their interaction, FESEM imaging was used. Samples were made from the sediment part of the MIC tubes, where it can be visually concluded that both GO flakes and bacteria are present alongside each other. MIC results along with negative results in MBC tests implied wrapping and isolating the bacteria as the possible mechanism responsible for the bacteriostatic effect of GO flakes. Accordingly, an electron gun was applied in low energy mode to detect the interaction of thin GO sheets (mono or few layers) with the surface of both bacteria. To distinguish between graphene oxide, S. aureus and P. aeruginosa images from the samples containing GO with no bacteria as well as ones containing each bacteria alone were also provided and presented in Figure 3a-c, respectively. Accordingly, the spherical shape of the gram-positive target with ~500 nm diameter and the bar-like gram-negative one with ~500 nm width and ~1μm length were observable.
Figure 3.
FESEM images of (a) GO flakes, (b) S. aureus, (c) P. aeruginosa, (d-f) large and small colonies of S. aureus wrapped by GO sheets and (g-l) unsuccessful interaction of GO with P. aeruginosa presenting no contact with bacteria.
Figure 3d-f presents overlapped and connected GO flakes with small wrinkles on the surface as the fingerprint of dried single/few GO layers, which almost fully covered small and large colonies of S. aureus to completely isolate them from the growth environment. This behavior, which finally has resulted in the observed minimum inhibitory concentration for GO against these bacteria, revealed the tendency of GO flakes to attach to the surface of S. aureus before growth. On the other hand, based on Figure 3g-l, these GO sheets could not connect to P. aeruginosa bacteria, and hence, no inhibition was detected. As white arrows show GO flakes, they dispersed and dried separately from the gram-negative bacteria without evidence of covering bacteria colonies and bacteriostatic performance. P. aeruginosa was rarely spotted covered by a flake and only occasionally loosely in contact (half covered or in the vicinity of one another based on Figure 3g,h). This distinct difference gives us the impression that there is a higher chemical affinity for GO towards S. aureus bacteria. Accordingly, it was implied that for the gram-positive S. aureus target, the mechanism causing inactivation of bacteria growth was wrapping. Bacteria-colony-making units are isolated from the environment early in their growth when covered with GO sheets. This prevents the bacterial colonies from entering the exponential stage of their growth. However, the wrapping process depended strongly on the type of bacteria and structure of its membrane that determine if this attachment is preferred or not.
3.2.3. MD simulation
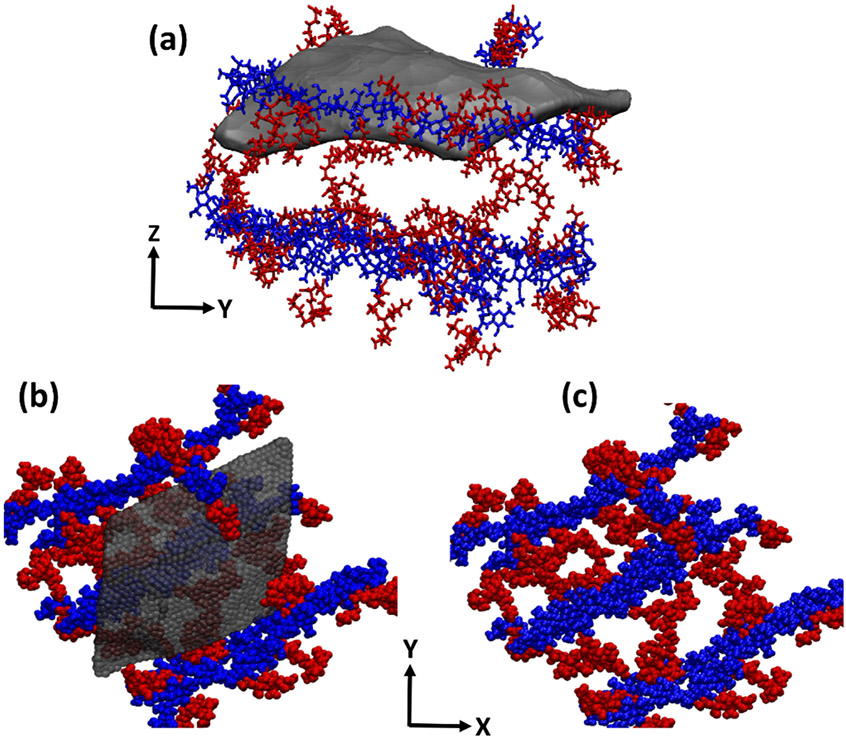
The bacterial cell wall composition is complex and modeling the whole structure with all components included is not feasible. We need to make certain assumptions to make this possible while not losing the essence of cell wall functionality. Starting with gram-positive S. aureus bacteria, the outermost layer is the peptidoglycan (PGN) network, which includes proteins and teichoic acids inside. Studies have shown that more than 70% of the cell wall weight in S. aureus bacteria is PGN, and removing proteins and teichoic acids hardly reduces the thickness of the wall.40 The structure of the PGN itself has been a matter of dispute for years.41-44 In this work, we used the model from Beeby et al.23 in which the network is composed of glycan strands with perpendicular peptide branches (blue strands and red residues in Figure 4c, respectively). For the gram-negative P. aeruginosa, the outermost layer is composed of LPS molecules, comprising one leaflet of the the outer membrane. Different gram-negative bacteria and even different strains of the same bacteria have diverse LPS chemical compositions. We used the composition suggested by CHARMM-GUI45 for the LA strain of P. aeruginosa.22 The full description of the structure of both systems is given in the theoretical methods section.
Figure 4.
Graphene flake wrapping the PGN network (a) side view of the flake entangled in PGN, (b) top view of the flake on PGN network, (c) PGN network composed of sugar strands (blue) with peptide branches (red).
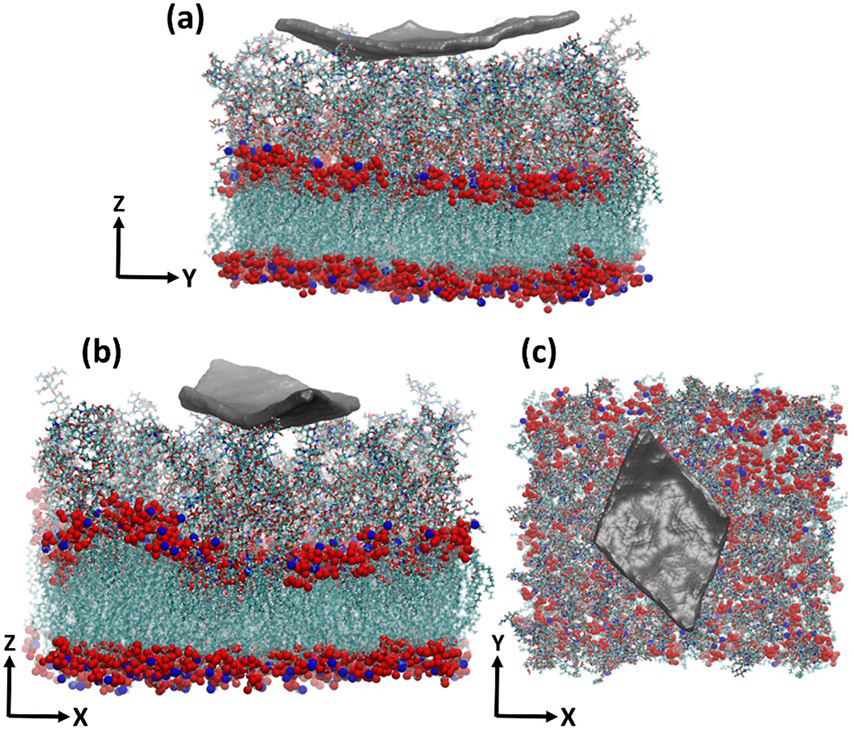
In the course of the simulation, we observed a meaningful difference in the behavior of graphene in the vicinity of PGN versus that of LPS (movie 1 and movie 2). While the graphene flake lays smoothly on the PGN layer, allowing the peptide branches to wrap around it, the LPS layer has less apparent affinity for the flake. For PGN, the edges of the flake enter its porous structure, and we see peptide branches climbing on the flake, maximizing the contacts between them (Figure 4a,b). For LPS however, the flake edges are pointing upward, apparently trying to minimize their contacts with LPS molecules (Figure 5a,b).
Figure 5.
Graphene flake interacting with the LPS molecules (a,b) side view of the flake interacting with the LPS layer, which covers the membrane surface, (c) top view of the flake on the LPS layer.
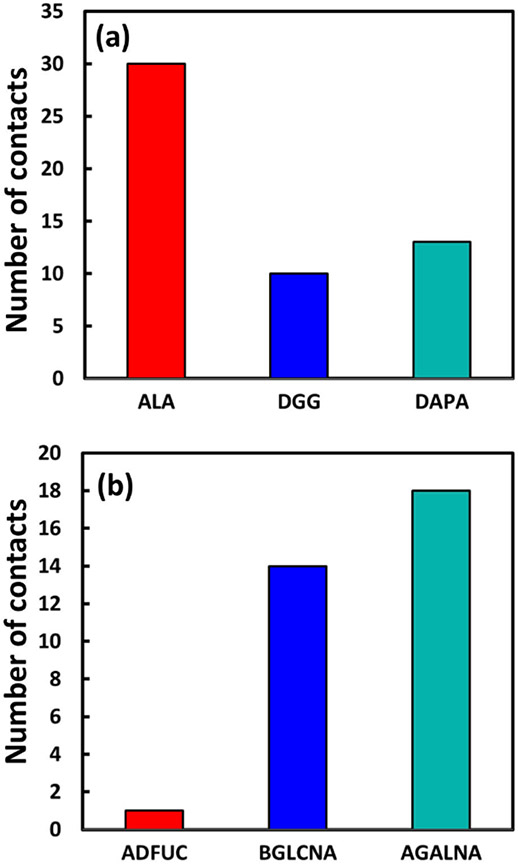
Both simulations started with the same initial conditions (e.g. the initial distance between the flake and the cell wall, time of simulation, etc.). Figure 6 shows the majority of residues forming contacts with flakes in each system.
Figure 6.
Residues forming the majority of contacts.
Although LPS hardly approaches the flake, among its residues, aGalNA, bGlcNA, and aDFuc monosaccharides (O-antigen residues on top of LPS) form the majority of contacts with the flake. These monosaccharides are the most exposed residues of LPS. For PGN the majority of contacts are made between the peptides and the flake. Furthermore, contacts of the flake with PGN outnumber those with LPS (Figure 6). Peptides are more flexible than glycans as well as LPS, allowing them to wrap around the graphene flake, maximizing their contacts. Terminal alanine residues, in particular, have a negative charge on their carboxyl groups, which maximizes the electrostatic interaction. LPS molecules have negatively charged phosphorus at the core, which are surrounded by Mg2+ ions. This strong coulombic interaction rigidifies the whole structure, limiting intrusion by the flake. In contrast, the flexible structure of PGN more easily allows it to maximize the number of contacts with the flake. We note that the differing interactions of the flake with PGN compared to LPS is not merely a result of the LPS being denser than the PGN, however, as the O-antigen region of LPS, with which the flake primarily interacts, has a similar density to PGN (0.19 amu/Å3 compared to 0.15 amu/Å3, respectively).
4. CONCLUSION
The antibacterial effect of GO flakes against two of the most pathogenic bacteria, P. aeruginosa and S. aureus, was studied experimentally and computationally. MIC tests showed effective inhibition against the gram-positive S. aureus bacteria, whereas the growth of P. aeruginosa was hardly affected by the flakes. SEM images further clarified our results, suggesting a higher affinity of flakes towards S. aureus versus P. aeruginosa. GO flakes covered the S. aureus bacteria tightly, introducing wrinkles on the flakes. P. aeruginosa on the other hand was rarely observed to be covered by a flake, and they were only occasionally loosely in contact (half covered or in the vicinity of one another). To further resolve this difference between species, we performed molecular dynamics simulations for both systems. We tried to model the cell walls of the two bacteria as accurately as possible. Our simulations also showed a meaningful difference in the behavior of a graphene flake near the two bacteria. Indeed, the flake showed a higher affinity towards the cell wall of S. aureus than that of P. aeruginosa. The higher affinity arises from the numerous contacts formed between the peptides of PGN (the cell wall of S. aureus) and the flake. In contrast, in P. aeruginosa, the rigid LPS network limits penetration of and contact with the flake (Figure 5). In both cases, no damaged bacteria were observed in the SEM images, ruling out the possibility of a knife-like mechanism for killing the bacteria. However, it remains possible that a change in the mechanism could be correlated with the size of the flakes, and the large size of our flakes made the knife-cutting mechanism less likely.
Supplementary Material
ACKNOWLEDGMENT
Financial supports from National Institute for Medical Research Development (NIMAD, grant number 957610) should be acknowledged. N. Ashari Astani would like to thank HPC-Europa3 and CODEV for HPC resources. JCG acknowledges support from the US National Institutes of Health (R01-GM123169). MRE also wants to thank Iran National Science Foundation (INSF).
ABBREVIATIONS
- S. aureus
Staphylococcus aureus
- P. aeruginosa
Pseudomonas aeruginosa
- E. coli
Escherichia coli
- PGN
peptidoglycan
- LPS
lipopolysaccharides
- FESEM
field-emission scanning electron microscopy
- MD
molecular dynamics
- FTIR
Fourier-transform infrared
- XRD
X-ray diffraction
- AFM
atomic force microscopy
- MIC
minimum inhibitory concentration
- MBC
minimum bactericidal concentration
- LA
laboratory-adapted
- POPE
phosphatidylethanolamine
- POPG
phosphatidylglycerol
Footnotes
Supporting Information
The Supporting Information is available free of charge on the ACS Publications website.
(Movie 1)(mpg); Graphene oxide sheet interacting with PGN layer. (Movie 2)(mpg) ; Graphene sheet interacting with LPS layer. Membrane is not shown in the movies for clarity.
The authors declare no competing financial interest.
REFERENCES
- (1).Jia Z; Xu W Synthesis and Antibacterial Activities of Quaternary Ammonium Salt of Chitosan. Carbohydr. Res 2001, 333 (1), 1–6. [DOI] [PubMed] [Google Scholar]
- (2).Liu Z; Robinson JT; Sun X; Dai H PEGylated Nanographene Oxide for Delivery of Water-Insoluble Cancer Drugs. J. Am. Chem. Soc 2008, 130 (33), 10876–10877. [DOI] [PMC free article] [PubMed] [Google Scholar]
- (3).Wang L; Chen J; Shi L; Shi Z; Ren L; Wang Y The Promotion of Antimicrobial Activity on Silicon Substrates Using a “Click” Immobilized Short Peptide. Chem. Commun 2014, 50 (8), 975–977. [DOI] [PubMed] [Google Scholar]
- (4).Liu Y; Wang X; Yang F; Yang X Excellent Antimicrobial Properties of Mesoporous Anatase TiO2 and Ag/TiO2 Composite Films. Microporous Mesoporous Mater. 2008, 114 (1–3), 431–439. [Google Scholar]
- (5).Hajian R; Balderston S; Tran T; DeBoer T; Etienne J; Sandhu M; Wauford NA; Chung J-Y; Nokes J; Athaiya M Detection of Unamplified Target Genes via CRISPR–Cas9 Immobilized on a Graphene Field-Effect Transistor. Nat. Biomed. Eng 2019, 3 (6), 427–437. [DOI] [PMC free article] [PubMed] [Google Scholar]
- (6).Hu W; Peng C; Luo W; Lv M; Li X; Li D; Huang Q; Fan C Graphene-Based Antibacterial Paper. ACS Nano 2010, 4 (7), 4317–4323. [DOI] [PubMed] [Google Scholar]
- (7).Klevens RM; Edwards JR; Richards CL Jr; Horan TC; Gaynes RP; Pollock DA; Cardo DM Estimating Health Care-Associated Infections and Deaths in US Hospitals, 2002. Public Health Rep. 2007, 122 (2), 160–166. [DOI] [PMC free article] [PubMed] [Google Scholar]
- (8).Han N; Wang W; Lv X; Zhang W; Yang C; Wang M; Kou X; Li W; Dai Y; Zhang X; Highly Efficient Purification of Multicomponent Wastewater by Electrospinning Kidney-Bean-Skin-like Porous H-PPAN/rGO-g-PAO@Ag+/Ag Composite Nanofibrous Membranes, ACS Appl. Mater. Interfaces 2019, 11, 46920–46929. [DOI] [PubMed] [Google Scholar]
- (9).Cheng Y; Chang Y; Feng Y; Jian H; Wu X; Zheng R; Wang L; Ma X; Xu K; Song P; Wang Y; Zhang H; Hierarchical Acceleration of Wound Healing through Intelligent Nanosystem to Promote Multiple Stages, ACS Appl. Mater. Interfaces 2019, 11, 33725–33733. [DOI] [PubMed] [Google Scholar]
- (10).Cao M; Zhao W; Wang L; Li R; Gong H; Zhang Y; Xu H; Lu JR; Graphene Oxide-Assisted Accumulation and Layer-by-Layer Assembly of Antibacterial Peptide for Sustained Release Applications, ACS Appl. Mater. Interfaces 2018, 10, 24937–24946 [DOI] [PubMed] [Google Scholar]
- (11).Hui L; Huang J; Chen G; Zhu Y;, Yang L; Antibacterial Property of Graphene Quantum Dots (Both Source Material and Bacterial Shape Matter) ACS Appl. Mater. Interfaces 2016, 8, 20–25. [DOI] [PubMed] [Google Scholar]
- (12).Fan L; Xie J; Zheng Y; Wei D; Yao D; Zhang J; Zhang T; Antibacterial, Self-Adhesive, Recyclable, and Tough Conductive Composite Hydrogels for Ultrasensitive Strain Sensing, ACS Appl. Mater. Interfaces 2020, 12, 22225–22236. [DOI] [PubMed] [Google Scholar]
- (13).Jang J; Lee JM; Oh SB; Choi Y; Jung HS; Choi J, Development of Antibiofilm Nanocomposites: Ag/Cu Bimetallic Nanoparticles Synthesized on the Surface of Graphene Oxide Nanosheets, ACS Appl. Mater. Interfaces 2020, 12, 35826–35834. [DOI] [PubMed] [Google Scholar]
- (14).Jannesari M; Akhavan O; Madaah Hosseini HR; Bakhshi B; Graphene/CuO2 Nanoshuttles with Controllable Release of Oxygen Nanobubbles Promoting Interruption of Bacterial Respiration, ACS Appl. Mater. Interfaces 2020, 12, 35813–35825. [DOI] [PubMed] [Google Scholar]
- (15).Huang S; Liu H; Liao K; Hu Q; Guo R; Deng K; Functionalized GO Nanovehicles with Nitric Oxide Release and Photothermal Activity-Based Hydrogels for Bacteria-Infected Wound Healing, ACS Appl. Mater. Interfaces 2020, 12, 28952–28964. [DOI] [PubMed] [Google Scholar]
- (16).Tu Y; Lv M; Xiu P; Huynh T; Zhang M; Castelli M; Liu Z; Huang Q; Fan C; Fang H Destructive Extraction of Phospholipids from Escherichia Coli Membranes by Graphene Nanosheets. Nat. Nanotechnol 2013, 8 (8), 594. [DOI] [PubMed] [Google Scholar]
- (17).Kiani F; Astani NA; Rahighi R; Tayyebi A; Tayebi M; Khezri J; Hashemi E; Rothlisberger U; Simchi A Effect of Graphene Oxide Nanosheets on Visible Light-Assisted Antibacterial Activity of Vertically-Aligned Copper Oxide Nanowire Arrays. J. Colloid Interface Sci 2018, 521, 119–131. [DOI] [PubMed] [Google Scholar]
- (18).Cloutier M; Mantovani D; Rosei F Antibacterial Coatings: Challenges, Perspectives, and Opportunities. Trends Biotechnol. 2015, 33 (11), 637–652. [DOI] [PubMed] [Google Scholar]
- (19).Akhavan O; Ghaderi E Toxicity of Graphene and Graphene Oxide Nanowalls against Bacteria. ACS Nano 2010, 4 (10), 5731–5736. [DOI] [PubMed] [Google Scholar]
- (20).Wang X; Lu P; Li Y; Xiao H; Liu X Antibacterial Activities and Mechanisms of Fluorinated Graphene and Guanidine-Modified Graphene. RSC Adv. 2016, 6 (11), 8763–8772. [Google Scholar]
- (21).Liu S; Hu M; Zeng TH; Wu R; Jiang R; Wei J; Wang L; Kong J; Chen Y Lateral Dimension-Dependent Antibacterial Activity of Graphene Oxide Sheets. Langmuir 2012, 28 (33), 12364–12372. [DOI] [PubMed] [Google Scholar]
- (22).Pier GB Pseudomonas Aeruginosa Lipopolysaccharide: A Major Virulence Factor, Initiator of Inflammation and Target for Effective Immunity. Int. J. Med. Microbiol 2007, 297 (5), 277–295. [DOI] [PMC free article] [PubMed] [Google Scholar]
- (23).Gumbart JC; Beeby M; Jensen GJ; Roux B Escherichia coli Peptidoglycan Structure and Mechanics as Predicted by Atomic-Scale Simulations. PLoS Comput Biol 2014, 10 (2), e1003475. [DOI] [PMC free article] [PubMed] [Google Scholar]
- (24).MacKerell AD Jr; Bashford D; Bellott M; Dunbrack RL Jr; Evanseck JD; Field MJ; Fischer S; Gao J; Guo H; Ha S All-Atom Empirical Potential for Molecular Modeling and Dynamics Studies of Proteins. J. Phys. Chem. B 1998, 102 (18), 3586–3616. [DOI] [PubMed] [Google Scholar]
- (25).Patra N; Wang B; Král P Nanodroplet Activated and Guided Folding of Graphene Nanostructures. Nano Lett. 2009, 9 (11), 3766–3771. [DOI] [PubMed] [Google Scholar]
- (26).Phillips JC; Braun R; Wang W; Gumbart J; Tajkhorshid E; Villa E; Chipot C; Skeel RD; Kale L; Schulten K Scalable Molecular Dynamics with NAMD. J. Comput. Chem 2005, 26 (16), 1781–1802. [DOI] [PMC free article] [PubMed] [Google Scholar]
- (27).Humphrey W; Dalke A; Schulten K VMD: Visual Molecular Dynamics. J. Mol. Graph 1996, 14 (1), 33–38. [DOI] [PubMed] [Google Scholar]
- (28).Pan N; Liu Y; Fan X; Jiang Z; Ren X; Liang J Preparation and Characterization of Antibacterial Graphene Oxide Functionalized with Polymeric N-Halamine. J. Mater. Sci 2017, 52 (4), 1996–2006. [Google Scholar]
- (29).Prasad K; Lekshmi GS; Ostrikov K; Lussini V; Blinco J; Mohandas M; Vasilev K; Bottle S; Bazaka K; Ostrikov K Synergic Bactericidal Effects of Reduced Graphene Oxide and Silver Nanoparticles against Gram-Positive and Gram-Negative Bacteria. Sci. Rep 2017, 7 (1), 1–11. [DOI] [PMC free article] [PubMed] [Google Scholar]
- (30).Ferreira FV; Brito FS; Franceschi W; Simonetti EAN; Cividanes LS; Chipara M; Lozano K Functionalized Graphene Oxide as Reinforcement in Epoxy Based Nanocomposites. Surf. Interfaces 2018, 10, 100–109. [Google Scholar]
- (31).Seo TH; Lee KJ; Park AH; Hong C-H; Suh E-K; Chae SJ; Lee YH; Cuong TV; Pham VH; Chung JS Enhanced Light Output Power of near UV Light Emitting Diodes with Graphene/Indium Tin Oxide Nanodot Nodes for Transparent and Current Spreading Electrode. Opt. Express 2011, 19 (23), 23111–23117. [DOI] [PubMed] [Google Scholar]
- (32).Lai Q; Zhu S; Luo X; Zou M; Huang S Ultraviolet-Visible Spectroscopy of Graphene Oxides. Aip Adv. 2012, 2 (3), 032146. [Google Scholar]
- (33).Nanda SS; Yi DK; Kim K Study of Antibacterial Mechanism of Graphene Oxide Using Raman Spectroscopy. Sci. Rep 2016, 6 (1), 1–12. [DOI] [PMC free article] [PubMed] [Google Scholar]
- (34).Kromka A; Jira J; Stenclova P; Kriha V; Kozak H; Beranova J; Vretenar V; Skakalova V; Rezek B Bacterial Response to Nanodiamonds and Graphene Oxide Sheets. Phys. Status Solidi B 2016, 253 (12), 2481–2485. [Google Scholar]
- (35).Krishnamoorthy K; Jeyasubramanian K; Premanathan M; Subbiah G; Shin HS; Kim SJ Graphene Oxide Nanopaint. Carbon 2014, 72, 328–337. [Google Scholar]
- (36).Ferrari AC; Basko DM Raman Spectroscopy as a Versatile Tool for Studying the Properties of Graphene. Nat. Nanotechnol 2013, 8 (4), 235–246. [DOI] [PubMed] [Google Scholar]
- (37).Akhavan O; Ghaderi E; Esfandiar A Wrapping Bacteria by Graphene Nanosheets for Isolation from Environment, Reactivation by Sonication, and Inactivation by near-Infrared Irradiation. J. Phys. Chem. B 2011, 115 (19), 6279–6288. [DOI] [PubMed] [Google Scholar]
- (38).Barbolina I; Woods CR; Lozano N; Kostarelos K; Novoselov KS; Roberts IS Purity of Graphene Oxide Determines Its Antibacterial Activity. 2D Mater. 2016, 3 (2), 025025. [Google Scholar]
- (39).Cai X; Tan S; Lin M; Xie A; Mai W; Zhang X; Lin Z; Wu T; Liu Y Synergistic Antibacterial Brilliant Blue/Reduced Graphene Oxide/Quaternary Phosphonium Salt Composite with Excellent Water Solubility and Specific Targeting Capability. Langmuir 2011, 27 (12), 7828–7835. [DOI] [PubMed] [Google Scholar]
- (40).Umeda A; Ueki Y; Amako K Structure of the Staphylococcus Aureus Cell Wall Determined by the Freeze-Substitution Method. J. Bacteriol 1987, 169 (6), 2482–2487. [DOI] [PMC free article] [PubMed] [Google Scholar]
- (41).Höltje J-V Growth of the Stress-Bearing and Shape-Maintaining Murein Sacculus of Escherichia coli. Microbiol. Mol. Biol. Rev 1998, 62 (1), 181–203. [DOI] [PMC free article] [PubMed] [Google Scholar]
- (42).Meroueh SO; Bencze KZ; Hesek D; Lee M; Fisher JF; Stemmler TL; Mobashery S Three-Dimensional Structure of the Bacterial Cell Wall Peptidoglycan. Proc. Natl. Acad. Sci 2006, 103 (12), 4404–4409. [DOI] [PMC free article] [PubMed] [Google Scholar]
- (43).Beeby M; Gumbart JC; Roux B; Jensen GJ Architecture and Assembly of the Gram-Positive Cell Wall. Mol. Microbiol 2013, 88 (4), 664–672. [DOI] [PMC free article] [PubMed] [Google Scholar]
- (44).Vollmer W; Seligman SJ Architecture of Peptidoglycan: More Data and More Models. Trends Microbiol. 2010, 18 (2), 59–66. [DOI] [PubMed] [Google Scholar]
- (45).Jo S; Kim T; Iyer VG; Im W CHARMM-GUI: A Web-Based Graphical User Interface for CHARMM. J. Comput. Chem 2008, 29 (11), 1859–1865. [DOI] [PubMed] [Google Scholar]
Associated Data
This section collects any data citations, data availability statements, or supplementary materials included in this article.


