

Abstract
Despite the recent explosion of machine learning applied to medical data, very few studies have examined algorithmic bias in any meaningful manner, comparing across algorithms, databases, and assessment metrics. In this study, we compared the biases in sex, age, and race of 56 algorithms on over 130,000 electrocardiograms (ECGs) using several metrics and propose a machine learning model design to reduce bias. Participants of the 2021 PhysioNet Challenge designed and implemented working, open-source algorithms to identify clinical diagnosis from 2- lead ECG recordings. We grouped the data from the training, validation, and test datasets by sex (male vs female), age (binned by decade), and race (Asian, Black, White, and Other) whenever possible. We computed recording-wise accuracy, area under the receiver operating characteristic curve (AUROC), area under the precision recall curve (AUPRC), F-measure, and the Challenge Score for each of the 56 algorithms. The Mann-Whitney U and the Kruskal-Wallis tests assessed the performance differences of algorithms across these demographic groups. Group trends revealed similar values for the AUROC, AUPRC, and F-measure for both male and female groups across the training, validation, and test sets. However, recording-wise accuracies were 20% higher (p < 0.01) and the Challenge Score 12% lower (p = 0.02) for female subjects on the test set. AUPRC, F-measure, and the Challenge Score increased with age, while recording-wise accuracy and AUROC decreased with age. The results were similar for the training and test sets, but only recording-wise accuracy (12% decrease per decade, p < 0.01), Challenge Score (1% increase per decade, p < 0.01), and AUROC (1% decrease per decade, p < 0.01) were statistically different on the test set. We observed similar AUROC, AUPRC, Challenge Score, and F-measure values across the different race categories. But, recording-wise accuracies were significantly lower for Black subjects and higher for Asian subjects on the training (31% difference, p < 0.01) and test (39% difference, p < 0.01) sets. A top performing model was then retrained using an additional constraint which simultaneously minimized differences in performance across sex, race and age. This resulted in a modest reduction in performance, with a significant reduction in bias. This work provides a demonstration that biases manifest as a function of model architecture, population, cost function and optimization metric, all of which should be closely examined in any model.
Keywords: Bias, Race, Age, Sex, Machine learning, Healthcare
Introduction
Recent studies have shown that reducing bias and including diversity and representation in healthcare increases providers’ comfort, patient’s trust on their care, and it can help reduce health disparities for under-represented populations [1,2]. In recent years, due to the availability of high-level deep learning libraries, there has been a large increase in healthcare automatic diagnostic algorithms [3]. However, very few studies have examined diagnostic algorithmic bias (as a function of sex, age, and race) in any meaningful manner, comparing across algorithms, databases and assessment metrics [4,5]. Nevertheless the impact of bias in automatic algorithms can be large. Obermeyer et al. looked at racial bias in health algorithms and found evidence of disparities in an automatic screening algorithm deployed at multiple healthcare centers and used in health insurance plans [2]. The machine learning algorithm falsely concluded that Black patients were healthier than equally sick White patients, which led to Black patients being less likely to be referred to case management despite being equally sick as White patients [2].
In the case of ECG, there are not many studies looking at bias across algorithms, databases, and metrics. Most studies look at ECG features and prognostics [5,6]. The aim of this study is to compare the performance by sex, age, and race of 56 ECG automatic classification algorithms on over 130,000 electrocardiograms (ECGs) using a wide range of metrics, and propose a bias reduction machine-learning model design to help improve health equity.
Reduced-bias machine-learning model design
Machine learning models/algorithms tend to be biased for race, sex, age, affluence/poverty, etc., not by-design but rather due to: 1) the imbalanced data used for training, 2) the machine learning criteria used for model optimization. The well-known solution to address these biases is to make the training data more heterogeneous and abundant. The less-common approach that is hereby proposed is to build measures of un-biasedness and health-equity into machine learning design objectives. We mathematically formulate the proposed framework as follows. For a training and validation dataset X and a parametric model/algorithm φ, a conventional machine learning pipeline tends to minimize a loss function f (X; φ). This loss function can be any of the generic machine learning design objectives such as accuracy, area under the receiver operating characteristic curve (AUROC), area under the precision-recall curve (AUPRC), F- measure, etc. We propose to regularize this loss-function by a “bias-penalization” term, as follows:
| (1) |
where γ(X; φ) is a measure of bias and λ is the regularization (penalization) factor. Constrained optimization is generally known to underperform as compared with the unconstrained loss-function f (X; φ). This under-performance is however, in favor of satisfying the additional constraint, which is a reduced bias in this study. This general constrained optimization scheme is studied in the sequel for a specific case study.
CASE study: The 2021 physionet challenge
Data, algorithms, and scores from the 2021 PhysioNet/Computing in Cardiology Challenge [7,8] were used in this study. The aim of the 2021 PhysioNet Challenge was to identify cardiac arrhythmia and abnormalities from 12, 6, 4, 3, and 2-lead ECG recordings. In this study, we focused our analysis on the 2-lead ECG algorithms. Although the diagnostic value of any 2-lead combination varies, the two leads selected in the PhysioNet Challenge 2021 were based on the most common configurations observed in ECG monitoring, i.e., leads I and II [8]. Fifty six participants from academia and industry designed and implemented working, open-source and automatic algorithms to identify multiple clinical diagnoses from 2-lead ECG recording. The 2021 PhysioNet Challenge included a total of 131,155 ECG recordings from 9 databases, 4 countries, and 3 continents [7,8]. Each 12-lead ECG recording was collected using a standard 10-electrode system, and the final diagnoses were made directly by a specialist or from human-overread machine labels with single or multiple human readers [8]. The data were divided into a public training dataset (88,253 ECG recordings), a hidden validation dataset (6630 ECG recordings), and a hidden test data (36,272 ECG recordings). The duration of the ECG recordings were between 5 s and 30 min with mean and median durations of 12 and 10 s, respectively [8].
We grouped the data from the training, validation, and test datasets by sex (male vs female), age (binned by decade), and race (Asian, Black, White, and Other) whenever these information were available. If the information were not available, the recording was not included in the analysis. We computed macro AUROC, AUPRC, and F-measure; recording-wise accuracy; and the Challenge Score. The Challenge score is a metric developed specifically for the 2020 and 2021 PhysioNet Challenges [8]. The Challenge score is a weighted version of the traditional accuracy metric based on a reward matrix that gives partial credit to misdiagnoses that are less risky or have similar treatments as the given diagnoses [8]. An algorithm’s final Challenge score is a sum of the values across the recordings in the test set, where a higher Challenge Score is better. In contrast, recording-wise accuracy was computed as the fraction of recordings for which all classes were correctly classified.
The paired Mann-Whitney U statistic and the Kruskal-Wallis statistic were computed to test the statistical significance of the performance difference of all algorithms between sex, each age decade, and race for the different metrics across datasets. Only algorithms that meet the inclusion criteria: AUROC ≥0.5, AUPRC ≥0.1, recording-wise accuracy ≥0.05, F-measure ≥0.1, and Challenge score ≥ 0.2 in the training, validation, and test sets were included in these analyses.
A LASSO model using 11 algorithms ranked based on forward selection on the training set was used with the reduced bias model. For consistency, it was retrained on the training data with race information. The loss function and measure of bias were dependent on the metric of interest and individual characteristics studied. The optimal bias regularization factor λ was selected from the values 10−2, 10−1, 1, 10, and 102 based on model performance on the validation set after training the model with each parameter on the training set.
Results
Out of the 56 participants’ algorithms, 36 met the inclusion criteria and were included in our analysis. The individual algorithm performances varied across datasets, metrics, and subjects characteristics. However, we present the results by subjects characteristics, i.e., sex, age, and race analysis.
Sex analysis
The total number of recording with sex information across the training, validation, and test set is presented in Table 1.
Table 1.
Subject distribution by sex across the training, validation, and test sets.
| Dataset | Subjects | Male | Female |
|---|---|---|---|
| Training | 88,150 | 54.85% | 45.15% |
| Validation | 6630 | 52.50% | 47.50% |
| Test | 36,262 | 53.11% | 46.89% |
We observe similar trend values for the AUROC, AUPRC, and F-measure for both male and female across the different datasets. However, recording-wise accuracies were higher and the Challenge score lower for female ECGs. The results were consistent across the training, validation, and test sets, but we only observed statistically differences on the test dataset with recording-wise accuracies 20% higher (p = 0.02); and Challenge score 12% lower (p = 0.02) for female subjects. Fig. 1 shows the individual algorithm Challenge score performances on the test set with age information color ranked by their final Challenge score on the complete test set. The loss function f (X; φ) was set as one minus the Challenge score of the training subset, the bias measure factor γ(X; φ) was equal to the absolute value of the difference between the Challenge score on the male and the female populations, and the optimal penalization factor λ was equal to 10:
| (2) |
where ChScr denotes the Challenge score and the subscripts correspond to the sex groups.
Fig. 1.
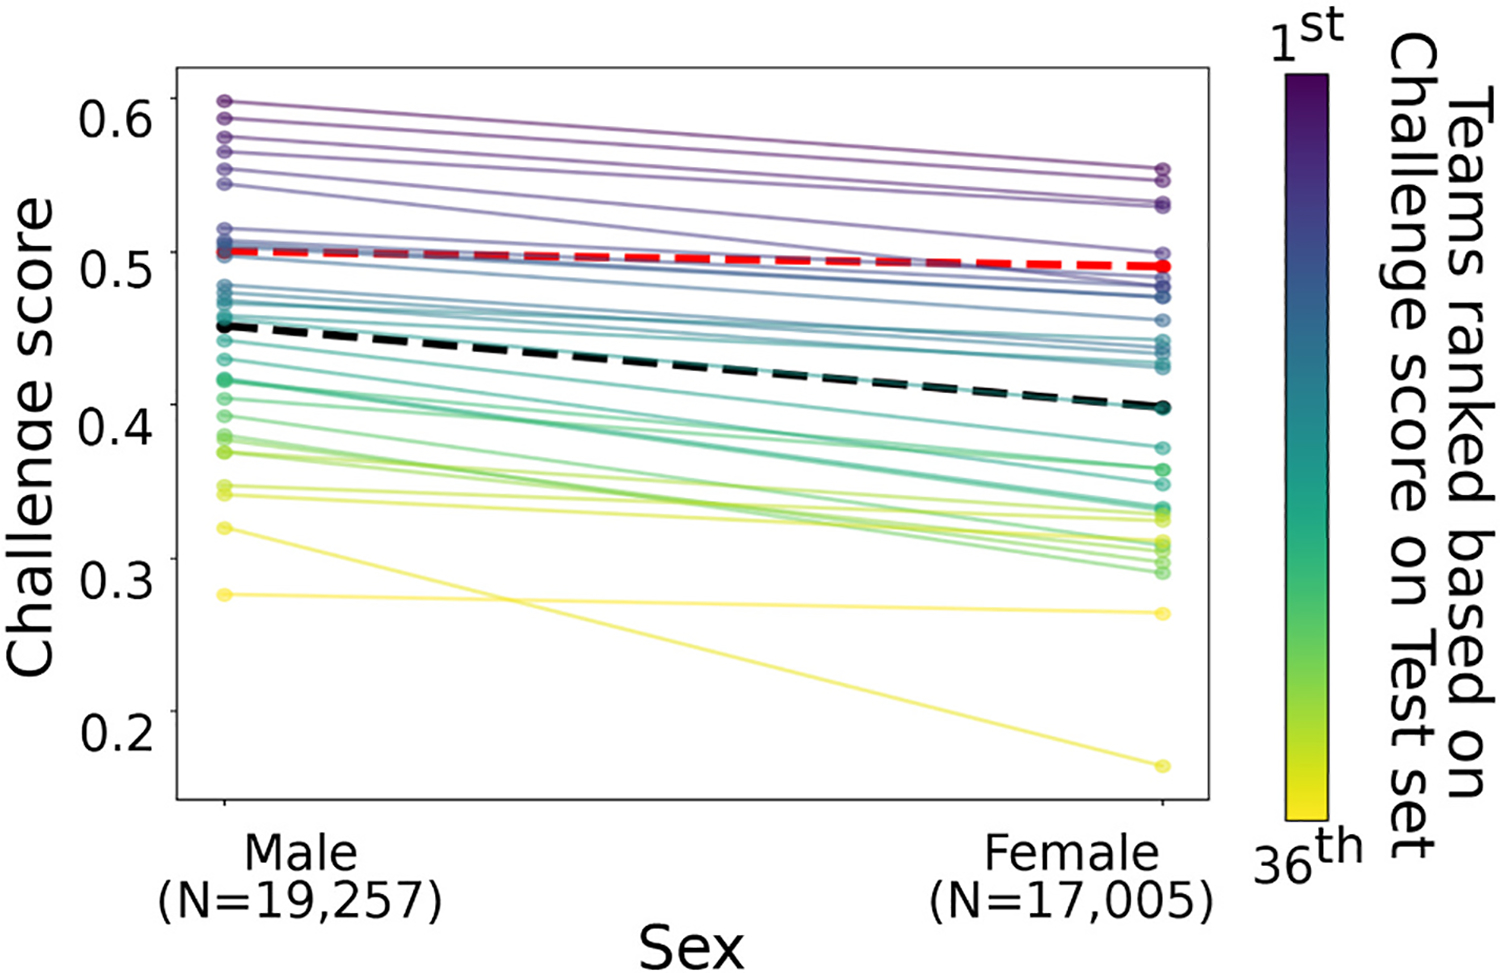
Illustrations of Challenge score individual algorithm performances on the test set grouped by sex characteristics in Table 1. The line color represents the final rank by their Challenge score on the test set - from 1st (purple) to 36th (yellow). Mean values are included as a black dotted line. The red dotted line is the reduced-bias model.
Race analysis
The total number of recordings with race information on the training and validation/test sets is presented in Table 3, with combined results for the validation and test sets due to the limited number of subjects and similarity on the results.
Table 3.
Subject distribution by age across the training, validation, and test sets.
| Datasets | Subjects | 18–29 | 30–39 | 40–49 | 50–59 | 60–69 | 70–79 | ≥80 |
|---|---|---|---|---|---|---|---|---|
| Training | 87,644 | 7.56% | 6.19% | 10.55% | 18.19% | 23.61% | 19.87% | 14.02% |
| Validation | 5749 | 5.34% | 7.83% | 12.30% | 19.79% | 29.62% | 25.12% | 0.00% |
| Test | 36,103 | 3.46% | 6.36% | 11.10% | 18.78% | 25.06% | 22.42% | 12.83% |
We observed similar AUROC, AUPRC, Challenge score, and F-measure values across the different race categories and across the different datasets. However, recording-wise accuracies were significantly lower for Black subjects and higher for Asian subjects on the training (31% difference, p < 0.01) and test (39% difference, p < 0.01) datasets. Fig. 2 shows the individual algorithm recording-wise accuracy on the test set for each race group color ranked by their final Challenge score on the complete test set. The loss function f (X; φ) was set as one minus the recording-wise accuracy of the training subset, the bias measure factor γ(X; φ) was equal to the absolute value of the difference between the recording-wise accuracy on the Black populations and the Asian populations, and the optimal penalization factor λ was equal to 10:
| (3) |
where RwACC denotes recording-wise accuracy and the subscripts correspond to the population of interest.
Fig. 2.

Illustrations of individual algorithm recording-wise accuracy performances on the test set grouped by race (Table 2). The recording-wise accuracy was computed as the fraction of recordings for which all classes were correctly classified. The line color represents the final rank by their Challenge score on the test set - from 1st (purple) to 36th (yellow). Mean values are included as the black dotted line. The red dotted line is the reduced-bias model.
Age analysis
The total number of recordings with age information across the training, validation, and test set is presented in Table 3.
We observe a general increase with each age decade in AUPRC, F-measure, and the Challenge score, while recording-wise accuracy and AUROC decreased with age. The results were similar for the training and test sets, but only recording-wise accuracy (~12% decrease per decade, p < 0.01), Challenge score (~1% increase per decade, p < 0.01), and AUROC (~1% decrease per decade, p < 0.01) were statistically different on the test set. Fig. 3 shows the individual algorithm Challenge score (left) and recording-wise accuracies (right) by age decade on the test set. We observed the recording-wise accuracy decrease per decade with highest recording-wise accuracy value for the group of 30 to 39 years old and the lowest recording-wise accuracy value for the group of age larger than 80 years old. Conversely, we observed the Challenge score increase per decade with the lowest value for the group of 40 to 49 years old and the highest value for the group of age larger than 80 years old. The red dotted line in Fig. 3 shows the reduced-bias machine-learning model γ(X; φ) results. The loss function f(X; φ) was set as one minus the was equal to the absolute value of the difference Challenge score of the training subset, the bias measure factor between the Challenge score on the 40 to 49 and the ≥80 years old populations. The groups were selected based on their performance on the training model. The optimal penalization factor λ value was equal to 10:
| (4) |
where ChScr denotes the Challenge score and the subscripts correspond to the age groups of interest. Although the bias was reduced by 57% with a 0.05 difference on the Challenge score between the two populations selected, the recording-wise accuracies still show a 0.25 difference between the two populations.
Fig. 3.

Illustrations of individual algorithm performance in terms of Challenge score (left) and recording-wise accuracy (right) on the test set, grouped by age decade (Table 3). The recording-wise accuracy was computed as the fraction of recordings for which all classes were correctly classified. The line color represents the final rank by their Challenge score on the test set - from 1st (purple) to 36th (yellow). Mean values are included as a black dotted line. The red dotted line is the reduced-bias model.
Discussion
We observed most individual algorithms followed the same trend across metrics and subjects groups, which lead us to believe participants did not try to reduce bias in their algorithms even though they included the information in their algorithms such as sex. There were sex biases across the different datasets and metrics, with men having a significant higher Challenge score compared to women (Fig. 1).
Despite the distribution being different for each age group, we observed similar trends across the datasets with the Challenge score and AUPRC significantly varied for each decade with a drop in performance for 40–49 years old. However, the recording-wise accuracy had a significant decrease with decade, with a drop for subjects of age larger than 80 years old (Fig. 3). Although the distributions varied across the training and test set, the comparisons were more statistically significant for the test set as compared to the training sets. However, for race we did not find any significant difference for metrics except recording-wise accuracy for both test and training sets, with lower for Black subjects (Fig. 2).
After applying the reduced-bias design model approach, we were able to minimize the difference in result across the different groups. However, the metric values were less than the value of the first place algorithm. Interestingly, Challenge score and recording-wise accuracies exhibit opposite bias trends. The current penalization approach focused on reducing the difference between the two subpopulations with the largest difference in performance. However, it has the potential to reduce the differences across multiple populations and this approach needs to be further investigated. In addition, we also observed empirically that reducing bias in one factor such as race had little effect on the bias trend of a different factor such as age. We do not claim this as a general result though, and it is important to check that reducing one bias does not exacerbate another.
There are several limitations on this work worth mentioning. The training data was highly imbalanced across the labels and we did not analyze the effects of the imbalanced on each subgroup studied. Most of the training data lack of race information and therefore, this information was not provided to the participants. Furthermore, race is a concept which does not accurately reflect human genetic variation [9]. Moreover, we did not include other potential information specific to each group, which may impact the results, but were not available in our data; for example, the differences in body mass index, body composition, hardware design, electrode types, or different electrical properties across age groups. While it is possible that variations in electrode quality and hardware design could have small, but significant effects on the data, the variety of databases and sources in the Challenge provided the opportunity to learn around this problem. The length of the ECG recordings may also have an impact on the bias, as diagnostic properties for certain arrhythmias depend on the duration of monitoring [10]. However, the mean and median length of the recordings were 12 and 10 s, respectively. In addition, implanted cardiac devices and pacing rhythms might affect the study findings; however, a small number of ECG recording included cardiac devices and atrial/ventricular pacing (N = 406 out of 131,155), and only 299 recordings with pacing rhythm were included in the scoring. The body habitus of subjects during ECG collection may impact the collected ECG and therefore the algorithmic diagnosis. Although most of the ECG in this study were collected in the resting supine position, we do not have information on all the acquisition protocols for all the ECGs [8]. Finally, we note that the bias may not be limited to age, gender and race, which was beyond the scope of this study and although it is tempting to propose age-, sex- and race- specific models, there is an inherent danger in doing so, which is not limited to the exponentially diminishing size of the data as we add each potential bias. Errors in defining membership of the biased classes can create discriminatory practices of already marginalized groups [11].
Conclusion
This study addressed the recurrent problem of biases in algorithmic ECG-based arrhythmia detection. We found significant performance differences of algorithms in several evaluation metrics across sex, race and age groups. Based on the results, we infer that the participants of the Challenge did not try to minimize bias in their algorithms, because the Challenge used generic machine learning metrics and did not penalize bias. As algorithmic diagnosis becomes more and more common, we propose that there needs to be an explicit reward for algorithmic fairness in the evaluation metrics used for machine learning model design. We proposed a reduced-bias machine learning design model, which reduced the difference in performance across groups; however, there was still variation across the evaluation metrics. The variation of bias across different metrics demonstrates the significance of testing for differences in a variety of evaluation metrics across groups. Therefore, not only does class balance/composition between races/genders/ages matter, but also the metric we choose to optimize/measure.
Table 2.
Subject distribution by race across the training, validation/test sets.
| Dataset | Subjects | Asian | Black | White | Other |
|---|---|---|---|---|---|
| Training | 10,344 | 25.2% | 24.7% | 25.1% | 24.8% |
| Validation/Test | 10,328 | 25.2% | 24.6% | 25.1% | 24.8% |
Acknowledgements
This study was funded by unrestricted funding from Alivecor Inc., the National Institute of Biomedical Imaging and Bioengineering (NIBIB) under NIH grant R01EB030362, and the National Center for Advancing Translational Sciences of the National Institutes of Health under Award Number UL1TR002378. DA, GC and JX hold significant stock in AliveCor Inc.
Footnotes
Author statement
Authorship statement (all authors). I have participated sufficiently in the conception and design of this work or the analysis and interpretation of the data, as well as the writing of the manuscript, to take public responsibility for it. I believe the manuscript represents valid work. I have reviewed the final version, and I approve it for publication. Neither this manuscript nor one with substantially similar content under my authorship has been published or is being considered for publication elsewhere, except as may be described in an attachment to this statement.
Declaration of Competing Interest
None.
References
- [1].Alsan M, Garrick O, Graziani G. Does diversity matter for health? Experimental evidence from Oakland. Am Econ Rev 2019;109(12):4071–111. [Google Scholar]
- [2].Obermeyer Z, Powers B, Vogeli C, et al. Dissecting racial bias in an algorithm used to manage the health of populations. Science 2019;366(6464):447–53. [DOI] [PubMed] [Google Scholar]
- [3].Rong G, Mendez A, Assi EB, et al. Artificial intelligence in healthcare: review and prediction case studies. Engineering 2020;6(3):291–301. [Google Scholar]
- [4].Coe J, Atay M. Evaluating impact of race in facial recognition across machine learning and deep learning algorithms. Computers 2021;10(9):113. [Google Scholar]
- [5].Santhanakrishnan R, Wang N, Larson MG, et al. Racial differences in electrocardiographic characteristics and prognostic significance in whites versus Asians. J Am Heart Assoc 2016;5(3):e002956. [DOI] [PMC free article] [PubMed] [Google Scholar]
- [6].Seyerle AA, Young AM, Jeff JM, et al. Evidence of heterogeneity by race/ethnicity in genetic determinants of QT interval. Epidemiology 2014;25(6):790. [DOI] [PMC free article] [PubMed] [Google Scholar]
- [7].Goldberger AL, Amaral LAN, Glass L, et al. PhysioBank, PhysioToolkit, and PhysioNet: components of a new research resource for complex physiologic signals. Circulation 2000;101(23):e215–20. [DOI] [PubMed] [Google Scholar]
- [8].Reyna MA, Sadr N, Perez Alday EA, et al. Will two do? Varying dimensions in electrocardiography: the PhysioNet/Computing in Cardiology Challenge 2021. In: 2021 Computing in cardiology (CinC). vol. 48. IEEE; 2021. p. 1–4. [Google Scholar]
- [9].Gravlee CC. How race becomes biology: embodiment of social inequality. Am J Phys Anthropol 2009;139(1):47–57. [DOI] [PubMed] [Google Scholar]
- [10].Ramkumar S, Nerlekar N, D’Souza D, Pol DJ, Kalman JM, Marwick TH. Atrial fibrillation detection using single lead portable electrocardiographic monitoring: a systematic review and meta-analysis. BMJ Open 2018;8(9):e024178. [DOI] [PMC free article] [PubMed] [Google Scholar]
- [11].Sue S. Science, ethnicity, and bias: where have we gone wrong? Am Psychol 1999; 54(12):1070. [DOI] [PubMed] [Google Scholar]