Abstract
Background:
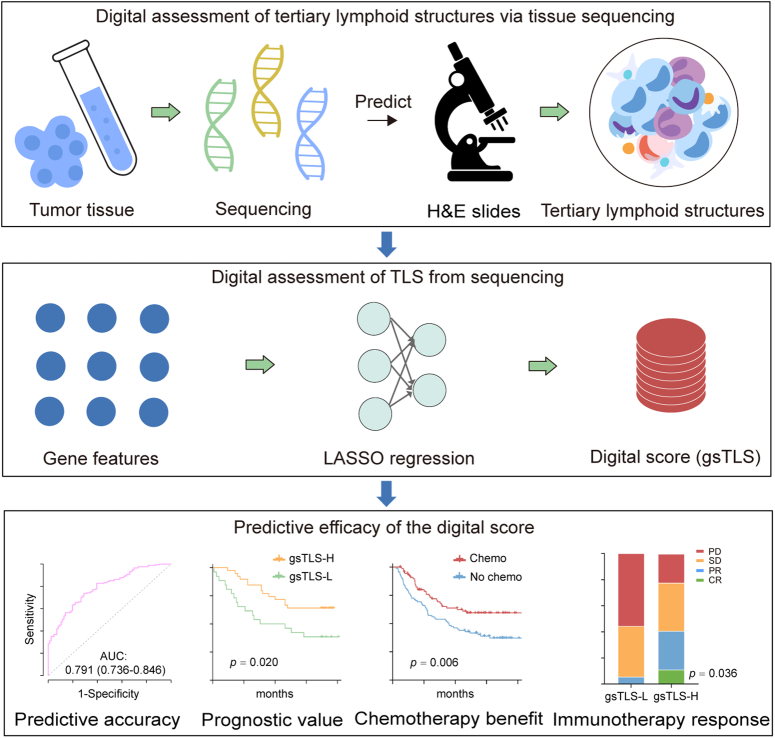
Tertiary lymphoid structures (TLSs) are associated with favorable prognosis and enhanced response to anticancer therapy. A digital assessment of TLSs could provide an objective alternative that mitigates variability inherent in manual evaluation. This study aimed to develop and validate a digital gene panel based on biological prior knowledge for assessment of TLSs, and further investigate its associations with survival and multiple anticancer therapies.
Materials and methods:
The present study involved 1704 patients with gastric cancer from seven cancer centers. TLSs were identified morphologically through hematoxylin-and-eosin staining. The authors further developed a digital score based on targeted gene expression profiling to assess TLSs status, recorded as gene signature of tertiary lymphoid structures (gsTLS). For enhanced interpretability, we employed the SHapley Additive exPlanation (SHAP) analysis to elucidate its contribution to the prediction. The authors next evaluated the signature’s associations with prognosis, and investigated its predictive accuracy for multiple anticancer therapies, including adjuvant chemotherapy and immunotherapy.
Results:
The gsTLS panel with nine gene features achieved high accuracies in predicting TLSs status in the training, internal, and external validation cohorts (area under the curve, range: 0.729–0.791). In multivariable analysis, gsTLS remained an independent predictor of disease-free and overall survival (hazard ratio, range: 0.346–0.743, all P<0.05) after adjusting for other clinicopathological variables. SHAP analysis highlighted gsTLS as the strongest predictor of TLSs status compared with clinical features. Importantly, patients with high gsTLS (but not those with low gsTLS) exhibited substantial benefits from adjuvant chemotherapy (P<0.05). Furthermore, the authors found that the objective response rate to antiprogrammed cell death protein 1 (anti-PD-1) immunotherapy was significantly higher in the high-gsTLS group (40.7%) versus the low-gsTLS group (5.6%, P=0.036), and the diagnosis was independent from Epstein–Barr virus, tumor mutation burden, and programmed cell death-ligand 1 (PD-L1) expression.
Conclusion:
The gsTLS digital panel enables accurate assessment of TLSs status, and provides information regarding prognosis and responses to multiple therapies for gastric cancer.
Keywords: chemotherapy benefit, digital medicine, gene panel, immunotherapy response, tertiary lymphoid structures
Introduction
Highlights
Development of a gene signature of tertiary lymphoid structures (gsTLS) for evaluating the H&E-derived tertiary lymphoid structures, by analyzing multi-institution data with 1704 gastric cancer patients from eight cohorts of seven cancer centers.
The digital assessment of TLSs could provide an objective alternative that mitigates variability inherent in manual histological evaluation.
The digital panel developed from targeted gene expression profiling are predictive of prognosis and multiple anticancer therapies, including chemotherapy and immunotherapy.
The diagnosis of immunotherapy response by this digital gene panel is independent from EBV, TMB, and PD-L1 expression, and the response to immunotherapy can be fully predicted by the gsTLS-based model.
Tertiary lymphoid structures (TLSs) are ectopic lymphoid organs that form in nonlymphoid tissues, such as sites of chronic inflammation and tumors1,2. TLSs offer an important microenvironment for both humoral and cellular antitumor specific immune responses by providing sites for local antigen presentation and allowing the generation of effector T cells and central memory T cells3,4. A growing body of literature highlights its crucial role in cancer progression and therapeutic responses4–9. The presence of TLSs has been associated with improved survival and enhanced response to anticancer therapy across various tumor types6–11. Therefore, assessment of TLSs is immensely valuable for predicting prognosis and response to anticancer therapy.
The discovery of immunotherapy has revolutionized the systemic approach of cancer treatment12–14. Immunotherapy can effectively improve the survival of patients across various cancer types12–14. Importantly, an encouraging outcome of treatment with antiprogrammed cell death protein 1 (anti-PD-1) monoclonal antibody for advanced gastric cancer (GC) has been reported in the Checkmate-649 trial12. However, most patients receiving immunotherapy do not derive benefit12–15. Several biomarkers, including programmed cell death-ligand 1 (PD-L1), Epstein–Barr virus (EBV), and tumor mutation burden (TMB), are available to guide immunotherapy decision-making; nevertheless, these biomarkers are not fully predictive of responses to immunotherapy15–17. In addition, adjuvant chemotherapy (the standard treatment for GC) is not effective in all patients, indicating a significant risk of unnecessary treatment for a considerable number of patients18. TLSs are sites for the generation of circulating effector and memory cells that control tumor progression, which provides unique opportunities to guide the next generation of clinical trials in the discovery of diagnostic markers for response to anticancer therapy3,4.
The current evaluation of TLSs relies on histopathological staining performed by experienced pathologists, such as hematoxylin-and-eosin (H&E), immunohistochemistry, and multiplex immunofluorescence staining6,7,19. However, the histopathological staining approaches are limited by subjective variability. Furthermore, these approaches entail specialized requirements for sampling depth and tissue size. Moreover, there is a need to standardize procedures of staining to facilitate simple and robust detection and quantification of TLSs in tumor samples1,2. In addition, the detection and classification of TLSs by histological approaches are high-cost, tedious, and time-consuming processes20. These potential imperfections pose long-term challenges for its clinical application. Therefore, developing an alternative method to assess TLSs status is essential.
Fueled by advancements in tissue sequencing and the resulting high-throughput data, digital assessment of tumor biological characteristics using genomic information is becoming a practical option in clinical settings21,22. Tracing back to the neogenesis of TLSs, including chemokines and cell populations, various gene features correlated with TLSs have been proposed23–26. An eight-gene signature which represented T follicular helper cells, including C-X-C motif chemokine ligand 13 (CXCL13, was characterized in breast cancer23. A 19-gene signature related to T helper 1 cells and B cells had also been reported as a proxy for the presence of TLSs24. In addition, the unique expression of CXCL13 allowed the identification of TLSs in colorectal cancer consensus molecular subtypes25. In ovarian cancer, where tumor infiltrating plasma cells were shown to be correlated with TLSs, a plasma cell-specific signature of the gene tumor necrosis factor (TNF) receptor superfamily member 17 (TNFRSF17) has been proposed26. On this basis, Fridman et al.1 proposed 39 gene features associated with TLSs. However, the best TLSs transcriptomic signature has not been elucidated thus far. Hence, there remains a need for the development of robust TLSs detection panels using data from mRNA sequencing or transcriptomic analyses of tumor samples. Such a panel would be useful for the follow-up of experimental and clinical studies.
This study aims to develop and validate a digital gene panel for the evaluation of TLSs status by machine learning approach using prior knowledge of the biology underlying TLSs from bioinformatic studies1,2,8. TLSs status was determined by histopathological analysis of whole-slide images (WSIs) obtained through H&E staining. The contribution of the digital signature to the prediction was elucidated using SHapley Additive exPlanations (SHAP) analysis. We further investigated the predictive accuracy of the signature for prognosis and multiple anticancer therapies.
Materials and methods
Study design and patients
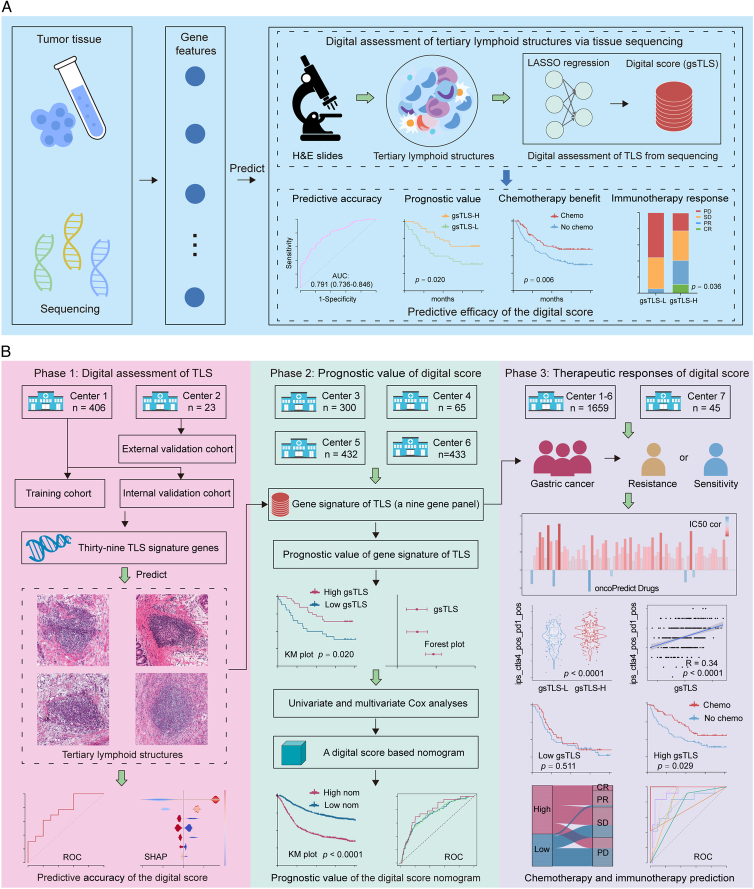
This multicenter study included 1704 patients with GC from seven cancer centers. The overall study design is shown in Figure 1. The TCGA-STAD cohort was obtained from The Cancer Genome Atlas (TCGA) database (https://portal.gdc.cancer.gov/), of which cases with transcriptomic data were randomly assigned to the training cohort and internal validation cohort. The external validation cohort were recruited from NF hospital (SMU) between January 2021 to December 2022. Data on the ACRG, YUSH, SMC, and KRIBB cohorts were obtained from four different cancer centers. The immunotherapy cohort (PRJEB25780) treated with anti-PD1 drugs were retrieved from the European Bioinformatics Institute database (https://www.ebi.ac.uk/). The enrolled criteria and data processing are presented in the Supplementary Methods (Supplemental Digital Content 1, http://links.lww.com/JS9/C790) and Supplementary Figure 1 (Supplemental Digital Content 1, http://links.lww.com/JS9/C790). This study was reported in line with the REMARK criteria (Supplemental Digital Content 2, http://links.lww.com/JS9/C791)27.
Figure 1.
Workflow of the study. (A) Abbreviated representation of the study; (B) The overall design of the study. Bulk tissue sequencing data were retrospectively retrieved to develop and validate a digital score for the prediction of H&E-based TLSs, which was further used to evaluate the prognosis and therapeutic responses in gastric cancer. H&E, hematoxylin-and-eosin; TLSs, tertiary lymphoid structures.
Clinicopathologic data were collected from the medical system or corresponding platforms. The tumor-node-metastasis (TNM) staging was reclassified according to the 8th edition of the Cancer Staging Manual of the American Joint Committee on Cancer28. The anti-PD-1 drugs included in this study was Pembrolizumab. Disease-free survival (DFS) was defined as the time from cancer diagnosis to disease progression or death due to any cause. Overall survival (OS) was defined as the time from cancer diagnosis to death due to any cause or the last date of follow-up.
Pathological evaluation of TLSs
H&E staining for formalin-fixed paraffin-embedded tumor samples was performed as previously described6. TLSs were assessed morphologically based on WSIs obtained through H&E staining, using a previously published scale1,4. Briefly, for each patient, TLSs were initially identified in the WSIs using the NanoZoomer Digital Pathology platform (Hamamatsu, Japan), which presented as a lymphocyte aggregate on pathological images. Subsequently, patients with TLSs presented on the WSI were classified into the TLSs presence (TLS+) group, while patients without TLSs on the WSIs were classified into the TLSs absence (TLS−) group. To ensure the accuracy of TLSs identification, H&E staining slides were independently evaluated by two gastrointestinal pathologists who were blinded to the clinical data. A third pathologist was consulted to reach a consensus when different opinions arose between the two primary pathologists. Further details are provided in the Supplementary Methods (Supplemental Digital Content 1, http://links.lww.com/JS9/C790).
We further assessed the multiomics characteristics and prognostic value of the H&E-based TLSs. In addition, we conducted a comparative analysis of TLSs status with the existing molecular subtypes, including ACRG subtypes and TCGA subtypes, to assess patient assignment and prognostic stratification. We finally investigated the association between TLSs and tumor infiltrating immune-stromal cells from the microenvironment. Detailed algorithms are given in the Supplementary Methods (Supplemental Digital Content 1, http://links.lww.com/JS9/C790).
Construction of a gene signature for TLSs
We employed Least Absolute Shrinkage and Selector Operation (LASSO) logistic regression to select the most representative features from 39 TLSs-related genes in the training cohort, as shown in the Supplementary Methods (Supplemental Digital Content 1, http://links.lww.com/JS9/C790)1. To enhance the robustness, the dataset was resampled, and the parameters were determined by the expected generalization error estimated using fivefold cross-validation. Finally, the gene signature for TLSs (gsTLS) panel was developed via a linear combination of the selected gene features weighted by their respective coefficients to predict the H&E-based TLSs status. Next, the cut-off value for gsTLS was determined by the optimal Youden’s index in the training cohort. Based on this, all patients were divided into low-gsTLS or a high-gsTLS groups.
Receiver operating characteristic (ROC) curves were used to evaluate the ability of gsTLS in distinguishing H&E-based TLSs status, and compared using the area under the curve (AUC).
SHAP interpretation for gsTLS
We utilized SHAP analysis to enhance the model’s interpretability. SHAP can provide a unified method for interpreting machine learning models by using Shapley values29. Detailed descriptions of Shapley values are presented in the Supplementary Methods (Supplemental Digital Content 1, http://links.lww.com/JS9/C790). Through the SHAP package in Python, the importance of the gsTLS and other clinicopathologic characteristics with interpretations on how they contribute to the prediction of H&E-based TLSs was provided.
Evaluation of the gsTLS for predicting prognosis
The predictive value of the gsTLS for prognosis was evaluated in all patients with available follow-up data, as well as in subgroups defined by clinicopathological characteristics. Kaplan–Meier curves with the log-rank test were used to assess its prognostic value regarding DFS and OS. Univariate and multivariate Cox analyses were performed to evaluate its prognostic value independently from other clinicopathological features. We further investigated the association between gsTLS and tumor infiltrating immune-stromal cells from the microenvironment.
Establishment of a gsTLS-based integrated nomogram
Multivariable analysis was conducted to identify significant variables associated with prognosis. Thereafter, gsTLS and significant variables identified in the multivariate analysis were integrated into a nomogram to improve the predictive accuracy for DFS and OS. Time-dependent ROC analysis and Harrell’s concordance index were used to evaluate the discriminatory ability. Calibration curves were generated to assess the consistency between the actual survival probability and the predicted probability. Decision curve analysis (DCA) was performed to assess the clinical usefulness of the predictive nomogram.
Association between gsTLS and anticancer therapies
Sensitivities to multiple drugs was predicted using ‘oncoPredict’ in all patients. The Cancer Immunome Atlas (TCIA) algorithm was used to predict immunotherapy response between gsTLS groups.
Next, we explored the association between gsTLS and responses to adjuvant chemotherapy in 964 patients with available treatment information. To minimize potential selection bias, we implemented a matching strategy to ensure balanced confounding factors within each gsTLS group. Propensity score matching (PSM) with a 1:1 nearest matching approach was conducted for patients who received chemotherapy versus those who did not.
Additionally, we investigated the predictive value of our gsTLS for anti-PD-1 immunotherapy. Immunotherapy responses included complete response (CR), partial response (PR), stable disease (SD), or progressive disease (PD). Objective response was defined as either CR or PR, according to the Response Evaluation Criteria in Solid Tumors (RECIST) 1.1 criteria30.
Statistical analysis
Statistical analyses were performed using the R software (version 4.2.0), SPSS statistical software (version 26.0), and Python software (version 3.6.7). Detailed algorithms for statistical analysis are listed in the Supplementary Methods (Supplemental Digital Content 1, http://links.lww.com/JS9/C790). Two-sided P-values <0.05 denote statistically significant differences.
Results
Clinicopathological characteristics
Patients with available information on H&E images and transcriptomic data (n=429) were selected to evaluate the TLSs status. Moreover, patients with available follow-up data (n=1230) were used to investigate the predictive value of gsTLS panel for prognosis. Furthermore, data of all patients, including those treated with anti-PD-1 immunotherapy (n=45), were used to investigate associations between gsTLS panel and anticancer therapeutic responses. Supplementary Table 1 (Supplemental Digital Content 1, http://links.lww.com/JS9/C790) lists the detailed clinicopathological characteristics of all patients.
Multiomics characteristics and prognostic value of TLSs
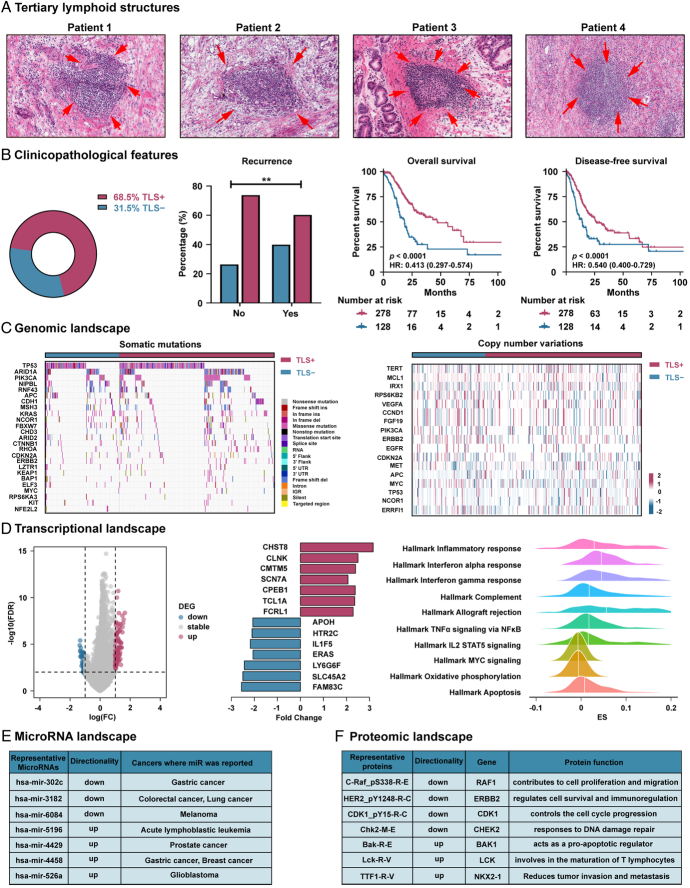
We first evaluated the predictive ability of H&E-based TLSs for clinical outcomes (Fig. 2A). Our data showed that patients without disease recurrence at the last follow-up had a higher proportion of TLS+ (P<0.001, Fig. 2B). The Kaplan–Meier plots further confirmed that patients presenting with TLSs were linked to a favorable prognosis of DFS and OS (P<0.0001 for all, Fig. 2B). The relationships between TLSs status and clinicopathological characteristics in TCGA-STAD cohort (n=406) are presented in Supplementary Table 2 (Supplemental Digital Content 1, http://links.lww.com/JS9/C790). Univariate and multivariate Cox analyses revealed that TLSs remained an independent prognostic factor of DFS [(hazard ratio (HR): 0.507; 95% CI: 0.374–0.687) and OS (HR: 0.410; 95% CI: 0.292–0.575) (P<0.0001 for all, Supplementary Table 3, Supplemental Digital Content 1, http://links.lww.com/JS9/C790). Furthermore, after stratification by TNM stage and other clinicopathological factors, the H&E-based TLSs maintained its statistically significant prognostic value for DFS and OS in these subgroups (Supplementary Figures 2 and 3, Supplemental Digital Content 1, http://links.lww.com/JS9/C790).
Figure 2.
Multiomics characteristics and prognostic value of the H&E-based TLSs. (A) Representative images of TLSs; (B) The clinical features and prognostic value of TLSs; (C) The genomic landscape of TLSs; (D) The transcriptional landscape of TLSs; (E) The microRNA landscape of TLSs; (F) The proteomic landscape of TLSs. H&E, hematoxylin-and-eosin; TLSs, tertiary lymphoid structures.
We further examined the associations between multiomics characterization and TLSs status. We identified genetic events (Fig. 2C), transcriptional characterizations (Figs. 2D and E), and proteomic representations (Fig. 2F) associated with TLSs. Our analyses did not detect a clear correlation of TLSs with genomics. However, we observed a higher incidence of mutations, such as ARID1A (35.8 vs. 25.2%, P=0.053), in the TLS+group compared with the TLS−group, which was associated with immune activation and response to immunotherapy. We further revealed that TLSs were strongly linked to the transcriptomic and proteomic landscapes. Compared with TLS−, TLS+ was positively correlated with tumor immune activation and apoptosis signaling, such as inflammatory response signaling, chemokine signaling, and apoptosis signaling. In contrast, TLS+ displayed a negative correlation with tumor proliferation and metabolism signaling, such as MYC signaling and oxidative phosphorylation signaling (FDR<0.05 for all). Detailed findings are reported in the Supplementary Results (Supplemental Digital Content 1, http://links.lww.com/JS9/C790).
Molecular subtypes and tumor microenvironment (TME) associated with TLSs
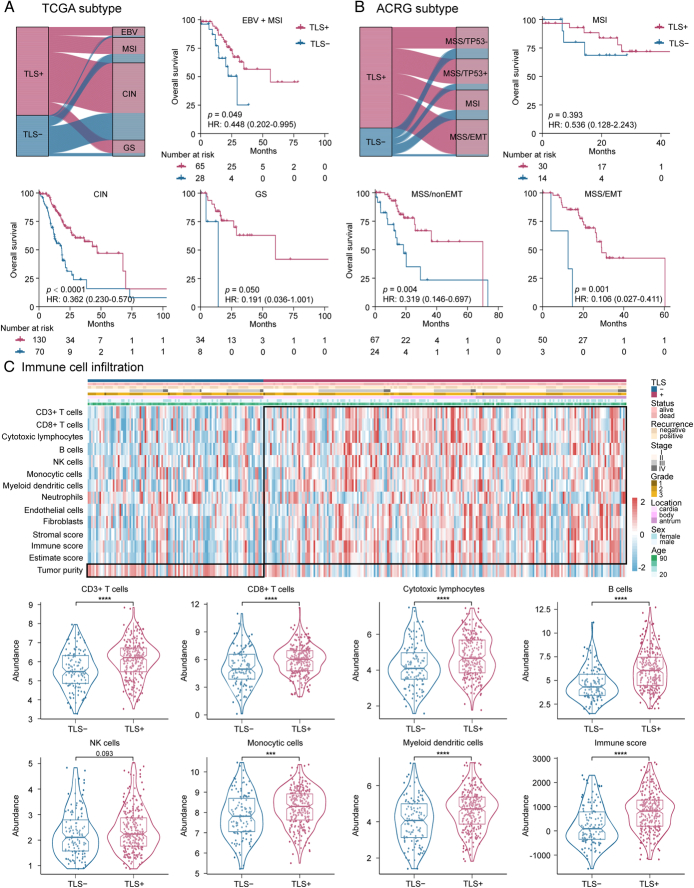
We performed a comparative analysis between TLSs subgroups and the established molecular subtypes, including TCGA subtypes (Fig. 3A) and ACRG subtypes (Fig. 3B). The distribution of TCGA subtypes was not significantly different between the groups, although there was more TLS+ in the EBV and GS subtypes. However, we observed more MSS/EMT and less MSS/TP53- of ACRG subtypes in the TLS+group. Furthermore, when stratified by TCGA subtypes and ACRG subtypes, the TLSs remained an independent prognostic factor for DFS and OS in these subgroups (Fig. 3 and Supplementary Figure 4, Supplemental Digital Content 1, http://links.lww.com/JS9/C790). In addition, we found a higher number of infiltrating immune-stromal cells and TME score in the TLS+group versus the TLS−group (Fig. 3C and Supplementary Figure 5, Supplemental Digital Content 1, http://links.lww.com/JS9/C790).
Figure 3.
Association of H&E-based TLSs status with molecular subtypes, tumor infiltrating immune-stromal cells and TME score. (A) Kaplan–Meier analyses of overall survival (OS) according to H&E-based TLSs status stratified by TCGA subtype; (B) Kaplan–Meier analyses of overall survival (OS) according to H&E-based TLSs status stratified by ACRG subtype; (C) High infiltrating immune-stromal cells and TME score are observed along with the presence of TLSs. H&E, hematoxylin-and-eosin; TCGA, The Cancer Genome Atlas; TLSs, tertiary lymphoid structures; TME, tumor microenvironment.
Development and validation of a gene signature of TLSs
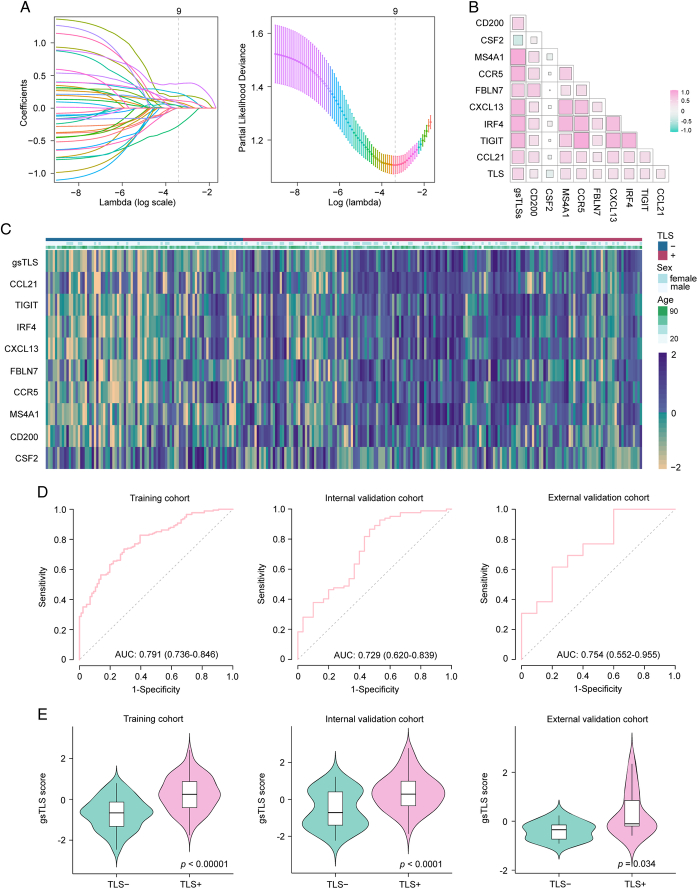
We developed a targeted gene-based gsTLS panel to predict the H&E-derived TLSs status from the LASSO logistic regression model (Fig. 4A). The final targeted gene expression profiling included nine predictors to construct the gsTLS, including MS4A1, CSF2, CXCL13, FBLN7, CCR5, TIGIT, CCL21, IRF4, and CD200 (Fig. 4B). The detailed workflow and calculation formula are provided in the Supplementary Results (Supplemental Digital Content 1, http://links.lww.com/JS9/C790). We next evaluated the predictive accuracy of gsTLS for H&E-based TLSs status in the training, internal, and external validation cohorts. The relationships between TLSs status and clinicopathological characteristics of the training and two validation cohorts are shown in the Supplementary Table 4 (Supplemental Digital Content 1, http://links.lww.com/JS9/C790). The gsTLS panel was significantly associated with clinical and gene features (Fig. 4C). As shown in Figure 4D, the proposed gsTLS panel had an AUC (95% CI) of 0.791 (0.736–0.846) for predicting the H&E-based TLSs status in the training cohort. Similarly, when tested in the validation cohorts, the model achieved high accuracy with an AUC (95% CI) of 0.729 (0.620–0.839) in the internal validation cohort, and 0.754 (0.552–0.955) in the external validation cohort. Moreover, the AUC values of the gsTLS were higher than those of any single gene feature for predicting TLSs status in all three cohorts (Supplementary Figure 6, Supplemental Digital Content 1, http://links.lww.com/JS9/C790). As expected, the output score of gsTLS was significantly higher in the TLS+group than the TLS−group (Fig. 4E).
Figure 4.
Predicted performance of the gsTLS for H&E-based TLSs status in the training and validation cohorts. (A) Gene feature selection using the least absolute shrinkage and selection operator (LASSO) logistic regression model; (B) Scatterplot matrix of the interrelationship among selected genes after dimensionality reduction; (C) Heatmap of nine selected genes and clinical features; (D) Receiver operating characteristic curves of the gsTLS for predicting the TLSs in the training cohort, internal validation cohort, and external validation cohort; (E) the output gsTLS score of different TLSs status in the training cohort, internal validation cohort, and external validation cohort. gsTLS, gene signature of tertiary lymphoid structures; H&E, hematoxylin-and-eosin; TLSs, tertiary lymphoid structures.
The optimal cut-off value for gsTLS identified by Youden’s index in the training cohort was −0.2794 (Supplementary Table 5, Supplemental Digital Content 1, http://links.lww.com/JS9/C790). Accordingly, patients were classified into different gsTLS status: a low-gsTLS group (gsTLS ≤ −0.2794) or a high-gsTLS group (gsTLS > −0.2794). The relationships between gsTLS status and clinicopathological characteristics in each cohort are listed in Supplementary Tables 6–9 (Supplemental Digital Content 1, http://links.lww.com/JS9/C790).
SHAP explanation of the gsTLS
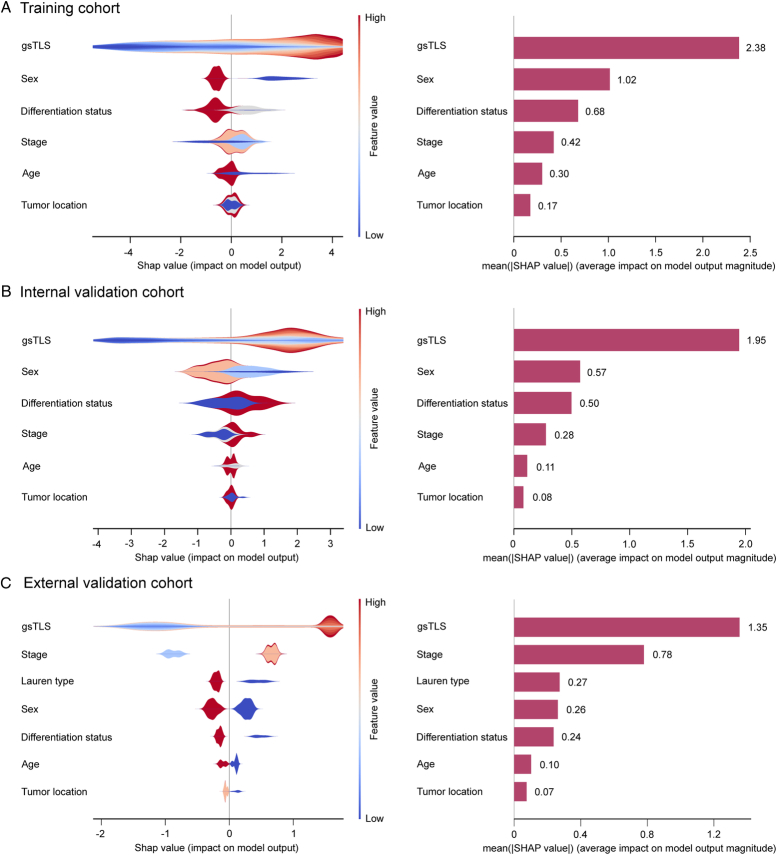
The contribution of gsTLS in predicting H&E-based TLSs was evaluated by SHAP analysis. Shapley value was positively correlated with importance of predictions provided by features to allow model explanation. By calculating the Shapley values, we were able to quantify the contribution of each feature towards the prediction of TLSs. Compared with other clinicopathological features (mean Shapley value: 0.07−1.02), the gsTLS (mean Shapley value: 1.35−2.38) was the most important contributor in predicting TLSs in the training cohort, internal and external validation cohorts (Fig. 5). Additionally, the top nine most important features to predict TLSs were derived from the gene panel; this finding emphasized the importance of gene features in predicting TLSs (Supplementary Figure 7, Supplemental Digital Content 1, http://links.lww.com/JS9/C790).
Figure 5.
SHAP interpretations on gsTLS and clinicopathologic factors to predict the H&E-based TLSs in the training cohort, internal and external validation cohorts. On the X-axis, the contribution of each feature is shown. The Shapley value is positively correlated with the importance. Moreover, a feature with a positive Shapley value will favorably impact the prediction (increase the possibility of TLSs presence). The influence of the value of the feature itself is shown on the Y-axis, for example, for gsTLS, a high value (in red) is associated with a positive Shapley value that will increase the possibility of TLSs presence, while a low value (in blue) will decrease the Shapley value and the possibility of TLSs presence. (A) SHAP plots of training cohort; (B) SHAP plots of internal validation cohort; (C) SHAP plots of external validation cohort. gsTLS, gene signature of tertiary lymphoid structures; H&E, hematoxylin-and-eosin; SHAP, SHapley Additive exPlanations.
Prognostic value of the gsTLS panel
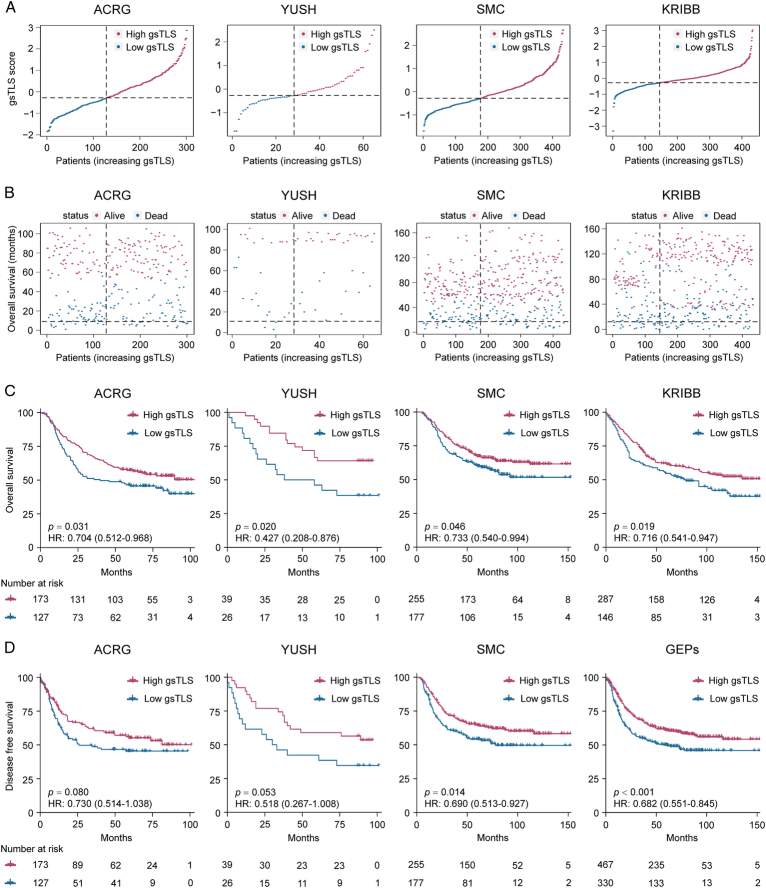
The gsTLS panel was significantly associated with survival outcomes of DFS and OS in the TCGA-STAD, ACRG, YUSH, SMC, and KRIBB cohorts (Fig. 6 and Supplementary Figure 8, Supplemental Digital Content 1, http://links.lww.com/JS9/C790). When merged these four cohorts into a gene expression profiles (GEPs) cohort and an entire cohort including TCGA data, Kaplan−Meier plots (Fig. 6 and Supplementary Figure 9, Supplemental Digital Content 1, http://links.lww.com/JS9/C790) showed that patients in the high-gsTLS group were associated with a favorable prognosis in terms of DFS (HR: 0.682−0.732, P≤0.001) and OS (HR: 0.698−0.701, P<0.001). Of these patients, higher 5-year DFS (44.1 vs. 33.5%, P = 0.003) and OS (55.2 vs. 45.8%, P = 0.002) rates were observed in the high-gsTLS group compared with the low-gsTLS group. Next, we performed univariate and multivariate Cox regression analyses adjusting for clinicopathological variables. The gsTLS remained an independent prognostic factor for predicting DFS and OS in each cohort and the entire cohort (Supplementary Tables 10–12, Supplemental Digital Content 1, http://links.lww.com/JS9/C790). Additionally, within subgroups stratified by various clinicopathological risk factors, including age, sex, tumor location, histological type, differentiated status, chemotherapy, and TNM stage, the gsTLS maintained its statistically significant prognostic value (Supplementary Figure 10, Supplemental Digital Content 1, http://links.lww.com/JS9/C790 and Supplementary Figure 11, Supplemental Digital Content 1, http://links.lww.com/JS9/C790).
Figure 6.
gsTLS is significantly associated with favorable prognosis. (A) Distribution of gsTLS score in each cohort; (B) Distribution of gsTLS score according to the survival status and survival time in each cohort; (C) The Kaplan–Meier plots of overall survival (OS) according to gsTLS status in each cohort; (D) The Kaplan–Meier plots of disease-free survival (DFS) according to gsTLS status in each cohort. gsTLS, gene signature of tertiary lymphoid structures.
In addition, we found a higher number of infiltrating immune-stromal cells and TME score in the high-gsTLS group compared with the low-gsTLS group in the entire cohort and each independent cohort (Supplementary Figure 12, Supplemental Digital Content 1, http://links.lww.com/JS9/C790 and Supplementary Figure 13, Supplemental Digital Content 1, http://links.lww.com/JS9/C790).
Integrated nomogram and its performance in survival prediction
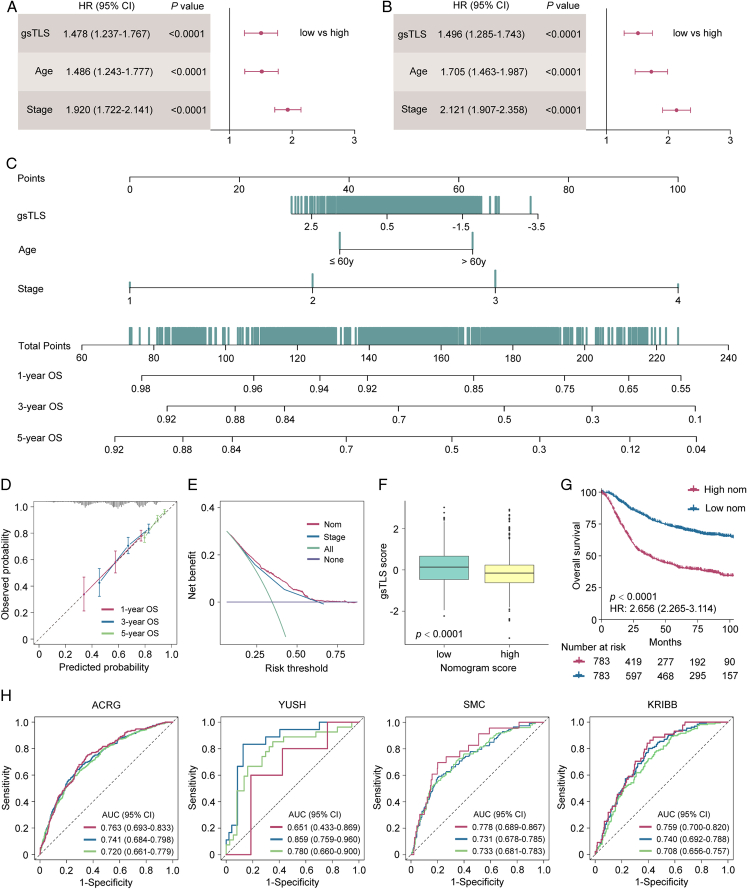
In univariate and multivariate analyses, we identified the gsTLS, TNM stage, and age as independent predictors of DFS (Fig. 7A) and OS (Fig. 7B). Thus, a gsTLS-based nomogram integrating TNM stage and age was developed to predict prognosis (Fig. 7C). The calibration plot demonstrated a favorable consistency between the actual and predicted probabilities (Fig. 7D). DCA showed that the nomogram had a better net benefit than TNM stage across a large range of reasonable threshold probabilities (Fig. 7E). We observed improved survival in patients with low nomogram score, and significantly higher gsTLS than those noted in patients with high nomogram score (Fig. 7F and G). In addition, the nomogram consistently improved the predictive accuracy on prognosis compared with gsTLS and TNM stage alone (all P<0.0001) (Fig. 7H and Supplementary Table 13, Supplemental Digital Content 1, http://links.lww.com/JS9/C790). Application of the nomogram to evaluate the DFS yielded similar results (Supplementary Figure 14, Supplemental Digital Content 1, http://links.lww.com/JS9/C790 and Supplementary Figure 15, Supplemental Digital Content 1, http://links.lww.com/JS9/C790).
Figure 7.
Integrated nomograms and its performance to predict 1-year, 3-year, 5-year overall survival (OS) for patients with gastric cancer from the TCGA-STAD, ACRG, YUSH, SMC, and KRIBB cohorts. (A) Multivariate analysis of DFS for the clinicopathologic characteristics and gsTLS; (B) Multivariate analysis of OS for the clinicopathologic characteristics and gsTLS; (C) A gsTLS-based nomogram was established to predict the prognosis of patients with gastric cancer. (D) Calibration of the nomogram in terms of agreement between the predicted and observed probabilities for 1-year, 3-year, and 5-year survival. (E) Decision curve analysis of OS. (F) The gsTLS of different nomogram status. (G) Kaplan–Meier plots of OS according to the output score of the nomogram. (H) Time-dependent receiver operator characteristic (ROC) curves of the nomogram in the ACRG, YUSH, SMC, and KRIBB cohorts. DFS, disease-free survival; gsTLS, gene signature of tertiary lymphoid structures; OS, overall survival; TCGA-STAD, The Cancer Genome Atlas-stomach adenocarcinoma.
Predictive value of the gsTLS for multiple anticancer therapies
To explore the relationship between gsTLS and drug sensitivity, we calculated the half maximal inhibitory concentration (IC50) value of each drug in the entire cohort. The correlation and significance between drug sensitivities and gsTLS are shown in Figure 8A. The IC50 values of oxaliplatin and cisplatin were higher, while those of sapitinib and dihydrorotenone were lower, in the low-gsTLS group versus the high-gsTLS group (Fig. 8B and Supplementary Figure 16A, Supplemental Digital Content 1, http://links.lww.com/JS9/C790). These results suggest that GC patients with low-gsTLS were resistant to standard chemotherapy regimens; however, they might be sensitive to two other novel drugs. Furthermore, we assessed the immunophenoscore (IPS) score in each patient from the TCGA-STAD database. We found that the PD-1 positive score and cytotoxic T-lymphocyte associated protein 4 (CTLA-4) positive score of IPS were higher in the high-gsTLS group with significant positive correlation; nevertheless, there were no differences found between the gsTLS groups in CTLA-4 negative PD-1 negative score (Fig. 8C and Supplementary Figure 16B, Supplemental Digital Content 1, http://links.lww.com/JS9/C790). This result indicates that GC patients with high gsTLS may benefit from immunotherapy.
Figure 8.
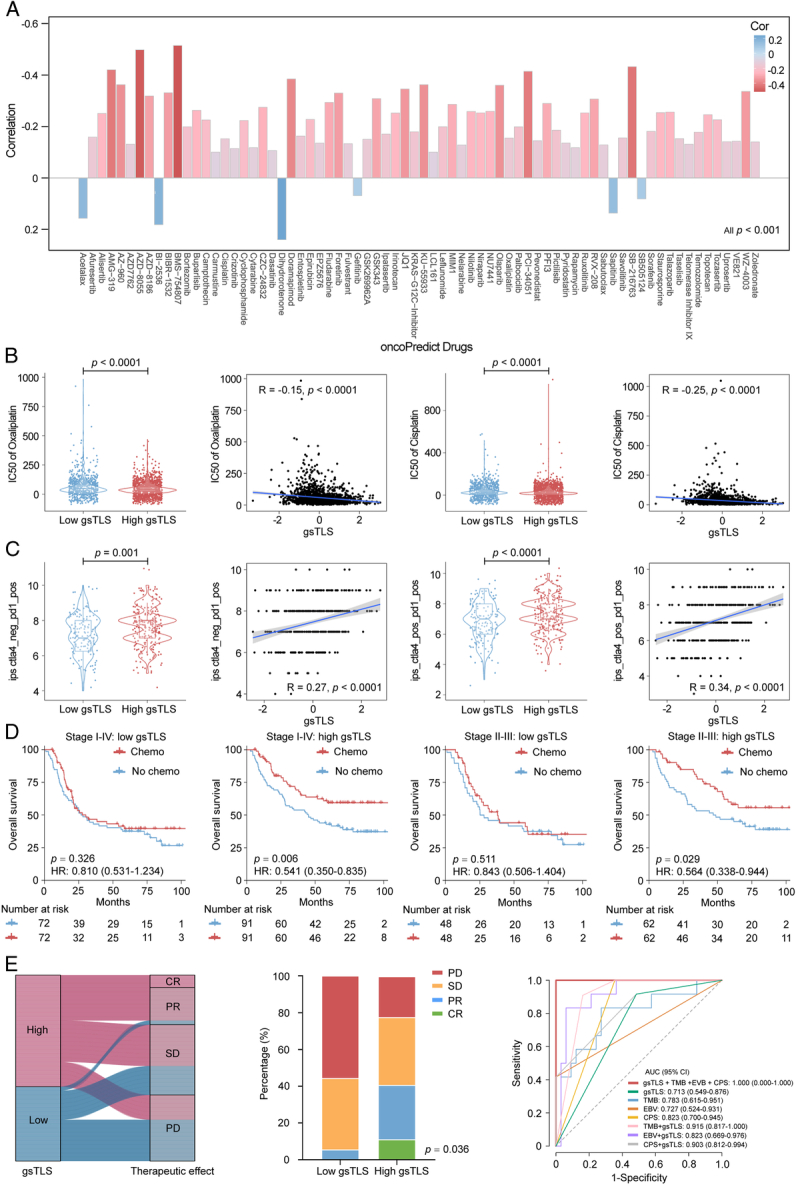
Therapeutic responses predicted by the gsTLS. (A) Therapeutic responses to multiple drugs showed as IC50 predicted by the oncoPredict database; (B) Two representative drugs (oxaliplatin and cisplatin) from the oncoPredict database, for which patients in high-gsTLS group with a low IC50 exhibited sensitivity; (C) The predictive value of gsTLS for immunotherapy response presented by the TCIA database; (D) The predictive value of gsTLS for chemotherapy benefit in patients from the TCGA-STAD, ACRG, YUSH, SMC, and KRIBB cohorts with treatment records; (E) The predictive value of gsTLS for immunotherapy response in advanced gastric cancer undergone anti-PD-1 drug from the PRJEB25780 cohort. IC50, half maximal inhibitory concentration; gsTLS, gene signature of tertiary lymphoid structures; PD-1, programmed cell death protein 1; TCIA, The Cancer Immunome Atlas.
Thus, we assessed the predictive value of the gsTLS panel regarding the benefit from adjuvant chemotherapy and response to immunotherapy. Initially, we performed PSM analysis with 1:1 matching to balance the characteristics between patients treated with and without chemotherapy. We next compared the survival outcomes of patients who received or did not receive chemotherapy in each gsTLS status. In the high-gsTLS group, adjuvant chemotherapy was associated with improved prognosis for patients with stage I−IV disease (HR 0.541, 95% CI: 0.350–0.835, P=0.006). However, chemotherapy had no impact on the survival of patients with low gsTLS (Fig. 8D). Furthermore, similar analyses of patients with stage II–III disease yielded consistent results (Fig. 8D).
We subsequently investigated the associations between gsTLS and immunotherapy response in the PRJEB25780 cohort with anti-PD1 treatment (Fig. 8E). A significantly higher objective response rate was observed in the high-gsTLS group versus the low-gsTLS group (40.7 vs. 5.6%, P=0.036). Next, we compared the performance of the gsTLS panel and several established biomarkers, including CPS of PD-L1, EBV, and TMB, for predicting the immunotherapy response. The gsTLS presented with a high AUC of 0.713 (95% CI: 0.549–0.876) in predicting response to immunotherapy. Additionally, after judgment by EBV, TMB, and PD-L1, the gsTLS panel could further identify patients who could benefit from immunotherapy in the remaining cases. This evidence indicated that the diagnosis of immunotherapy response by gsTLS was independent from EBV, TMB, and PD-L1 expression (Supplementary Figure 17, Supplemental Digital Content 1, http://links.lww.com/JS9/C790). Our gsTLS panel could consistently improve the accuracy of immunotherapy response prediction to EBV, TMB, and PD-L1 (Fig. 8E). Importantly, the combination of these four biomarkers (AUC: 1.0) provided full prediction of response to immunotherapy.
Discussion
TLSs have recently been recognized as a key regulator of tumor progression and major determinant of all types of anticancer therapy1. Although the biological mechanisms behind their formation are incompletely understood, TLSs are known to provide prognostic and therapeutic information6–8. In the present study, we initially identified TLSs as an independent prognostic factor for patients with GC based on H&E staining of pathological slides from primary tumors. We further revealed the underlying associations of TLSs with multiomics characteristics, molecular subtypes, and TME. However, the assessment of TLSs based on histological approaches has disadvantages of subjective variability and complex procedures, rendering its clinical applicability challenging31. Therefore, we developed and validated a targeted gene-based gsTLS panel to predict the histopathologic TLSs status, which realized the intelligent, objective, and accurate detection of TLSs. Through the integration of SHAP analysis, we interpreted the contribution of the gsTLS panel to the prediction, and identified gsTLS as the strongest predictor of TLSs status compared with clinical features.
Importantly, similar to H&E-derived TLSs, the gsTLS panel showed predictive value for prognosis. We further constructed a nomogram integrating gsTLS and clinical characteristics, which consistently improved the predictive accuracy for prognosis. Intriguingly, the gsTLS panel enabled accurate prediction of sensitivity to multiple anticancer therapies, including adjuvant chemotherapy and immunotherapy. Patients with high gsTLS (unlike those with low gsTLS) exhibited substantial benefits from adjuvant chemotherapy. Furthermore, we found that the objective response rate to anti-PD-1 immunotherapy was significantly higher in the high-gsTLS group than the low-gsTLS group; moreover, the prediction was independent from EBV, TMB, and PD-L1 expression.
Recently, increasing studies have focused on the significance of TLSs2–4. The presence of TLSs has been associated with improved survival and enhanced response to anticancer therapy, by providing a critical microenvironment for both humoral and cellular antitumor specific immune responses across various cancer types, despite some contradictory results3,6. In this study, the presence of TLSs in patients with GC was associated with a favorable prognostic outcome. These findings were consistent with previous results in gastrointestinal cancers and other tumors5–9. However, after stratification by clinicopathological characteristics, although long-term survival benefits had been observed in most subgroups, the long-term survival effect of TLS status was not significant in several subgroups. This observation might be due to several reasons. Firstly, the collection of comprehensive clinical data was not the primary objective of TCGA cohort, resulting in relative insufficiency of follow-up time and quality32. These censored data without long-term follow-up caused inconsistencies of the observations in several subgroups. Therefore, although the TCGA data were applicable in most cases, it would underperform in some situations33. Secondly, this bias may be exacerbated by the inadequacy of the sample size of the present study, particularly in some subgroups which included only dozens of cases. Lastly, the inherent bias linked to the retrospective nature of this investigation could be another potential cause of the difference in long-term survival benefit. We further observed a higher incidence of mutations (e.g. ARID1A) in patients with TLSs but not those without TLSs. Mutations on ARID1A potentiated therapeutic antitumor immunity, unleashed by immune checkpoint blockade in several cancer types34,35. Moreover, an important advantage of this study was the development of a gene panel for the assessment of histopathologic TLSs. A digital assessment of TLSs provides an objective alternative that mitigates the variability inherent in manual histological evaluation. Previous studies relied on manual assessment of TLSs by the pathologist using tissue samples, which was a subjective and complicated process20,31. Our approach utilized a panel with nine gene features, which achieved a convenient, accurate, and objective evaluation of TLSs. To our knowledge, this is the first and largest study to develop a gene signature of TLSs and validate its clinical relevance in prognostic and anticancer therapy settings.
Although several transcriptomic signatures of TLSs had been proposed in the literature, they were developed from chemokines and cell populations of TLSs23–26. Besides, these signatures were not developed to predict the TLSs, and further validation was lacking. In contrast, we adopted a systematic data-driven approach to construct a gene panel that can directly evaluate the histopathology-based TLSs status, and validated the signature by assessing clinical outcomes of 1,704 patients with GC.
Large variations are usually observed even among patients with identical TNM staging and similar treatment, indicating the limitations of the current hierarchical tool36,37. Following an in-depth understanding of the heterogeneity of GC, the need for individualized treatment regimens based on the sensitivity of patients to different drugs is increasingly recognized. Therefore, the development of tools to assess the sensitivity of individual patients to anticancer drugs is imperative and long overdue. In this study, we proposed a gene panel of TLSs, which could predict sensitivity to multiple drugs, including chemotherapy and immunotherapy. According to the predictions, patients with high gsTLS were sensitive to commonly used adjuvant chemotherapy. However, for patients predicted with low gsTLS, standard chemotherapy was insufficient to eradicate the disease; hence, more intensive or novel therapies (e.g. gefitinib, acetalax, sapitinib, and dihydrorotenone) were required to improve the outcomes. Furthermore, patients in the high-gsTLS group were more likely to benefit from anti-PD-1 immunotherapy compared with those in the low-gsTLS group. Additionally, the diagnosis of immunotherapy response by gsTLS was independent from EBV, TMB, and PD-L1 expression. Moreover, response to immunotherapy can be fully predicted by the combination of these four biomarkers.
Our digital gsTLS panel could be used as an auxiliary means to the current histopathology staining for TLSs evaluation. This panel could simultaneously facilitate clinical prognostic judgment and provide guidance on individualized anticancer therapy. Additionally, our research team primarily focused on the advancement of machine learning and deep learning approaches for the analysis of multimodal data, such as RNA-sequencing and radiographic images38–40. Our future objective is to seamlessly integrate this gene signature with an imaging repository to effectively predict treatment outcomes and realize potential clinical applications.
This study had several limitations. Firstly, this was a retrospective investigation with potential selection bias. Secondly, the number of samples in the external validation cohort was limited; thus, validation in a large cohort is warranted. Thirdly, further observational evidence in clinical use is lacking. Future work should focus on the validation of this digital panel to confirm its generalizability and reproducibility in larger populations. We envision that it could be used as an adjunct tool to supplement the current evaluation by histopathology staining, and synchronously provide guidance on individualized antitumor therapy.
In conclusion, this study proposed a gsTLS digital panel with nine targeted genes that could accurately predict the histopathology-derived TLSs status. The digital panel enabled improved assessment on prognosis and anticancer therapy, which may allow the optimization of individualized clinical decision-making. Given the repeatability of information acquisitions and processing procedures in oncology, our approach can be extended to many other solid tumor types.
Ethical approval
There is no requirement for informed consent for publicly available data obtained from the TCGA, GEO, and EMBL-EBI databases. This study was approved by the institutional review board of Shenzhen Hospital of Integrated Traditional Chinese and Western Medicine and Nanfang Hospital of Southern Medical University.All procedures involving human participants were conducted in accordance with the Declaration of Helsinki.
Source of funding
This work was supported by grants from the GuangDong Basic and Applied Basic Research Foundation (2023A1515110269) and President Foundation of Nanfang Hospital, Southern Medical University (2023B006). This work also supported from the Postdoctoral Fellowship Program of CPSF under Grant Number GZB20240300.
Author contribution
Y.J., Y.C., and Z.S.: conceptualization; Y.C., Z.S., and J.Y.: data curation; M.U.A. and J.X.: formal analysis; Y.C., C.B., and H.C.: investigation; Y.C. and W.F.: methodology; Z.Z., F.Y., and K.Z.: Software; Y.J., H.C., and C.B.: project administration; Z.S. and Y.J.: supervision; Z.S. and Y.C.: Writing original draft; Y.C., J.Y., and Y.J.: Writing – review and editing.
Conflicts of interest disclosure
The authors declare no competing interests.
Research registration unique identifying number (UIN)
Name of the registry: Research Registry.
Unique identifying number or registration ID: researchregistry9953.
Hyperlink to your specific registration: https://www.researchregistry.com/registernow#home/registrationdetails/65b32b3d35563800277a413c/.
Guarantor
All the authors took responsibility of the final manuscript and approved it for publication.
Data availability statement
All data generated in this study are included in the article or supplementary material and are available from the corresponding authors upon reasonable request.
Supplementary Material
Acknowledgement
Assistance with the study: none
Footnotes
Yan Chen, Zepang Sun, and Junmei Yin contributed equally as first authors.
Caiqun Bie, Hongzhuan Chen, and Yuming Jiang contributed equally as senior authors.
Sponsorships or competing interests that may be relevant to content are disclosed at the end of this article.
Supplemental Digital Content is available for this article. Direct URL citations are provided in the HTML and PDF versions of this article on the journal's website, www.lww.com/international-journal-of-surgery.
Published online 17 June 2024
Contributor Information
Yan Chen, Email: c_yan1207@163.com.
Zepang Sun, Email: zepangsun@163.com.
Junmei Yin, Email: 198060328@qq.com.
M. Usman Ahmad, Email: musahmad@stanford.edu.
Zixia Zhou, Email: zixia@stanford.edu.
Wanying Feng, Email: AliceFung@aliyun.com.
Fan Yang, Email: yangfan@wfu.edu.
Kangneng Zhou, Email: elliszkn@163.com.
Jingjing Xie, Email: jjxxie@ucdavis.edu.
Caiqun Bie, Email: looshy@aliyun.com.
Hongzhuan Chen, Email: 837694690@qq.com.
Yuming Jiang, Email: yumjiang@wakehealth.edu.
References
- 1. Sautès-Fridman C, Petitprez F, Calderaro J, et al. Tertiary lymphoid structures in the era of cancer immunotherapy. Nat Rev Cancer 2019;19:307–325. [DOI] [PubMed] [Google Scholar]
- 2. Schumacher TN, Thommen DS. Tertiary lymphoid structures in cancer. Science 2022;375:eabf9419. [DOI] [PubMed] [Google Scholar]
- 3. Fridman WH, Pages F, Sautes-Fridman C, et al. The immune contexture in human tumours: impact on clinical outcome. Nat Rev Cancer 2012;12:298–306. [DOI] [PubMed] [Google Scholar]
- 4. Calderaro J, Petitprez F, Becht E, et al. Intra-tumoral tertiary lymphoid structures are associated with a low risk of early recurrence of hepatocellular carcinoma. J Hepatol 2019;70:58–65. [DOI] [PubMed] [Google Scholar]
- 5. Oshi M, Kawaguchi T, Yan L, et al. Immune cytolytic activity is associated with reduced intra-tumoral genetic heterogeneity and with better clinical outcomes in triple negative breast cancer. Am J Cancer Res 2021;11:3628–3644. [PMC free article] [PubMed] [Google Scholar]
- 6. Zhang C, Wang XY, Zuo JL, et al. Localization and density of tertiary lymphoid structures associate with molecular subtype and clinical outcome in colorectal cancer liver metastases. J Immunother Cancer 2023;11:e006425. [DOI] [PMC free article] [PubMed] [Google Scholar]
- 7. Vanhersecke L, Brunet M, Guégan JP, et al. Mature tertiary lymphoid structures predict immune checkpoint inhibitor efficacy in solid tumors independently of PD-L1 expression. Nat Cancer 2021;2:794–802. [DOI] [PMC free article] [PubMed] [Google Scholar]
- 8. Cabrita R, Lauss M, Sanna A, et al. Tertiary lymphoid structures improve immunotherapy and survival in melanoma. Nature 2020;577:561–565. [DOI] [PubMed] [Google Scholar]
- 9. Jiang Q, Tian C, Wu H, et al. Tertiary lymphoid structure patterns predicted anti-PD1 therapeutic responses in gastric cancer. Chin J Cancer Res 2022;34:365–382. [DOI] [PMC free article] [PubMed] [Google Scholar]
- 10. Galluzzi L, Buque A, Kepp O, et al. Immunological effects of conventional chemotherapy and targeted anticancer agents. Cancer Cell 2015;28:690–714. [DOI] [PubMed] [Google Scholar]
- 11. Affara NI, Ruffell B, Medler TR, et al. B cells regulate macrophage phenotype and response to chemotherapy in squamous carcinomas. Cancer Cell 2014;25:809–821. [DOI] [PMC free article] [PubMed] [Google Scholar]
- 12. Janjigian YY, Shitara K, Moehler M, et al. First-line nivolumab plus chemotherapy versus chemotherapy alone for advanced gastric, gastro-oesophageal junction, and oesophageal adenocarcinoma (CheckMate 649): a randomised, open-label, phase 3 trial. Lancet 2021;398:27–40. [DOI] [PMC free article] [PubMed] [Google Scholar]
- 13. Felip E, Altorki N, Zhou C, et al. Adjuvant atezolizumab after adjuvant chemotherapy in resected stage IB-IIIA non-small-cell lung cancer (IMpower010): a randomised, multicentre, open-label, phase 3 trial. Lancet 2021;398:1344–1357. [DOI] [PubMed] [Google Scholar]
- 14. Zappasodi R, Merghoub T, Wolchok JD. Emerging concepts for immune checkpoint blockade-based combination therapies. Cancer Cell 2018;33:581–598. [DOI] [PMC free article] [PubMed] [Google Scholar]
- 15. Fuchs CS, Doi T, Jang RW, et al. Safety and efficacy of pembrolizumab monotherapy in patients with previously treated advanced gastric and gastroesophageal junction cancer: phase 2 clinical KEYNOTE-059 trial. Jama Oncol 2018;4:e180013. [DOI] [PMC free article] [PubMed] [Google Scholar]
- 16. Sun YT, Guan WL, Zhao Q, et al. PD-1 antibody camrelizumab for Epstein-Barr virus-positive metastatic gastric cancer: a single-arm, open-label, phase 2 trial. Am J Cancer Res 2021;11:5006–5015. [PMC free article] [PubMed] [Google Scholar]
- 17. Marabelle A, Fakih M, Lopez J, et al. Association of tumour mutational burden with outcomes in patients with advanced solid tumours treated with pembrolizumab: prospective biomarker analysis of the multicohort, open-label, phase 2 KEYNOTE-158 study. Lancet Oncol 2020. Oct;21:1353–1365. [DOI] [PubMed] [Google Scholar]
- 18. Jiang Y, Li T, Liang X, et al. Association of adjuvant chemotherapy with survival in patients with stage II or III gastric cancer. Jama Surg 2017;152:e171087. [DOI] [PMC free article] [PubMed] [Google Scholar]
- 19. Siliņa K, Soltermann A, Attar FM, et al. Germinal centers determine the prognostic relevance of tertiary lymphoid structures and are impaired by corticosteroids in lung squamous cell carcinoma. Cancer Res 2018;78:1308–1320. [DOI] [PubMed] [Google Scholar]
- 20. Buisseret L, Desmedt C, Garaud S, et al. Reliability of tumor-infiltrating lymphocyte and tertiary lymphoid structure assessment in human breast cancer. Modern Pathol 2017;30:1204–1212. [DOI] [PubMed] [Google Scholar]
- 21. Zeng D, Wu J, Luo H, et al. Tumor microenvironment evaluation promotes precise checkpoint immunotherapy of advanced gastric cancer. J Immunother Cancer 2021;9:e002467. [DOI] [PMC free article] [PubMed] [Google Scholar]
- 22. Sundar R, Barr Kumarakulasinghe N, Huak Chan Y, et al. Machine-learning model derived gene signature predictive of paclitaxel survival benefit in gastric cancer: results from the randomised phase III SAMIT trial. Gut 2022;71:676–685. [DOI] [PMC free article] [PubMed] [Google Scholar]
- 23. Gu-Trantien C, Loi S, Garaud S, et al. CD4(+) follicular helper T cell infiltration predicts breast cancer survival. J Clin Invest 2013;123:2873–2892. [DOI] [PMC free article] [PubMed] [Google Scholar]
- 24. Hennequin A, Derangere V, Boidot R, et al. Tumor infiltration by Tbet+ effector T cells and CD20+ B cells is associated with survival in gastric cancer patients. Oncoimmunology 2016;5:e1054598. [DOI] [PMC free article] [PubMed] [Google Scholar]
- 25. Becht E, de Reynies A, Giraldo NA, et al. Immune and stromal classification of colorectal cancer is associated with molecular subtypes and relevant for precision immunotherapy. Clin Cancer Res 2016;22:4057–4066. [DOI] [PubMed] [Google Scholar]
- 26. Kroeger DR, Milne K, Nelson BH. Tumor-infiltrating plasma cells are associated with tertiary lymphoid structures, cytolytic T-cell responses, and superior prognosis in ovarian cancer. Clin Cancer Res 2016;22:3005–3015. [DOI] [PubMed] [Google Scholar]
- 27. Sauerbrei W, Taube SE, McShane LM, et al. Reporting recommendations for tumor marker prognostic studies (REMARK): an abridged explanation and elaboration. J Natl Cancer Inst 2018;110:803–811. [DOI] [PMC free article] [PubMed] [Google Scholar]
- 28. Amin MB, Greene FL, Edge SB, et al. The eighth edition AJCC cancer staging manual: continuing to build a bridge from a population-based to a more “personalized” approach to cancer staging. CA Cancer J Clin 2017;67:93–99. [DOI] [PubMed] [Google Scholar]
- 29. Janizek JD, Dincer AB, Celik S, et al. Uncovering expression signatures of synergistic drug responses via ensembles of explainable machine-learning models. Nat Biomed Eng 2023;7:811–829. [DOI] [PMC free article] [PubMed] [Google Scholar]
- 30. Kim ST, Cristescu R, Bass AJ, et al. Comprehensive molecular characterization of clinical responses to PD-1 inhibition in metastatic gastric cancer. Nat Med 2018;24:1449–1458. [DOI] [PubMed] [Google Scholar]
- 31. Lesterhuis WJ, Bosco A, Millward MJ, et al. Dynamic versus static biomarkers in cancer immune checkpoint blockade: unravelling complexity. Nat Rev Drug Discov 2017;16:264–272. [DOI] [PubMed] [Google Scholar]
- 32. Roelands J, Kuppen PJK, Ahmed EI, et al. An integrated tumor, immune and microbiome atlas of colon cancer. Nat Med 2023;29:1273–1286. [DOI] [PMC free article] [PubMed] [Google Scholar]
- 33. Liu J, Lichtenberg T, Hoadley KA, et al. An integrated TCGA pan-cancer clinical data resource to drive high-quality survival outcome analytics. Cell 2018;173:400–416.e11. [DOI] [PMC free article] [PubMed] [Google Scholar]
- 34. Shen J, Ju Z, Zhao W, et al. ARID1A deficiency promotes mutability and potentiates therapeutic antitumor immunity unleashed by immune checkpoint blockade. Nat Med 2018;24:556–562. [DOI] [PMC free article] [PubMed] [Google Scholar]
- 35. Gu Y, Zhang P, Wang J, et al. Somatic ARID1A mutation stratifies patients with gastric cancer to PD-1 blockade and adjuvant chemotherapy. Cancer Immunol Immunother 2023;72:1199–1208. [DOI] [PMC free article] [PubMed] [Google Scholar]
- 36. Cheong JH, Yang HK, Kim H, et al. Predictive test for chemotherapy response in resectable gastric cancer: a multi-cohort, retrospective analysis. Lancet Oncol 2018;19:629–638. [DOI] [PubMed] [Google Scholar]
- 37. Sharma P, Goswami S, Raychaudhuri D, et al. Immune checkpoint therapy-current perspectives and future directions. Cell 2023;186:1652–1669. [DOI] [PubMed] [Google Scholar]
- 38. Sun Z, Zhang T, Ahmad MU, et al. Comprehensive assessment of immune context and immunotherapy response via noninvasive imaging in gastric cancer. J Clin Invest 2024;134:e175834. [DOI] [PMC free article] [PubMed] [Google Scholar]
- 39. Jiang YM, Liang XK, Han Z, et al. Radiographical assessment of tumour stroma and treatment outcomes using deep learning: a retrospective, multicohort study. Lancet Digit Health 2021;3:E371–E382. [DOI] [PubMed] [Google Scholar]
- 40. Sun Z, Wang W, Huang W, et al. Noninvasive imaging evaluation of peritoneal recurrence and chemotherapy benefit in gastric cancer after gastrectomy: a multicenter study. Int J Surg (London, England) 2023;109:2010–2024. [DOI] [PMC free article] [PubMed] [Google Scholar]
Associated Data
This section collects any data citations, data availability statements, or supplementary materials included in this article.
Supplementary Materials
Data Availability Statement
All data generated in this study are included in the article or supplementary material and are available from the corresponding authors upon reasonable request.


