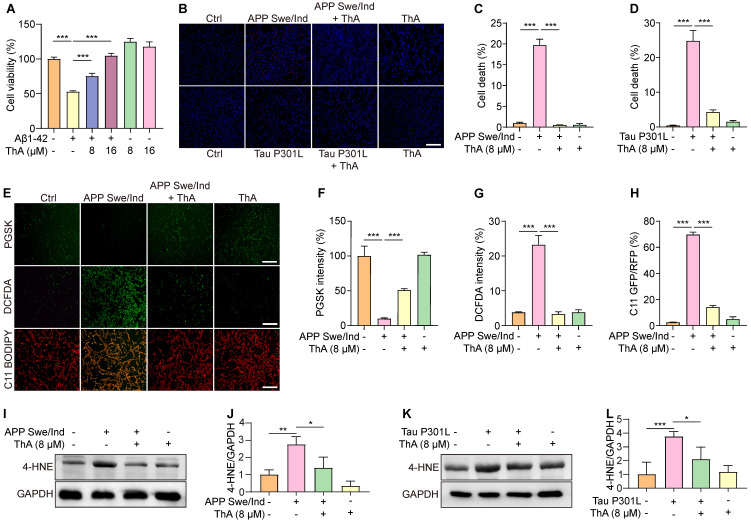
Figure 7.
ThA inhibits ferroptosis in cellular models of AD. (A) Bar chart indicates viability of PC-12 cells treated with 10 μM Aβ1-42, with or without ThA at specified concentrations. (B) Representative images of PC-12 cells, overexpressing APP Swe/Ind or EGFP-Tau P301L, treated with 8 μM ThA and 0.2 μM Lip-1 and stained with PI and Hoechst reagents. Magnification: 10×, Scale bars: 200 μm. (C, D) Bar charts indicate PC-12 cell death. (E) Representative images of PC-12 cells overexpressing APP Swe/Ind, treated with 8 μM ThA and 0.2 μM Lip-1, and stained with PGSK, DCFDA, or C11 BODIPY reagents. Magnification: 10×, Scale bars: 200 μm. (F-H) Bar charts indicate the relative PGSK intensity, DCFDA intensity, and C11 GFP/RFP ratio. (I, K) Representative Western blot images of 4-HNE and GAPDH in PC-12 cells overexpressing APP Swe/Ind or pRK5-EGFP-Tau P301L, treated with 8 μM ThA. Full-length Western blot images are presented in Figure S36. (J, L) Bar charts indicate the ratio of 4-NHE to β-actin. Bar, SD. *, p < 0.05; **, p < 0.01; ***, p < 0.001.

