

Abstract
Aim
To investigate the association of white matter lesions volume (WMLV) levels with dementia risk and the association between dementia risk and the combined measures of WMLV and either total brain atrophy or dementia‐related gray matter atrophy in a general older population.
Methods
One thousand one hundred fifty‐eight Japanese dementia‐free community‐residents aged ≥65 years who underwent brain magnetic resonance imaging were followed for 5.0 years. WMLV were segmented using the Lesion Segmentation Toolbox. Total brain volume (TBV) and regional gray matter volume were estimated by voxel‐based morphometry. The WMLV‐to‐intracranial brain volume ratio (WMLV/ICV) was calculated, and its association with dementia risk was estimated using Cox proportional hazard models. Total brain atrophy, defined as the TBV‐to‐ICV ratio (TBV/ICV), and dementia‐related regional brain atrophy defined based on our previous report were calculated. The association between dementia risk and the combined measures of WMLV/ICV and either total brain atrophy or the number of atrophied regions was also tested.
Results
During the follow‐up, 113 participants developed dementia. The risks of dementia increased significantly with higher WMLV/ICV levels. In addition, dementia risk increased additively both in participants with higher WMLV/ICV levels and lower TBV/ICV levels and in those with higher WMLV/ICV levels and a higher number of dementia‐related brain regional atrophy.
Conclusion
The risk of dementia increased significantly with higher WMLV/ICV levels. An additive increment in dementia risk was observed with higher WMLV/ICV levels and lower TBV/ICV levels or a higher number of dementia‐related brain regional atrophy, suggesting the importance of prevention or control of cardiovascular risk factors.
Keywords: Alzheimer disease, cerebral small vessel diseases, dementia, leukoencephalopathies, Vascular
Cerebral small vessel diseases impair small arteries, veins, and capillaries in the brain 1 and have been reported to increase the risk of mild cognitive impairment and dementia. 2 White matter lesions on magnetic resonance imaging (MRI) are among the pathological features of cerebral small vessel diseases 1 and frequently occur as morphological changes in dementia, including Alzheimer's disease (AD). 3 Cardiovascular risk factors, such as aging, hypertension, diabetes, and smoking, are significantly associated with the risk of white matter lesions, 4 and these cardiovascular risk factors are also known as risk factors for the development of dementia. 5 Several population‐based prospective studies have assessed the association of white matter lesions volume (WMLV) measured quantitively or semi‐quantitively with the development of dementia, and the findings, especially in terms of the risk of AD, were inconsistent. 6 , 7 , 8 , 9 , 10 , 11 , 12 , 13
In addition to white matter lesions, brain atrophy is known as a core morphological change of dementia. 14 Population‐based prospective studies, including our own previous study, have reported significant associations between not only total brain atrophy but also atrophy of dementia‐related regions, such as the hippocampus, medial temporal lobe, and amygdala, and increased risks of developing dementia and AD. 9 , 15 , 16 , 17 , 18 Since brain atrophy and white matter lesions are frequently identified as morphological brain changes of individuals with dementia, 19 there may be synergetic or additive influences of these two changes on the risk of developing dementia, particularly with respect to WMLV levels and the number of regions with dementia‐related atrophy, and their possible combined influence on the risk of AD. However, only one clinical study has assessed the association of medial temporal lobe atrophy and the severity of white matter lesions grade with the risk of cognitive decline, 20 and no population‐based prospective studies have investigated this issue. The first aim of the present study was thus to assess the association between WMLV levels and the risk of developing dementia and its subtypes in a general older Japanese population. Then, in the same population, we assessed the association between either of two combined sets of measures—WMLV levels and total brain atrophy or WMLV levels and the number of atrophied dementia‐related brain regions—and the risk of developing dementia.
Methods
Study population
The Hisayama Study is an ongoing population‐based longitudinal study of cerebro‐cardiovascular diseases that was begun in 1961 in the town of Hisayama, a suburban community in Fukuoka Prefecture in southern Japan. A full community survey for dementia has been repeated every 5 to 7 years since 1985. 21 In 2012–2013, a total of 1906 residents among 2036 residents aged ≥65 years (1126 women and 780 men) participated in the examination for cognitive function and health status (participation rate: 93.6%). Among them, 44 participants who did not consent to this study, four participants who did not complete the baseline examination (two without available data of cognitive function, one with disturbance of consciousness, and one with intellectual disability), 339 participants who had dementia at baseline, and 329 participants without available brain magnetic resonance imaging (MRI) scanning were excluded. Among 1190 participants with brain MRI scanning, we excluded 32 participants without available MRI data (20 without T1‐weighted three‐dimensional images, five without fluid‐attenuated inversion recovery images, four with metal artifacts, two with excessive motion artifacts, and one who did not consent to use of the MRI data), and the remaining 1158 participants (646 women and 512 men) were enrolled in the present study. The present study was conducted with the approval of the Kyushu University Institutional Board of Clinical Research. We obtained written informed consent from all the participants.
Follow‐up surveys
The participants were followed for a median of 5.0 years (interquartile range: 4.9–5.1 years) from the baseline examination. As reported previously, 21 we established a daily monitoring system comprising the study team, local physicians, and members of the town's Health Office to regularly collect information on new neurologic events, including any cognitive decline or stroke. Regular health examinations were performed annually to identify incident dementia cases. For participants who did not undergo regular health examinations or moved out of town, we performed postal and telephone surveys. Moreover, to detect dementia cases as precisely as possible, we conducted comprehensive neuropsychological screening for dementia in 2017–2018, in which 1017 participants (95.7% of total participants) participated. When dementia or any neurological symptoms including cognitive decline were suspected, a psychiatrist and stroke physician from the study team carefully evaluated the participant for the presence or absence of dementia. In the event of the participant's death, we conducted comprehensive investigations, including interviews of the family or attending physician and a review of all the available clinical records, including neuroimaging (CT/MRI). The participants were followed up until the date of neuropsychological screening for dementia in 2017–2018 or March 31, 2018 for those who did not participate in the neuropsychological screening in 2017–2018. No participants were lost to follow‐up except for deceased cases.
Diagnosis of dementia
Details on the diagnostic procedure for dementia have been already reported. 22 In the screening survey, we used the Mini‐Mental State Examination (MMSE). 23 For participants who were suspected of having dementia or mild cognitive impairment (MCI), comprehensive investigations including the Wechsler Memory Scale of logical memory 24 were carried out by expert psychiatrists. The diagnoses of dementia and MCI were made using the criteria of the Diagnostic and Statistical Manual of Mental Disorders, Third Edition, Revised, 25 and the clinical criteria reported by Petersen et al. in, 26 respectively. We defined MCI as either of: (I) objective cognitive impairment based on the neuropsychological data; or (II) any cognitive complaint by a family member, the town's Health Office members, or local practitioners in individuals who showed no evidence of dementia. Participants diagnosed as having Alzheimer's disease (AD) met the diagnostic criteria of the National Institute of Neurological and Communicative Disorders and Stroke and the Alzheimer's Disease and Related Disorders Association, 27 and participants diagnosed with vascular dementia (VaD) met the criteria of the National Institute of Neurological Disorders and Stroke–Association Internationale pour la Recherche et I'Enseignement en Neurosciences. 28 Expert psychiatrists and stroke physicians in the study team adjudicated every case of dementia and MCI together.
MRI analysis
Using a 1.5‐Tesla MRI scanner (Intera Pulsar; Philips Medical Systems, Best, the Netherlands) with a multichannel head coil, we examined 3‐dimensional T1‐weighted images, conventional T1‐ and T2‐weighted images, fluid attenuated inversion recovery (FLAIR), ‐weighted images, and magnetic resonance angiographic images of the brain. White matter lesions on T1‐weighted and FLAIR images were segmented using the Lesion Segmentation Toolbox (LST) for SPM12 with 0.15 as the threshold of signal intensity (κ value), as described previously. 29 The 3‐dimensional T1‐weighted images were converted to Neuroimaging Informatics Technology Initiative format and then segmented into three components (gray matter, white matter, and cerebrospinal fluid) by using VBM8 Toolbox version 435 (University of Jena, Germany) in SPM8 (University College London, UK) running in MATLAB (The Mathworks, Natick, MA). The International Consortium for Brain Mapping template for East Asian brains was used for anatomical setting. As described previously, 18 the gray matter volume (GMV) of each brain region [e.g., frontal, temporal, medial temporal (including entorhinal and parahippocampus), and insular lobes, hippocampus, amygdala] was computed using the Neuromorphometrics atlas of SPM12 (Neuromorphometrics, Somerville, MA) based on the preceding cortical parcellation. The total brain volume (TBV) was calculated as the sum of the gray matter and white matter volumes, and the intracranial volume (ICV) was calculated as the sum of the TBV and the cerebrospinal fluid volumes. In the present study, the ratio of the WMLV to ICV (WMLV/ICV; %) was used as an indicator of white matter lesions corrected with ICV. We calculated the TBV to ICV ratio (TBV/ICV; %) as an indicator of global brain volume corrected with ICV. In addition, the GMV to TBV ratio (GMV/TBV; %) of each brain region was calculated to estimate regional gray matter atrophy beyond total brain atrophy. Cerebrovascular lesions were defined as brain infarction or hemorrhage on MRI regardless of the presence or absence of neurological symptoms. Brain infarction was defined as lesions of ≥3 mm in diameter visible on both the T1‐weighted image (as a hypointense lesion) and the T2‐weighted image (as a hyperintense lesion) with a surrounding hyperintense rim on the FLAIR image. Brain hemorrhage was defined as any hemorrhagic lesions, including cerebral microbleeds, visible on the ‐weighted image (as a hypointense lesion). Each MRI scan was checked by two trained stroke physicians blinded to the clinical information (inter‐rater agreement ratio: 74.8% for the brain infarctions, 83.7% for the brain hemorrhages). In the case of conflicting interpretations, a third stroke physician checked the scan and made the final determination.
Risk factor measurements
Details of the risk factor measurements and measurement equipment have been described previously. 29 Each participant answered a self‐administered questionnaire that included medical treatment (medications for hypertension, diabetes mellitus, and dyslipidemia), medical history, educational status, smoking habits, alcohol intake, and regular exercise. We defined low education as ≤9 years of formal education. We classified smoking habits and alcohol intake as either current habitual or not. Regular exercise was defined as engaging in any form of physical exercise three or more times a week during leisure time. Blood pressure was obtained three times using an automated sphygmomanometer after more than 5 min rest in the sitting position, and we used the mean of three measurements for the analysis. Hypertension was defined as blood pressure levels ≥140/90 mmHg and/or current use of antihypertensive medication. Plasma glucose levels were determined by the hexokinase method. Diabetes mellitus was defined as follows: fasting glucose level ≥7.0 mmol/L, casual or 2‐h postload glucose levels ≥11.1 mmol/L and/or use of antidiabetic medications. Serum total cholesterol levels were determined enzymatically. Body mass index (BMI) was calculated with body weight and height, which were measured in light clothing without shoes. Electrocardiogram abnormalities were defined by ST depression (Minnesota Code. 4–1, 2, 3), left ventricular hypertrophy (3–1), or atrial fibrillation (8–3).
Statistical analysis
The WMLV/ICV levels were natural log‐transformed when used as a continuous variable because their distribution was skewed. Descriptive statistics of study participants were computed overall and according to the quartiles of WMLV/ICV levels, where the mean values and frequencies of risk factors across the quartiles were adjusted for age and sex. Trends in the age‐ and sex‐adjusted mean values and frequencies of risk factors across the quartiles of WMLV/ICV levels were tested by using a linear and logistic regression analysis, respectively. A Cox proportional hazards model was used to estimate the hazard ratios (HRs) and their 95% confidence intervals (CIs) for the quartiles of WMLV/ICV or per 1 standard deviation (SD) increment of log‐transformed WMLV/ICV for the development of dementia and its subtypes. We evaluated two different models: (1) model 1, adjusted for age and sex; and (2) model 2, adjusted for age, sex, education status, systolic blood pressure, antihypertensive medications, diabetes mellitus, serum total cholesterol, BMI, electrocardiogram abnormalities, cerebrovascular lesions on MRI, smoking habits, alcohol intake, and regular exercise. The linear trends in the risk of dementia across each quartile of WMLV/ICV were tested by assigning an ordinal number (i.e., 1, 2, 3, or 4) to each quartile. In addition, we used the restricted cubic splines to visually inspect the shape of the associations, with four knots placed at the 5th, 35th, 65th, and 95th percentiles of the WMLV/ICV ratio (0.02%, 0.13%, 0.38%, and 1.52%), where the 12.5th percentile for WMLV/ICV ratio (0.04%) was set as the reference value.
In the analysis assessing the combined influence of WMLV/ICV levels and TBV/ICV levels on the risk of the development of all‐cause dementia and its subtype, WMLV/ICV levels and TBV/ICV levels were categorized with their median values, which were 0.23% for WMLV/ICV and 78.43% for TBV/ICV. Moreover, we previously reported that decreased levels of regional GMV/TBV of the hippocampus, medial temporal lobe, amygdala. and insula were significantly associated with the 5‐year risk of incident dementia. 18 On the basis of our previous findings, these four brain regions were selected as dementia‐related brain regions, and brain atrophy in each of them was defined as a GMV/TBV value below the cut‐off value for that specific region. These four cut‐offs were determined by the estimated maximum likelihood point on the receiver operating characteristic curve for the association between the GMV/TBV of each brain region and the 5‐year risk of incident dementia as follows: ≤1.08% for the insula, ≤0.82% for the median temporal lobes, ≤0.80% for the hippocampus, and ≤0.22% for the amygdala. 18 Based on these cut‐off values, we then calculated the accumulated number of dementia‐related brain regions with atrophy. Since we previously reported that the risk of dementia increased significantly in patients with atrophy in two or more of these dementia‐related brain regions, 18 we here defined higher or lower accumulation of dementia‐related brain region atrophy as ≥2 regions or <2 regions with atrophy. The heterogeneity in the association of WMLV/ICV levels with the risk of dementia between the subgroups and the interaction of the association of WMLV/ICV levels and TBV/ICV levels or the number of atrophied dementia‐related brain regions and the risk of dementia were assessed by adding a multiplicative interaction term in the relevant statistical model. As a sensitivity analysis, we excluded participants with cognitive decline defined as an MMSE score < 24, 30 those who had MCI at baseline, those who developed dementia within 1 year, and those with subcortical infarction on MRI at baseline. All statistical analyses were performed using SAS version 9.4 (SAS Institute, Cary, NC, USA). Two‐tailed P < 0.05 was considered significant in all analyses.
Results
Table 1 shows baseline characteristics of the study population overall and according to the quartiles of WMLV/ICV. The mean values of age, systolic blood pressure, and diastolic blood pressure, the frequency of antihypertensive medication use, electrocardiogram abnormalities, cerebrovascular lesions on MRI, and subcortical infarction on MRI all increased significantly with higher WMLV/ICV levels. In contrast, the mean value of total brain volume and frequency of female gender decreased significantly with higher WMLV/ICV levels.
Table 1.
Baseline characteristics of the total study population overall and according to quartiles of the white matter lesions volume‐to‐intracranial volume ratio, 2012–2013
| WMLV/ICV (%) | ||||||
|---|---|---|---|---|---|---|
| Risk factors | Total population (n = 1158) | Q1 (≤ 0.08) (n = 289) | Q2 (0.09–0.22) (n = 290) | Q3 (0.23–0.54) (n = 290) | Q4 (0.55–4.47) (n = 289) | p for trend |
| Age, years | 73.6 (6.2) | 69.8 (0.3) | 72.8 (0.3) | 75.1 (0.3) | 76.9 (0.3) | <0.001 |
| Female, % | 55.8 | 65.0 | 56.8 | 52.0 | 49.3 | <0.001 |
| Education ≤9 years, % | 35.5 | 35.5 | 30.1 | 36.8 | 37.6 | 0.32 |
| Systolic blood pressure, mmHg | 134.0 (18.4) | 132.5 (1.1) | 133.0 (1.1) | 132.4 (1.1) | 138.1 (1.1) | <0.001 |
| Diastolic blood pressure, mmHg | 76.4 (10.9) | 75.0 (0.7) | 76.1 (0.6) | 76.1 (0.6) | 78.5 (0.7) | <0.001 |
| Antihypertensive medication, % | 54.9 | 45.7 | 54.4 | 54.0 | 66.8 | <0.001 |
| Hypertension, % | 69.7 | 63.9 | 69.0 | 68.2 | 80.7 | <0.001 |
| Diabetes mellitus, % | 23.6 | 20.1 | 22.0 | 22.8 | 26.6 | 0.14 |
| Serum total cholesterol, mmol/L | 5.1 (0.9) | 5.2 (0.1) | 5.2 (0.1) | 5.1 (0.1) | 5.1 (0.1) | 0.23 |
| Body mass index, kg/m2 | 23.2 (3.3) | 22.9 (0.2) | 23.4 (0.2) | 23.1 (0.2) | 23.3 (0.2) | 0.32 |
| Electrocardiogram abnormalities, % | 16.3 | 13.3 | 11.7 | 16.1 | 20.8 | 0.01 |
| Cerebrovascular lesions on MRI, % | 34.7 | 17.7 | 24.9 | 35.6 | 58.1 | <0.001 |
| Subcortical infarction, % | 5.1 | 1.1 | 3.0 | 4.4 | 10.3 | <0.001 |
| Smoking habits, % | 8.9 | 5.8 | 6.3 | 5.0 | 6.3 | 0.99 |
| Alcohol intake, % | 42.9 | 41.3 | 42.5 | 42.3 | 40.1 | 0.94 |
| Regular exercise, % | 20.4 | 20.7 | 21.5 | 21.4 | 17.5 | 0.40 |
| Total brain volume/ICV, % | 78.3 (2.2) | 78.9 (0.1) | 78.3 (0.1) | 78.1 (0.1) | 77.7 (0.1) | <0.001 |
| MMSE <24, % | 5.7 | 6.4 | 4.2 | 4.4 | 7.1 | 0.59 |
| Mild cognitive impairment, % | 13.6 | 10.2 | 12.4 | 12.0 | 15.7 | 0.09 |
Note: Values are shown as unadjusted mean (standard deviation) or frequency for total population, and as age‐ and sex‐adjusted mean (standard error) or adjusted proportion for the quartiles. Age was adjusted for sex. Sex was adjusted for age.
Abbreviation: ICV, intracranial volume; MMSE, Mini–Mental Statement Examination; MRI, magnetic resonance imaging; WMLV, white matter lesions volume.
During the median follow‐up period of 5.0 years (interquartile range: 4.9–5.1 years), 113 participants (47 men and 66 women) developed all‐cause dementia. All participants with dementia were evaluated by brain imaging and 12 participants with dementia also underwent a brain autopsy. Regarding the subtypes of dementia, one participant had a mixed type of AD and VaD, and this case was counted as an event in the analysis for each subtype because we could not identify which subtype was clinically predominant on the development of dementia. In all, 83 participants developed AD, 14 participants developed VaD, and 17 participants developed other subtypes of dementia. Other subtypes of dementia included the following subtypes: five cases of dementia with Lewy bodies, one case of frontotemporal lobar degeneration, one case of senile dementia of the neurofibrillary tangle type (SD‐NFT), one case of a mixed type of SD‐NFT and hypoxic ischemic encephalopathy, one case of alcohol‐induced dementia, and eight cases of unknown cause.
Table 2 and Table S1 show the estimated risks of all‐cause dementia and its subtypes according to WMLV/ICV levels. Age‐ and sex‐adjusted risk of all‐cause dementia increased significantly with higher WMLV/ICV levels (p for trend <0.001). These associations remained significant after adjustment for age, sex, education status, systolic blood pressure, use of antihypertensive medication, diabetes mellitus, serum total cholesterol, BMI, electrocardiogram abnormalities, cerebrovascular lesions on MRI, smoking habits, alcohol intake, and regular exercise (p for trend <0.001). Participants in the fourth quartile of WMLV/ICV had a 3.13‐fold higher risk of all‐cause dementia than those in the first quartile. Regarding the subtypes of dementia, the risks of AD and VaD increased significantly with higher WMLV/ICV levels even after multivariable adjustment (all p for trend <0.05). Figure 1 shows the shape of the association between WMLV/ICV levels and risk of all‐cause dementia based on restricted cubic spline analysis. The risk of all‐cause dementia increased approximately linearly with higher WMLV/ICV levels.
Table 2.
Adjusted hazard ratios of all‐cause dementia and Alzheimer's disease according to the white matter lesions volume‐to‐intracranial volume ratio
| Hazard ratio (95% CI) | ||||
|---|---|---|---|---|
| WMLV/ICV (%) | No. of subjects | No. of events | Model 1 † | Model 2 ‡ |
| All‐cause dementia | ||||
| Q1 (≤ 0.08) | 289 | 8 | 1.00 (Reference) | 1.00 (Reference) |
| Q2 (0.09–0.22) | 290 | 18 | 1.48 (0.63–3.46) | 1.36 (0.57–3.20) |
| Q3 (0.23–0.54) | 290 | 36 | 2.59 (1.16–5.79)* | 2.50 (1.11–5.61)* |
| Q4 (0.55–4.47) | 289 | 51 | 3.56 (1.62–7.85)* | 3.13 (1.39–7.01)* |
| p for trend <0.001 | p for trend <0.001 | |||
| Per 1 SD increment | 1.55 (1.21–1.99)* | 1.50 (1.15–1.96)* | ||
| Alzheimer's disease | ||||
| Q1 (≤ 0.08) | 289 | 7 | 1.00 (Reference) | 1.00 (Reference) |
| Q2 (0.09–0.22) | 290 | 12 | 1.08 (0.42–2.80) | 0.95 (0.36–2.51) |
| Q3 (0.23–0.54) | 290 | 30 | 2.34 (0.98–5.58) | 2.21 (0.92–5.31) |
| Q4 (0.55–4.47) | 289 | 34 | 2.56 (1.07–6.10)* | 2.30 (0.94–5.59) |
| p for trend = 0.004 | p for trend = 0.01 | |||
| Per 1 SD increment | 1.40 (1.05–1.86)* | 1.38(1.02–1.87)* | ||
Abbreviation: CI, confidence interval; ICV, intracranial volume; SD, standard deviation; WMLV, white matter lesions volume.
Note: For the association with vascular dementia, quartile 1 and quartile 2 were combined as a reference due to the small number of event cases.
P < 0.05.
Model 1: adjusted for age and sex.
Model 2: adjusted for age, sex, education status, systolic blood pressure, antihypertensive medication, diabetes mellitus, serum total cholesterol, body mass index, electrocardiogram abnormalities, cerebrovascular lesions on magnetic resonance imaging, smoking habits, alcohol intake, and regular exercise.
Fig. 1.
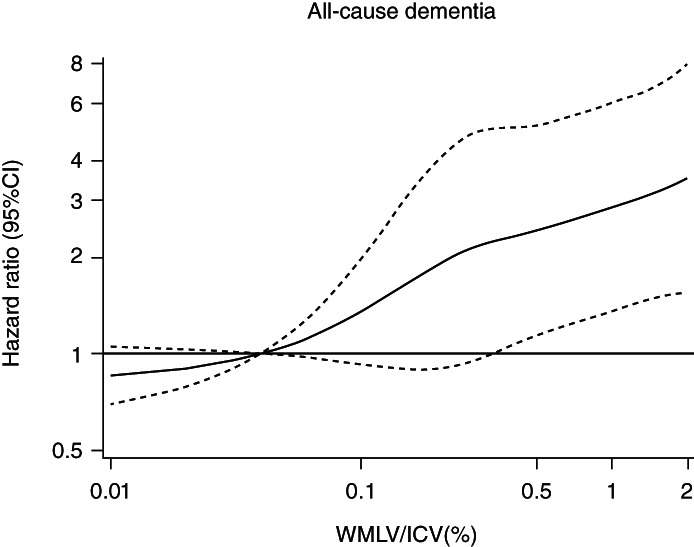
Restricted cubic spline for the association between white matter lesions to intracranial volume ratio and risk of all‐cause dementia. WMLV, white matter lesions volume; ICV, intracranial volume; CI, confidence interval. The risk estimates were adjusted for age, sex, education status, systolic blood pressure, use of antihypertensive medication, diabetes mellitus, serum total cholesterol, body mass index, electrocardiogram abnormalities, cerebrovascular lesions on MRI, smoking habits, alcohol intake, and regular exercise.
In the subgroup analyses by each covariate, there was no heterogeneity of the association between WMLV/ICV levels and risk of all‐cause dementia (all p for heterogeneity ≥0.06) except for sex: the magnitude of the association was significantly stronger in females than males (p for heterogeneity = 0.01, Table S2). We also conducted the sensitivity analyses after excluding participants with an MMSE score of <24, those with MCI, those who developed dementia over the 1‐year follow‐up period, or those who had a subcortical infarction, and the results were substantially unchanged (Fig. S1).
Figure 2a shows the multivariable‐adjusted risk of all‐cause dementia according to the combination of WMLV/ICV levels and TBV/ICV levels. Baseline characteristics of the study population for each category of WMLV/ICV levels and TBV/ICV levels are shown in Table S3. Compared with participants with WMLV/ICV <0.23% and TBV/ICV >78.43%, the multivariable‐adjusted risk of all‐cause dementia was significantly higher in those with WMLV/ICV ≥0.23% and TBV/ICV >78.43% (HR = 2.29, 95% CI 1.03–5.10). In addition, although the risk of all‐cause dementia increased somewhat, but not significantly, in participants with WMLV/ICV <0.23% and TBV/ICV ≤ 78.43% (HR = 1.62, 95% CI 0.70–3.77), those with WMLV/ICV ≥0.23% and TBV/ICV ≤ 78.43% had a 3.45‐fold higher risk of all‐cause dementia. There was no multiplicative interaction of the association between WMLV/ICV levels and total brain atrophy on the risk of dementia (p for interaction = 0.88). Likewise, regarding the association with WMLV/ICV levels and number of dementia‐related brain regions with atrophy (Fig. 2b), the risk of all‐cause dementia was significantly higher in participants with higher WMLV/ICV and <2 dementia‐related brain regions with atrophy (HR = 2.64, 95% CI 1.20–5.81) than in those with lower WMLV/ICV and <2 dementia‐related brain regions with atrophy. Furthermore, the risks of all‐cause dementia increased significantly in participants with ≥2 dementia‐related brain regions with atrophy regardless of WMLV/ICV levels, and an additive increased risk of all‐cause dementia was observed in those with higher WMLV/ICV and ≥2 dementia‐related brain regions with atrophy (HR = 5.88, 95% CI 2.81–12.29). No multiplicative interaction of the association between WMLV/ICV levels and the number of dementia‐related brain regions with atrophy on the risk of dementia was observed (p for interaction = 0.35). In the sensitivity analyses, the observed associations were substantially unchanged after excluding participants with MCI at baseline (Fig. S2). With respect to subtypes of dementia, similar associations were found for AD, but not for VaD (Table 3, Table S4). We also examined the association between WMLV/ICV levels and each dementia‐related brain region with atrophy and the risk of all‐cause dementia (Fig. S3) and its subtypes (Table S5) and found that all of the four dementia‐related brain regions showed significant associations similar to the association of WMLV/ICV levels and total brain atrophy with the risk of dementia.
Fig. 2.

Multivariable‐adjusted risk of all‐cause dementia for white matter lesions volume levels combined with total brain volume levels (a) or total number of dementia‐related brain regions with atrophy (b). WMLV, white matter lesions volume; ICV, intracranial volume; TBV; total brain volume; CI, confidence interval. The risk estimates were adjusted for age, sex, education status, systolic blood pressure, antihypertensive medication, diabetes mellitus, serum total cholesterol, body mass index, electrocardiogram abnormalities, cerebrovascular lesions on MRI, smoking habits, alcohol intake, and regular exercise. *P < 0.05 vs. with lower WMLV/ICV and higher total brain volume (TBV/ICV) or <2 dementia‐related brain regions with atrophy. **P < 0.001 vs. with lower WMLV/ICV and higher total brain volume (TBV/ICV) or <2 dementia‐related brain regions with atrophy.
Table 3.
Multivariable‐adjusted risk of Alzheimer's disease for white matter lesions volume levels combined with total brain volume levels or total number of dementia‐related brain regions with atrophy
| No. of subjects | Alzheimer's disease | ||
|---|---|---|---|
| No. of events | Hazard ratio (95% CI) | ||
| Combined with TBV levels | |||
| WMLV/ICV <0.23% and TBV/ICV >78.43% | 374 | 9 | 1.00 (Reference) |
| WMLV/ICV ≥0.23% and TBV/ICV >78.43% | 205 | 13 | 1.98 (0.79–4.95) |
| WMLV/ICV <0.23% and TBV/ICV ≤ 78.43% | 205 | 10 | 1.31 (0.49–3.49) |
| WMLV/ICV ≥0.23% and TBV/ICV ≤ 78.43% | 374 | 51 | 3.14 (1.35–7.31)* |
| Combined with total number of dementia‐related brain regions with atrophy | |||
| WMLV/ICV <0.23% and <2 dementia‐related brain regions with atrophy | 411 | 6 | 1.00 (Reference) |
| WMLV/ICV ≥0.23% and <2 dementia‐related brain regions with atrophy | 277 | 19 | 2.97 (1.15–7.69)* |
| WMLV/ICV <0.23% and ≥2 dementia‐related brain regions with atrophy | 168 | 13 | 3.91 (1.44–10.61)* |
| WMLV/ICV ≥0.23% and ≥2 dementia‐related brain regions with atrophy | 302 | 45 | 6.44 (2.63–15.74)** |
Abbreviation: CI, confidence interval; ICV, intracranial volume; TBV, total brain volume; WMLV, white matter lesions volume.
Note: For the association with vascular dementia, lower WMLV and <2 dementia‐related brain regions with atrophy and higher WMLV and <2 dementia‐related brain regions with atrophy were combined as a reference due to the small number of event cases. Adjusted for age, sex, education status, systolic blood pressure, antihypertensive medication, diabetes mellitus, serum total cholesterol, body mass index, electrocardiogram abnormalities, cerebrovascular lesions on MRI, smoking habits, alcohol intake, and regular exercise.
P < 0.05;
P < 0.001.
Discussion
The present study showed that higher levels of WMLV/ICV were significantly associated with an increased risk of developing dementia and its subtypes based on the 5‐year prospective data from a community‐dwelling older Japanese population. In addition, participants with higher WMLV/ICV and lower TBV/ICV had an additive increased risk of dementia over those with lower WMLV/ICV and higher TBV/ICV. A similar additive association with the risk of dementia was found for higher WMLV/ICV levels and a higher number of dementia‐related brain regions with atrophy. As far as we know, there has been no community‐based study addressing the influence of WMLV/ICV levels on the association between brain atrophy and dementia risk. The present findings indicate that higher WMLV/ICV levels are an independent risk factor for dementia and have an additive increased influence on the risk of dementia over that conferred by brain atrophy.
This study showed that higher levels of WMLV/ICV measured quantitatively were significantly associated with an increased risk of developing dementia, AD, and VaD. Several population‐based prospective studies have assessed this issue: the Framingham Offspring Study, 6 the Rotterdam Study, 7 the Three‐city Study, 8 and the Atherosclerosis Risk in Communities Study 9 reported a significant association between higher WMLV/ICV levels measured quantitatively and increased risk of dementia. With regard to dementia subtypes, only the Cardiovascular Health Study reported a significant association between higher WMLV/ICV levels by a semi‐quantitative scale and risk of VaD. 10 Meanwhile, the Cardiovascular Health Study 10 and the Rotterdam Study 11 showed a significant association between higher semi‐quantitative or quantitative WMLV levels and increased risk of AD, but the Framingham Offspring Study 12 and the Osaki‐Tajiri Study 13 did not. These differences may be attributed to differences in study design, especially in the number of study participants. In addition, the present study revealed that the risk of dementia and AD increased additively in participants with a higher volume of white matter lesions and brain atrophy of the total brain or dementia‐related brain regions. This may have been due to the independent influence of cerebral small vessel diseases on the association between brain atrophy and risk of dementia. The Nun Study 31 and the Religious Orders Study 32 reported that cerebral infarction, including microinfarction, commonly coexist with AD pathology in autopsy brains with and without dementia, and that these vascular diseases independently increase the risk of dementia without interacting with AD pathology. In addition, a meta‐analysis of clinicopathological data from population‐based cohort studies reported that participants with neurodegeneration and vascular lesions, including white matter lesions, had a significant, nearly two‐fold higher risk of developing dementia compared to those with neurodegeneration and no evidence of any vascular lesions. 33 Our findings, together with these previous studies, may support the idea that white matter lesions have an additional influence on the association between brain atrophy and the risk of dementia and highlight the potential importance of preventing the accumulation of white matter lesions for the risk reduction of developing dementia regardless of its subtypes.
The exact mechanism of the excess risk of dementia and AD in participants with increased white matter lesions, especially those with concomitant brain atrophy, is unclear, but possible mechanisms should be discussed. One possible mechanism is that white matter lesions are considered as one of the cerebral small vessel diseases and cause the low cerebral perfusion and dysfunction of the blood–brain barrier and neurovascular unit. 34 , 35 Impaired cerebral perfusion due to cerebral small vessel diseases may induce oxidative stress, and dysfunction of the blood–brain barrier and neurovascular unit may result in increasing neuroinflammation, all of which may accelerate brain aging via microvascular injury and neurodegeneration. 34 , 35 Another possible mechanism is that white matter lesions may be a marker of accumulation of vascular risk factors such as hypertension, diabetes mellitus, and smoking, which could cause accumulated subclinical brain injury and brain atrophy, and thereby increased risk of dementia. 4 , 5 , 36 , 37 In the present study, moreover, participants with higher WMLV/ICV levels and lower TBV/ICV levels had higher cumulative cardiovascular risk factors than those with lower WMLV/ICV and higher TBV/ICV levels (Table S3). Taken together, these potential mechanisms suggest that the excess risk of dementia in participants with increased white matter lesions, especially those with brain atrophy, may reflect the underlying comorbidities of cerebral diseases resulting from the accumulation of cardiovascular risk factors. In addition, white matter lesions may be attributable to a disruption of subcortical neural networks via loss of myelin and axons, which could affect the dysfunction of the subcortical network and lead to cognitive decline and development of dementia. 38 , 39 , 40 Clinical studies reported that the structural network efficiency was impaired in patients with cerebral vascular diseases, 41 and the degree of impairment was significantly associated with the development of cognitive decline and dementia. 42 Synaptic dysfunction due to subcortical neural networks caused by white matter lesions may contribute to an additive increase in the risk of dementia due to brain atrophy, 38 , 39 , 40 which may reflect the neuronal and cortical network dysfunction in gray matter. 43 , 44 Furthermore, white matter lesions may directly promote brain atrophy. The Austrian Stroke Prevention Study reported that participants with normal cognition and higher WMLV showed significantly lower TBV than those without WMLV after 6 years of follow‐up, 45 and the Alzheimer's Disease Neuroimaging Initiative Study also reported that white matter lesions accelerated hippocampus atrophy even after adjustment for amyloid β and total tau in the cerebrospinal fluid after 3 years of follow‐up of cognitively normal participants. 46 Further basic and clinical studies are needed to elucidate this issue.
The strengths of our study are the community‐based prospective cohort study design, the large sample size of MRI examinations, the accurate and consistent methods of detection and diagnosis of dementia, the perfect follow‐up rate, and the detailed assessment of known risk factors. However, several limitations should be noted. First, there was a possibility of selection bias caused by excluding individuals without MRI data. However, the participants with brain MRI imaging were significantly younger and had significantly higher scores of the MMSE and the Barthel index than those without MRI data (data not shown). Since older individuals with impaired activities of daily living have been reported to have high WMLV/ICV levels, 47 the excluded participants were thought to have higher levels of WMLV/ICV and were at a high risk of dementia, potentially weakening the association between WMLV/ICV levels and dementia. Second, since WMLV was measured automatically, cerebral infarct lesions were not completely excluded, which could have affected the association between WMLV and risk of dementia. However, the inter‐rater concordance of WMLV measured by LST and second independent stroke neurologists was high (inter‐class correlation coefficient = 0.75), 29 and a sensitivity analysis excluding participants with subcortical infarcts, which might have an influence on WMLV, did not change the result (Fig. S1). Third, participants in the prodromal stage of dementia could be more likely to be included in those with higher WMLV/ICV levels at baseline. However, our sensitivity analyses excluding participants with MCI at baseline, those with an MMSE score of <24, or those who developed dementia within 1 year of follow‐up, did not change the present findings (Fig. S1 and S2). Fourth, we could not assess the detailed association of WMLV/ICV levels with the risk of other subtypes of dementia due to the small number of cases. Fifth, the diagnostic accuracy of dementia subtypes, especially AD, may be limited. Although we were unable to perform cerebral blood flow SPECT or measurement of amyloid‐β and phosphorylated tau protein in cerebrospinal fluid by lumbar puncture, we fully observed the clinical symptoms and course of the participants after the completion of this study and confirmed that our initial diagnosis was consistent in all cases. Sixth, the generalizability of the present findings to other ethnicities may be limited, because our study population consisted of residents of a single town in Japan. Finally, potential residual confounding factors, such as sleep apnea 48 and traumatic head injury, 49 were not evaluated.
In conclusion, the present study showed that increased WMLV was significantly associated with an increased risk of dementia in a general older population. Furthermore, the risk of dementia increased additively in participants with higher WMLV and lower TBV or a higher number of dementia‐related brain regions with atrophy. Since successful use of pharmaceuticals and/or lifestyle modification has been shown to prevent or delay the progression of white matter lesions, 36 , 50 our findings may indicate that prevention or control of cardiovascular risk factors could contribute to a reduction in the risk of developing dementia due to white matter lesions. Further basic and clinical studies are warranted to validate the findings of this study.
Author contributions
T Nakazawa and T Ninomiya contributed to the study conception and study design; T Nakazawa, TO, TH and T Ninomiya contributed to the data analysis; T Nakazawa, TO, NH, YF, JH, MS, and T Ninomiya contributed to the data collection; T Nakazawa, TO, NH, YF, JH, MS, TH, TK, T Nakao, and T Ninomiya contributed to the data interpretation. T Nakazawa wrote the first draft of the manuscript and all authors contributed to critical revision of the manuscript.
Funding information
This study was supported in part by the Ministry of Education, Culture, Sports, Science and Technology of Japan (JSPS KAKENHI Grant Number JP21H03200, JP19K07890, JP20K10503, JP20K11020, JP21K07522, JP21K11725, JP21K10448, JP22K07421, and JP22K17396); by the Health and Labour Sciences Research Grants of the Ministry of Health, Labour and Welfare of Japan (JPMH20FA1002); and by the Japan Agency for Medical Research and Development (JP22dk0207053).
Conflict of interest
Every author declares he/she has no competing interests.
Supporting information
Figure S1. Sensitivity analyses for the association between white matter lesions to intracranial volume ratio and the risk of all‐cause dementia, Alzheimer's disease, and vascular dementia after excluding those with Mini‐Mental Statement Examination scores of less than 24 points at baseline, those with mild cognitive impairment at baseline, those who developed dementia within the 1‐year follow‐up period, or those with subcortical infarction at baseline.
Figure S2. Multivariable‐adjusted risk of all‐cause dementia for white matter lesions volume levels combined with total brain volume levels (A) or total number of dementia‐related brain regions with atrophy (B) after excluding those with mild cognitive impairment at baseline.
Figure S3. Multivariable‐adjusted risk of all‐cause dementia for white matter lesions volume levels combined with each dementia‐related brain region with atrophy.
Table S1. Adjusted hazard ratios of vascular dementia according to the white matter lesions volume‐to‐intracranial volume ratio.
Table S2. Multivariable‐adjusted hazard ratios (95% confidence intervals) of all‐cause dementia according to a 1‐SD increment in the log‐transformed white matter lesions volume‐to‐intracranial volume ratio (%) levels by presence or absence of each potential risk factor.
Table S3. Baseline characteristics of potential risk factors for dementia according to low or high white matter lesions volume‐to‐intracranial volume ratio levels by total brain volume‐to‐intracranial volume ratio levels, 2012–2013.
Table S4. Multivariable‐adjusted risk of vascular dementia for white matter lesions volume levels combined with total brain volume levels or total number of dementia‐related brain regions with atrophy.
Table S5. Multivariable‐adjusted risk of dementia subtypes for white matter lesions volume levels combined with brain atrophy status in each dementia‐related brain region.
Acknowledgments
We thank the staff members of the Division of Health of Hisayama for their cooperation in this study. We would like to gratefully and sincerely thank Professor Yoshinao Oda, Emeritus Professor Toru Iwaki, and their colleagues at the Department of Anatomic Pathology and Department of Neuropathology, Graduate School of Medical Sciences, Kyushu University, who provided expertise and insight into the autopsy findings that greatly assisted our research. We also thank Associate Professor Fumio Yamashita at the Division of Ultrahigh Field MRI, Institute for Biomedical Sciences, Iwate Medical University, who provided advice on the MRI analysis. The statistical analyses were carried out using the computer resources offered under the category of General Projects by the Research Institute for Information Technology, Kyushu University.
Data availability statement
The dataset which we used in the present study is not publicly available, because it contains personal clinical data of the study participants. However, the data are available on reasonable request and with the permission of the principal investigator of the Hisayama Study, Toshiharu Ninomiya (Department of Epidemiology and Public Health, Graduate School of Medical Sciences, Kyushu University, Fukuoka, Japan).
References
- 1. Pantoni L. Cerebral small vessel disease: From pathogenesis and clinical characteristics to therapeutic challenges. Lancet Neurol. 2010; 9: 689–701. [DOI] [PubMed] [Google Scholar]
- 2. Bos D, Wolters FJ, Darweesh SKL et al. Cerebral small vessel disease and the risk of dementia: A systematic review and meta‐analysis of population‐based evidence. Alzheimers Dement. 2018; 14: 1482–1492. [DOI] [PubMed] [Google Scholar]
- 3. Scheltens P, Barkhof F, Valk J et al. White matter lesions on magnetic resonance imaging in clinically diagnosed Alzheimer's disease. Evidence for heterogeneity. Brain 1992; 115: 735–748. [DOI] [PubMed] [Google Scholar]
- 4. Cox SR, Lyall DM, Ritchie SJ et al. Associations between vascular risk factors and brain MRI indices in UK biobank. Eur. Heart J. 2019; 40: 2290–2300. [DOI] [PMC free article] [PubMed] [Google Scholar]
- 5. Gottesman RF, Albert MS, Alonso A et al. Associations between midlife vascular risk factors and 25‐year incident dementia in the atherosclerosis risk in communities (ARIC) cohort. JAMA Neurol. 2017; 74: 1246–1254. [DOI] [PMC free article] [PubMed] [Google Scholar]
- 6. Debette S, Beiser A, DeCarli C et al. Association of MRI markers of vascular brain injury with incident stroke, mild cognitive impairment, dementia, and mortality: The Framingham offspring study. Stroke 2010; 41: 600–606. [DOI] [PMC free article] [PubMed] [Google Scholar]
- 7. Ikram MA, Vrooman HA, Vernooij MW et al. Brain tissue volumes in relation to cognitive function and risk of dementia. Neurobiol. Aging 2010; 31: 378–386. [DOI] [PubMed] [Google Scholar]
- 8. Kaffashian S, Soumaré A, Zhu YC, Mazoyer B, Debette S, Tzourio C. Long‐term clinical impact of vascular brain lesions on magnetic resonance imaging in older adults in the population. Stroke 2016; 47: 2865–2869. [DOI] [PubMed] [Google Scholar]
- 9. Wu A, Sharrett AR, Gottesman RF et al. Association of brain magnetic resonance imaging signs with cognitive outcomes in persons with nonimpaired cognition and mild cognitive impairment. JAMA Netw. Open 2019; 2: e193359. [DOI] [PMC free article] [PubMed] [Google Scholar]
- 10. Kuller LH, Lopez OL, Newman A et al. Risk factors for dementia in the cardiovascular health cognition study. Neuroepidemiology 2003; 22: 13–22. [DOI] [PubMed] [Google Scholar]
- 11. Prins ND, van Dijk EJ, den Heijer T et al. Cerebral white matter lesions and the risk of dementia. Arch. Neurol. 2004; 61: 1531–1534. [DOI] [PubMed] [Google Scholar]
- 12. Weinstein G, Wolf PA, Beiser AS, Au R, Seshadri S. Risk estimations, risk factors, and genetic variants associated with Alzheimer's disease in selected publications from the Framingham heart study. J. Alzheimers Dis. 2013; 33: S439–S445. [DOI] [PMC free article] [PubMed] [Google Scholar]
- 13. Meguro K, Ishii H, Kasuya M et al. Incidence of dementia and associated risk factors in Japan: The Osaki‐Tajiri project. J. Neurol. Sci. 2007; 260: 175–182. [DOI] [PubMed] [Google Scholar]
- 14. Frisoni GB, Fox NC, Jack CR Jr, Scheltens P, Thompson PM. The clinical use of structural MRI in Alzheimer disease. Nat. Rev. Neurol. 2010; 6: 67–77. [DOI] [PMC free article] [PubMed] [Google Scholar]
- 15. den Heijer T, Geerlings MI, Hoebeek FE, Hofman A, Koudstaal PJ, Breteler MM. Use of hippocampal and amygdalar volumes on magnetic resonance imaging to predict dementia in cognitively intact elderly people. Arch. Gen. Psychiatry 2006; 63: 57–62. [DOI] [PubMed] [Google Scholar]
- 16. den Heijer T, van der Lijn F, Koudstaal PJ et al. A 10‐year follow‐up of hippocampal volume on magnetic resonance imaging in early dementia and cognitive decline. Brain 2010; 133: 1163–1172. [DOI] [PubMed] [Google Scholar]
- 17. Bernard C, Helmer C, Dilharreguy B et al. Time course of brain volume changes in the preclinical phase of Alzheimer's disease. Alzheimers Dement. 2014; 10: 143–151.e1. [DOI] [PubMed] [Google Scholar]
- 18. Nakazawa T, Ohara T, Hirabayashi N et al. Multiple‐region grey matter atrophy as a predictor for the development of dementia in a community: The Hisayama study. J. Neurol. Neurosurg. Psychiatry 2022; 93: 263–271. [DOI] [PMC free article] [PubMed] [Google Scholar]
- 19. Brickman AM, Honig LS, Scarmeas N et al. Measuring cerebral atrophy and white matter hyperintensity burden to predict the rate of cognitive decline in Alzheimer disease. Arch. Neurol. 2008; 65: 1202–1208. [DOI] [PMC free article] [PubMed] [Google Scholar]
- 20. van der Flier WM, van Straaten EC, Barkhof F et al. Medial temporal lobe atrophy and white matter hyperintensities are associated with mild cognitive deficits in non‐disabled elderly people: The LADIS study. J. Neurol. Neurosurg. Psychiatry 2005; 76: 1497–1500. [DOI] [PMC free article] [PubMed] [Google Scholar]
- 21. Ohara T, Hata J, Yoshida D et al. Trends in dementia prevalence, incidence, and survival rate in a Japanese community. Neurology 2017; 88: 1925–1932. [DOI] [PubMed] [Google Scholar]
- 22. Ohara T, Yoshida D, Hata J et al. Current status of the certification of long‐term care insurance among individuals with dementia in a Japanese community: The Hisayama study. Psychiatry Clin. Neurosci. 2021; 75: 182–184. [DOI] [PMC free article] [PubMed] [Google Scholar]
- 23. Folstein MF, Folstein SE, McHugh PR. “Mini‐mental state”. A practical method for grading the cognitive state of patients for the clinician. J. Psychiatr. Res. 1975; 12: 189–198. [DOI] [PubMed] [Google Scholar]
- 24. Wechsler D. Manual for the Wechsler Memory Scale‐Revised. The Psychological Corporation, San Antonio, 1987. [Google Scholar]
- 25. American Psychiatric Association . Diagnostic and Statistical Manual of Mental Disorders, 3rd edn. American Psychiatric Association, Washington, DC, 1987. [Google Scholar]
- 26. Petersen RC, Doody R, Kurz A et al. Current concepts in mild cognitive impairment. Arch. Neurol. 2001; 58: 1985–1992. [DOI] [PubMed] [Google Scholar]
- 27. McKhann G, Drachman D, Folstein M, Katzman R, Price D, Stadlan EM. Clinical diagnosis of Alzheimer's disease: Report of the NINCDS‐ADRDA work group under the auspices of Department of Health and Human Services Task Force on Alzheimer's disease. Neurology 1984; 34: 939–944. [DOI] [PubMed] [Google Scholar]
- 28. Román GC, Tatemichi TK, Erkinjuntti T et al. Vascular dementia: Diagnostic criteria for research studies. Report of the NINDS‐AIREN international workshop. Neurology 1993; 43: 250–260. [DOI] [PubMed] [Google Scholar]
- 29. Yamasaki K, Hata J, Furuta Y et al. Association of albuminuria with white matter hyperintensities volume on brain magnetic resonance imaging in elderly Japanese—the Hisayama Study. Circ J. 2020; 84: 935–942. [DOI] [PubMed] [Google Scholar]
- 30. Tsoi KK, Chan JY, Hirai HW, Wong SY, Kwok TC. Cognitive tests to detect dementia: A systematic review and meta‐analysis. JAMA Intern. Med. 2015; 175: 1450–1458. [DOI] [PubMed] [Google Scholar]
- 31. Snowdon DA, Greiner LH, Mortimer JA, Riley KP, Greiner PA, Markesbery WR. Brain infarction and the clinical expression of Alzheimer disease. The Nun Study. JAMA 1997; 277: 813–817. [PubMed] [Google Scholar]
- 32. Arvanitakis Z, Leurgans SE, Barnes LL, Bennett DA, Schneider JA. Microinfarct pathology, dementia, and cognitive systems. Stroke 2011; 42: 722–727. [DOI] [PMC free article] [PubMed] [Google Scholar]
- 33. Azarpazhooh MR, Avan A, Cipriano LE, Munoz DG, Sposato LA, Hachinski V. Concomitant vascular and neurodegenerative pathologies double the risk of dementia. Alzheimers Dement. 2018; 14: 148–156. [DOI] [PubMed] [Google Scholar]
- 34. Tarasoff‐Conway JM, Carare RO, Osorio RS et al. Clearance systems in the brain‐implications for Alzheimer disease. Nat. Rev. Neurol. 2015; 11: 457–470. [DOI] [PMC free article] [PubMed] [Google Scholar]
- 35. Hachinski V, Einhäupl K, Ganten D et al. Preventing dementia by preventing stroke: The Berlin manifesto. Alzheimers Dement. 2019; 15: 961–984. [DOI] [PMC free article] [PubMed] [Google Scholar]
- 36. Ungvari Z, Toth P, Tarantini S et al. Hypertension‐induced cognitive impairment: From pathophysiology to public health. Nat. Rev. Nephrol. 2021; 17: 639–654. [DOI] [PMC free article] [PubMed] [Google Scholar]
- 37. Pase MP, Davis‐Plourde K, Himali JJ et al. Vascular risk at younger ages most strongly associates with current and future brain volume. Neurology 2018; 91: e1479–e1486. [DOI] [PMC free article] [PubMed] [Google Scholar]
- 38. Grips E, Sedlaczek O, Bäzner H, Fritzinger M, Daffertshofer M, Hennerici M. Supratentorial age‐related white matter changes predict outcome in cerebellar stroke. Stroke 2005; 36: 1988–1993. [DOI] [PubMed] [Google Scholar]
- 39. Nordahl CW, Ranganath C, Yonelinas AP, Decarli C, Fletcher E, Jagust WJ. White matter changes compromise prefrontal cortex function in healthy elderly individuals. J. Cogn. Neurosci. 2006; 18: 418–429. [DOI] [PMC free article] [PubMed] [Google Scholar]
- 40. Reijmer YD, Leemans A, Caeyenberghs K et al. Disruption of cerebral networks and cognitive impairment in Alzheimer disease. Neurology 2013; 80: 1370–1377. [DOI] [PubMed] [Google Scholar]
- 41. Lawrence AJ, Chung AW, Morris RG, Markus HS, Barrick TR. Structural network efficiency is associated with cognitive impairment in small‐vessel disease. Neurology 2014; 83: 304–311. [DOI] [PMC free article] [PubMed] [Google Scholar]
- 42. Tuladhar AM, van Uden IW, Rutten‐Jacobs LC et al. Structural network efficiency predicts conversion to dementia. Neurology 2016; 86: 1112–1119. [DOI] [PMC free article] [PubMed] [Google Scholar]
- 43. Bethlehem RAI, Seidlitz J, White SR et al. Brain charts for the human lifespan. Nature 2022; 604: 525–533. [DOI] [PMC free article] [PubMed] [Google Scholar]
- 44. Seeley WW, Crawford RK, Zhou J, Miller BL, Greicius MD. Neurodegenerative diseases target large‐scale human brain networks. Neuron 2009; 62: 42–52. [DOI] [PMC free article] [PubMed] [Google Scholar]
- 45. Enzinger C, Fazekas F, Matthews PM et al. Risk factors for progression of brain atrophy in aging: Six‐year follow‐up of normal subjects. Neurology 2005; 64: 1704–1711. [DOI] [PubMed] [Google Scholar]
- 46. Fiford CM, Manning EN, Bartlett JW et al. White matter hyperintensities are associated with disproportionate progressive hippocampal atrophy. Hippocampus 2017; 27: 249–262. [DOI] [PMC free article] [PubMed] [Google Scholar]
- 47. Pantoni L, Poggesi A, Basile AM et al. Leukoaraiosis predicts hidden global functioning impairment in nondisabled older people: The LADIS (Leukoaraiosis and disability in the elderly) study. J. Am. Geriatr. Soc. 2006; 54: 1095–1101. [DOI] [PubMed] [Google Scholar]
- 48. Dunietz GL, Chervin RD, Burke JF, Conceicao AS, Braley TJ. Obstructive sleep apnea treatment and dementia risk in older adults. Sleep 2021; 44: zsab076. [DOI] [PMC free article] [PubMed] [Google Scholar]
- 49. GBD 2019 Dementia Collaborators . The burden of dementia due to Down syndrome, Parkinson's disease, stroke, and traumatic brain injury: A systematic analysis for the Global Burden of Disease Study 2019. Neuroepidemiology 2021; 55: 286–296. [DOI] [PMC free article] [PubMed] [Google Scholar]
- 50. de Leeuw FE, de Groot JC, Oudkerk M et al. Hypertension and cerebral white matter lesions in a prospective cohort study. Brain 2002; 125: 765–772. [DOI] [PubMed] [Google Scholar]
Associated Data
This section collects any data citations, data availability statements, or supplementary materials included in this article.
Supplementary Materials
Figure S1. Sensitivity analyses for the association between white matter lesions to intracranial volume ratio and the risk of all‐cause dementia, Alzheimer's disease, and vascular dementia after excluding those with Mini‐Mental Statement Examination scores of less than 24 points at baseline, those with mild cognitive impairment at baseline, those who developed dementia within the 1‐year follow‐up period, or those with subcortical infarction at baseline.
Figure S2. Multivariable‐adjusted risk of all‐cause dementia for white matter lesions volume levels combined with total brain volume levels (A) or total number of dementia‐related brain regions with atrophy (B) after excluding those with mild cognitive impairment at baseline.
Figure S3. Multivariable‐adjusted risk of all‐cause dementia for white matter lesions volume levels combined with each dementia‐related brain region with atrophy.
Table S1. Adjusted hazard ratios of vascular dementia according to the white matter lesions volume‐to‐intracranial volume ratio.
Table S2. Multivariable‐adjusted hazard ratios (95% confidence intervals) of all‐cause dementia according to a 1‐SD increment in the log‐transformed white matter lesions volume‐to‐intracranial volume ratio (%) levels by presence or absence of each potential risk factor.
Table S3. Baseline characteristics of potential risk factors for dementia according to low or high white matter lesions volume‐to‐intracranial volume ratio levels by total brain volume‐to‐intracranial volume ratio levels, 2012–2013.
Table S4. Multivariable‐adjusted risk of vascular dementia for white matter lesions volume levels combined with total brain volume levels or total number of dementia‐related brain regions with atrophy.
Table S5. Multivariable‐adjusted risk of dementia subtypes for white matter lesions volume levels combined with brain atrophy status in each dementia‐related brain region.
Data Availability Statement
The dataset which we used in the present study is not publicly available, because it contains personal clinical data of the study participants. However, the data are available on reasonable request and with the permission of the principal investigator of the Hisayama Study, Toshiharu Ninomiya (Department of Epidemiology and Public Health, Graduate School of Medical Sciences, Kyushu University, Fukuoka, Japan).