Abstract
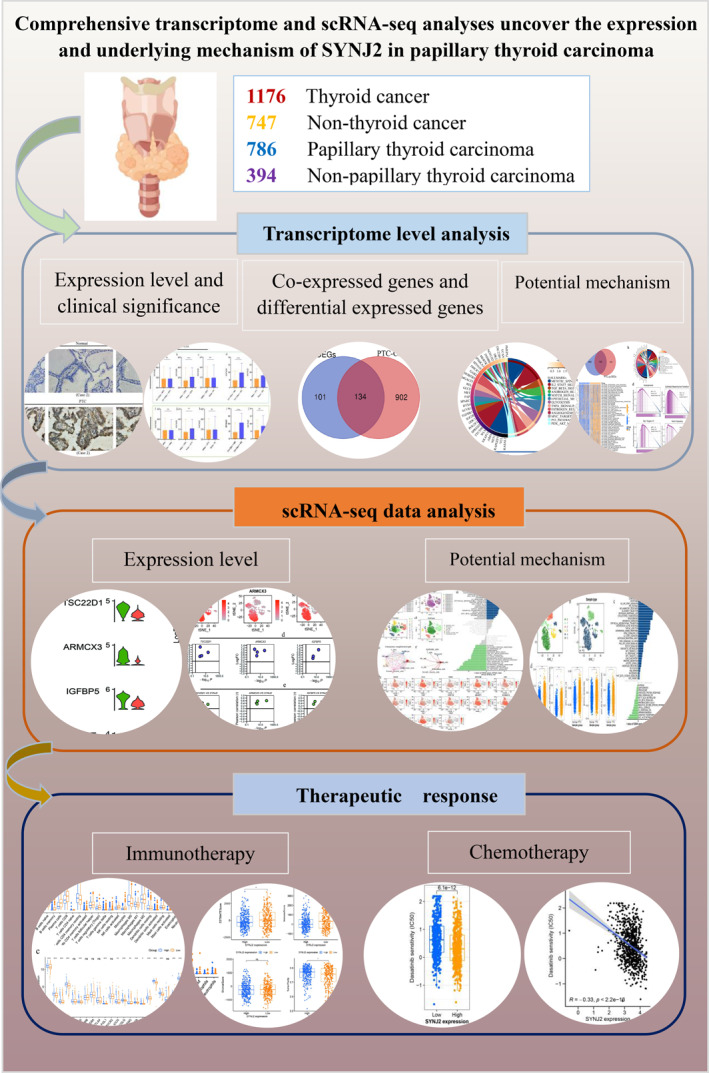
Synaptojanin 2 (SYNJ2) has crucial role in various tumors, but its role in papillary thyroid carcinoma (PTC) remains unexplored. This study first detected SYNJ2 protein expression in PTC using immunohistochemistry method and further assessed SYNJ2 mRNA expression through mRNA chip and RNA sequencing data and its association with clinical characteristics. Additionally, KEGG, GSVA, and GSEA analyses were conducted to investigate potential biological functions, while single‐cell RNA sequencing data were used to explore SYNJ2's underlying mechanisms in PTC. Meanwhile, immune infiltration status in different SYNJ2 expression groups were analyzed. Besides, we investigated the immune checkpoint gene expression and implemented drug sensitivity analysis. Results indicated that SYNJ2 is highly expressed in PTC (SMD = 0.66 [95% CI: 0.17–1.15]) and could distinguish between PTC and non‐PTC tissues (AUC = 0.74 [0.70–0.78]). Furthermore, the study identified 134 intersecting genes of DEGs and CEGs, mainly enriched in the angiogenesis and epithelial‐mesenchymal transition (EMT) pathways. Subsequent analysis showed the above pathways were activated in PTC epithelial cells. PTC patients with high SYNJ2 expression showed higher sensitivity to the six common drugs. Summarily, SYNJ2 may promote PTC progression through angiogenesis and EMT pathways. High SYNJ2 expression is associated with better response to immunotherapy and chemotherapy.
Keywords: papillary thyroid carcinoma (PTC), single‐cell RNA sequencing (scRNA‐seq), synaptojanin 2 (SYNJ2), underlying mechanism
Our study suggests that SYNJ2 is highly expressed in PTC tissues and may be involved in the development of PTC through the angiogenesis and epithelial–mesenchymal transition pathways. Additionally, high expression of SYNJ2 may suggest a good immunotherapeutic and chemotherapeutic response for PTC.
Abbreviations
- AUC
area under the curve
- GSEA
gene set enrichment analysis
- GSVA
Gene set variation analysis.
- IHC
Immunohistochemistry
- KEGG
Kyoto Encyclopaedia of Genes and Genomes;
- PTC
papillary thyroid carcinoma
- ROC
receiving operator characteristic
- SMD
standardized mean difference
- SROC
summarised receiver operating characteristic
- SYNJ2
synaptojanin 2
- THCA
thyroid cancer;
1. INTRODUCTION
Thyroid cancer (THCA) is the main cause of endocrine malignancies mortality with a high incidence rate [1, 2, 3]. As the most common subtype of THCA, papillary thyroid cancer (PTC) accounts for the vast majority of THCA and its incidence is on the rise worldwide [4, 5, 6, 7, 8]. Parts of PTC cases are characterised by high invasiveness, rapid progression and poor prognosis [9]. Surgery is still the first‐line therapeutic option for patients with PTC, and the combination of ablation, chemotherapy and radiotherapy has gradually gained prominence as a therapeutic strategy; however, drug resistance and side effects limit the value of chemotherapy drugs for clinical application [10, 11]. Early diagnosis and treatment of PTC can effectively improve patient prognosis, but the molecular mechanisms and functions of its progression remain unclear [9, 12].
Synaptojanin (SYNJ) plays an important role by participating in synaptic vesicle endocytosis and contains the structural domains for the following phosphatidylinositol phosphatase activity: an N‐terminal Sac1 phosphatase domain, a 5‐phosphatase domain, and a C‐terminal proline‐rich domain [13, 14, 15, 16]. As a member of the inositol polyphosphate phosphatases family, Synaptojanin 2 (SYNJ2), which exists on chromosome 6q25.3, has a critical effect in various human cellular processes, including clathrin‐coated receptor internalisation, coated vesicle formation, and the regulation of clathrin‐mediated endocytosis [17]. Synaptojanin 2 is more abundantly expressed and enriched in lamellipodia and invadopodia. Besides, it acts mainly through protein–protein interactions or by altering subcellular targeting [18, 19, 20, 21, 22, 23, 24]. Although great progress has been made in the study of SYNJ2, further work is still needed to elucidate its specific role in different diseases.
Synaptojanin 2 has now been commonly reported to be strongly associated with numerous human diseases, such as hearing loss [21, 25], depression [26], cognitive performance [27] and so on. Abnormal expression of SYNJ2 also affects the progression of many types of human tumours, such as lung cancer, liver cancer, colorectal cancer [18, 22], glioma [28], prostate cancer, and breast cancer [29]. A recent study assessed the expression levels and clinical relevance of SYNJ2 in pan‐cancer and confirmed its high expression in lung squamous cell carcinoma tissues. Upregulated SYNJ2 identifies cancer status and predicts poor prognosis in individual patients with cancer, demonstrating its potential as a novel potential biomarker for predicting and treating a wide range of cancers [20]. Another study reported that SYNJ2 is significantly over‐expressed in the serum of patients with hepatocellularcarcinoma (HCC) and involved in HCC progression via metabolic perturbation pathways [18]. Besides, SYNJ2 acts as a pro‐oncogene in breast tumours and its overexpression in tumours promotes breast cancer formation through the AKT‐dependent, PI3K pathway and regulation of the EGFR cycle [24]. High expression of SYNJ2 is thought to be associated with tumour invasion and metastatic spread [19, 30], which regulates cell proliferation and apoptosis by dephosphorylating plasma membrane phosphatidylinositol. The formation of cellular lamellipodia and invadopodia promoted by SYNJ2 may affect the migration and invasion of cancer cells, and dysregulated SYNJ2 levels may promote the development of malignant tumours and worsen patient prognosis [18, 22]. But to our knowledge, the reports on the expression and role of SYNJ2 in PTC are still lacking. Therefore, the role and biological function of SYNJ2 in PTC remain largely unknown.
To explore the expression pattern of SYNJ2 in THCA and PTC, our study synthesised the protein and mRNA expression levels of SYNJ2 in PTC. We collected a total of 133 samples for immunohistochemistry (IHC) to assess the protein levels of SYNJ2 in PTC samples and the results revealed that SYNJ2 was significantly highly expressed in PTC tissues. Meanwhile, we analysed microarray data from multiple databases and the results were consistent with IHC. In addition, single‐cell RNA sequencing (scRNA‐seq) data from the GSE184362 dataset were also analysed in the present study, contributing to understanding the molecular mechanisms of SYNJ2 in PTC onset and progression. Finally, we also performed drug sensitivity and immune checkpoint analysis to assess the relationship between SYNJ2 expression and PTC treatment response.
2. MATERIALS AND METHODS
2.1. Transcriptome data of Synaptojanin 2 in PTC and non‐PTC
2.1.1. Protein expression data of Synaptojanin 2 in PTC and non‐PTC
In our study, we used IHC to evaluate the protein levels of SYNJ2 in PTC and non‐PTC samples. Briefly, a total of 101 PTC and 32 non‐PTC tissue samples were prepared using three microarrays from Fanpu (Guilin, China) PRC1021, PRC481 and PRC961. The rabbit monoclonal anti‐SYNJ2 antibody (W.B.: 1:200‐1:1000; Catalogue Number: orb513930) was applied in this study. Then, the positive intensity and percentage score were used to calculate the final IHC staining score for each sample [31, 32, 33, 34]. Additionally, we collected the clinicopathological data of each patient to constitute our in‐house IHC dataset.
2.1.2. mRNA expression data of Synaptojanin 2 from public datasets
Thyroid cancer and PTC mRNA data were downloaded from the Gene Expression Omnibus (GEO), the Cancer Genome Atlas (TCGA), Sequence Read Archive, ArrayExpress, and Oncomine databases. The screening criteria of mRNA data from THCA datasets were as follows: 1. Inclusion criteria: 1) derived from human tissue samples and 2) datasets containing both tumour and normal samples. 2. Exclusion criteria: 1) datasets with missing expression profiles; 2) incomplete mRNA data; 3) datasets with tumour and normal sample sizes less than 3; and 4) datasets without SYNJ2 expression. On top of the previous criteria, the PTC dataset exclusion criteria were refined: 1) data with microarray information that did not distinguish subtypes and 2) datasets without PTC subtypes or normal samples. Finally, we included 1761 and 1047 samples to study the SYNJ2 expression in THCA and PTC, respectively. It was here important to note that the THCA samples included PTC samples.
2.2. Screening for upregulated differentially expressed genes and co‐expressed genes of Synaptojanin 2 in PTC
We used the "limma" package to process the PTC datasets: GSE27155, GSE29265, GSE29315, GSE33630, GSE126698, and TCGA+GTEx by R software (version 3.6.3). First, we performed log2 (expression+1) preprocessing on the gene expression and eliminated the duplicate genes. Finally, we screened the upregulated differentially expressed genes (up‐DEGs) between high and low SYNJ2 expression groups in PTC according to strict criteria. Specifically, the ultimate up‐DEGs must meet the criteria of log2 fold change (log2 FC) > 0.3 and p < 0.05 in at least three datasets.
Also, we calculated the correlation coefficients of SYNJ2 with other genes. Further, cor > 0.3, p < 0.05 was used as a criterion to identify co‐expressed genes (CEGs) of SYNJ2 based on all included datasets. Notably, only genes that met the above criteria in at least three datasets were regarded as CEGs for SYNJ2.
2.3. Clinical significance of Synaptojanin 2 in PTC
To assess the relationship between SYNJ2 expression and clinical parameters of patients with PTC, we included clinical data from TCGA and IHC. Further, we evaluated the relationship between SYNJ2 expression and clinical parameters (age, gender, T, N, and M‐stage) of patients with THCA using the t‐test. Additionally, we extracted clinical data of PTC to further examine the relationship between the SYNJ2 expression and clinical parameters of patients with PTC.
2.4. Potential functions and action mechanisms of Synaptojanin 2 in PTC
2.4.1. Transcriptome functional enrichment analysis
We took the intersection of CEGs and up‐DEGs of SYNJ2 in PTC and then performed the Kyoto Encyclopaedia of Genes and Genomes (KEGG) analysis on the intersecting genes. In addition, based on TCGA+GTEx data, the samples were classified into high and low groups based on the median expression of SYNJ2 and then the Gene set variation analysis (GSVA) and gene set enrichment analysis (GSEA) analyses were conducted.
2.4.2. ScRNA‐seq data analysis
In this study, we downloaded the scRNA‐seq dataset GSE184362 containing 7 normal and 6 PTC samples from the GEO database. First, we integrated all samples and identified cells containing 2000–4000 genes and less than 5% of mitochondrial genes. Subsequently, the batch effect between samples was eliminated using the R package "harmony". Based on the R package "Seurat", we performed the dimensionality reduction and clustering analysis using the t‐Distributed Stochastic Neighbor Embedding method and selected the top 15 principal components for subsequent analysis. The R package "SingleR" was used to annotate the cell clusters. Seven cell clusters were finally identified and cell–cell interactions between the seven cell types were analysed by the R package "Cellchat". In addition, GSVA ("h.all.v7.4.symbols.gmt" as a reference gene set) was used to explore the activity scores of various pathways in cells of different groups. In addition, we also used CellMarker 2.0 database (http://bio‐bigdata.hrbmu.edu.cn/CellMarker/) to view the expression of oncogenic epithelial cell markers of THCA in different cell clusters. Finally, we further analysed the epithelial cell clusters with higher weights by the GSVA method to assess the differences in pathway activity scores in normal and PTC epithelial cells.
Additionally, the "FindAllMarkers" function was applied to determine the up‐DEGs between normal and PTC epithelial cells (Log2 FC > 0.3 & p < 0.05 as standard). We further intersected the differential genes identified based on scRNA‐seq data with previously obtained intersecting genes (CEGs and up‐DEGs) to yield crucial genes. Additionally, we also assessed the expression of the above genes between different cell types and the correlation with SYNJ2.
2.5. Potential therapeutic response of Synaptojanin 2 in PTC
2.5.1. Immunotherapy response
We first divided the samples into high and low SYNJ2 expression groups using the median expression of SYNJ2. To compare the differences in various immune cell components between the low and high SYNJ2 expression groups, we assessed the infiltration levels of 22 immune cell types based on TCGA data using the CIBERSORT algorithm. We also assessed the differences in 13 immune‐related molecules between the high and low SYNJ2 expression groups. Subsequently, the ESTIMATE algorithm was used to calculate the samples' immune score, stromal score, estimated score, and tumour purity. Given the importance of checkpoint inhibitors in clinical treatment, we further examined the expression of immune checkpoint genes in the high and low SYNJ2 expression groups.
2.5.2. Chemotherapy drug sensitivity analysis
The half maximal inhibitory concentration (IC50) values of 6 commonly used chemotherapeutic agents (sorafenib, sunitinib, dasatinib, imatinib, paclitaxel, and doxorubicin) in the high and low SYNJ2 expression groups were calculated using the "pRRophetic" algorithm to investigate the relationship between SYNJ2 expression and chemotherapeutic drug sensitivity.
2.6. Statistical analysis
The differences in SYNJ2 expression between two independent groups (THCA & non‐THCA and PTC & non‐PTC) were analysed using independent t‐tests. Combining the data from IHC and mRNA, we chose the random effects model using R software (version 3.6.3) to calculate the pooled standardised mean differences (SMD) and their 95% confidence intervals to assess whether there were differences in SYNJ2 expression between the two groups. Receiver operating characteristic (ROC) curves and summary receiver operating characteristic curves were plotted, and then area under the curve (AUC) values were calculated to test the ability of SYNJ2 to screen for THCA and PTC. If p < 0.05, statistical significance was indicated.
3. RESULTS
3.1. Expression of Synaptojanin 2 in PTC
Following the study design and selection criteria, we finally included 11 platform datasets of the THCA and 7 PTC datasets that met the criteria for the study (Figure 1, Supplemental Table S1, Table 1). In THCA, t‐tests were used to analyse SYNJ2 expression in the 11 microarrays and scatter plots demonstrated that SYNJ2 expression was upregulated in most of the microarrays (Supplemental Figure 1a). Immunohistochemistry results also showed high expression of SYNJ2 in the THCA samples (Supplemental Figure 1b), with no publication bias found (Supplemental Figure 1c). Further, combining microarray data and IHC case data, we found that compared to 747 non‐THCA samples, SYNJ2 was highly expressed in 1176 THCA cases (SMD = 0.57 [95% CI: 0.17–0.98], Supplemental Table S1, Supplemental Figure 1d), while the ROC curve analysis showed that upregulated SYNJ2 had discriminatory significance for THCA and non‐THCA (AUC = 0.74 [0.70–0.78]) (Supplemental Figure 2a–l).
FIGURE 1.
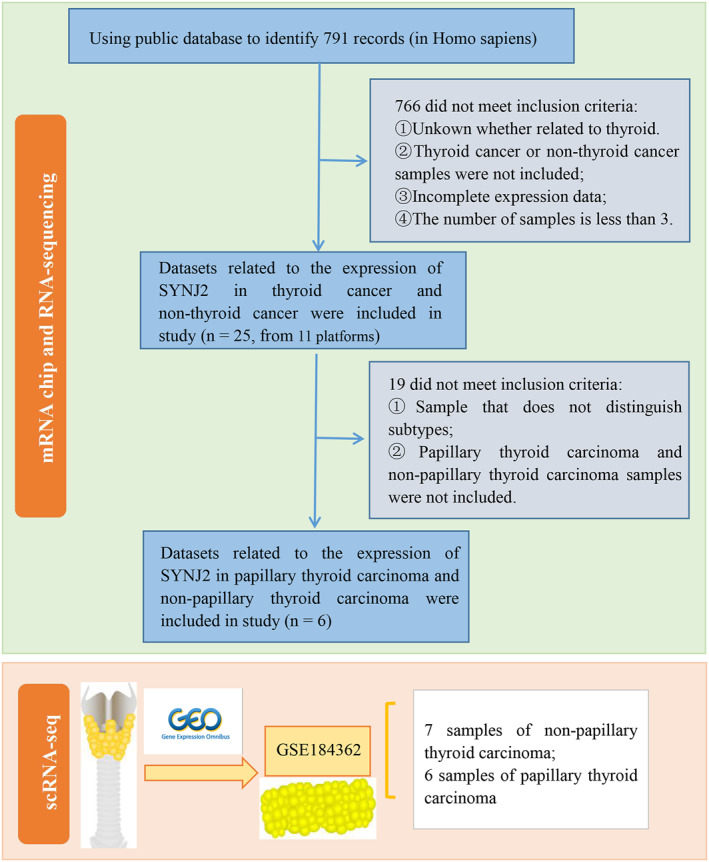
Flow chart for obtaining Synaptojanin 2 (SYNJ2) expression datasets.
TABLE 1.
Synaptojanin 2 (SYNJ2) expression values for PTC and non‐PTC based on 7 platforms.
| PTC | Non‐PTC | Diagnostic test | ||||||||
|---|---|---|---|---|---|---|---|---|---|---|
| Study | N | M | SD | N | M | SD | TP | FP | FN | TN |
| GSE27155 | 51 | 2.996 | 0.110 | 4 | 2.944 | 0.049 | 26 | 0 | 25 | 4 |
| GSE29265 | 20 | 6.614 | 0.632 | 20 | 6.395 | 0.485 | 8 | 4 | 12 | 16 |
| GSE29315 | 9 | 4.673 | 0.374 | 8 | 4.312 | 0.311 | 5 | 1 | 4 | 7 |
| GSE33630 | 49 | 7.808 | 0.28 | 45 | 7.719 | 0.284 | 30 | 14 | 19 | 31 |
| GSE126698 | 5 | 5.363 | 0.228 | 6 | 5.053 | 0.212 | 4 | 0 | 1 | 6 |
| TCGA+GTEx | 551 | 3.385 | 0.518 | 279 | 3.377 | 0.519 | 287 | 114 | 264 | 165 |
| IHC | 101 | 8.554 | 2.773 | 32 | 4.125 | 2.587 | 83 | 7 | 18 | 25 |
Abbreviations: GTEx: The Genotype‐Tissue Expression; IHC: Immunohistochemistry; M: mean (the expression profile is processed by log2); N: number; PTC: papillary thyroid carcinoma; SD: standard deviation; SYNJ2: synaptojanin 2; TCGA: The Cancer Genome Atlas; T.P., F.P., F.N., TN: true positive, false positive, false negative and true negative.
Based on the study of THCA, we further delved into the expression of SYNJ2 in PTC. Immunohistochemistry analysis indicated that SYNJ2 protein was highly expressed in PTC cases and the IHC results of 3 non‐PTC cases and 3 PTC cases were presented (Figure 2a–b). Besides, we combined the IHC results of 133 tissue samples, mRNA chips, and RNA sequencing data to determine the expression of SYNJ2 in PTC and the results were presented as scatter plots (Figure 3a–g). SMD = 0.66 [95% CI: 0.17–1.15] for the combined 1180 samples (786 PTC and 394 non‐PTC) suggested that the SYNJ2 expression was upregulated in PTC tissues (Figure 3i). Remarkably, no publication bias was found using the Deeks test (Figure 3h). Additionally, our study also indicated that SYNJ2 possessed a better ability to distinguish PTC from non‐PTC (AUC = 0.74 [0.70–0.78]) (Figure 4a–h).
FIGURE 2.
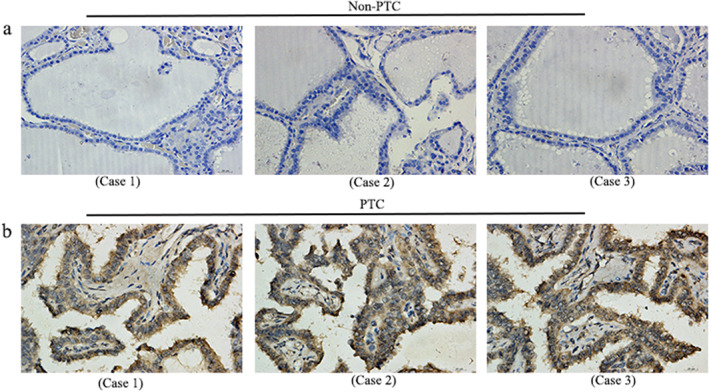
Immunohistochemistry (IHC) of Synaptojanin 2 (SYNJ2) in PTC. (a) The expression level of SYNJ2 protein was lower in non‐PTC cases (non‐PTC Case 1 [400×]; non‐PTC Case 2 [400×]; and non‐PTC Case 3 [400×]). (b) The expression level of SYNJ2 protein was higher in PTC cases (PTC Case 1 [400×]; PTC Case 2 [400×]; and PTC Case 3 [400×]).
FIGURE 3.
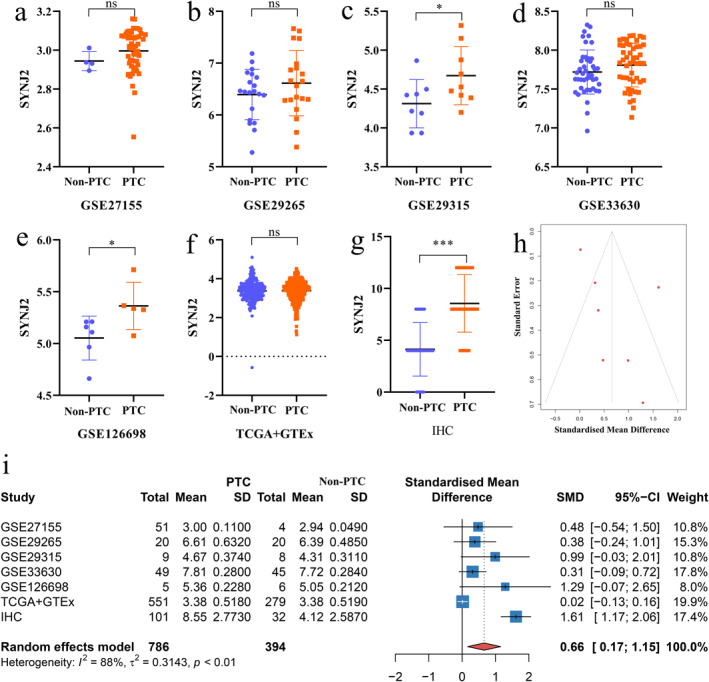
The expression and distinguishing capacity of Synaptojanin 2 (SYNJ2) in PTC. (a–g) Scatter plot. (h) Funnel plot of the publication bias. (i) Forest plot. SYNJ2: synaptojanin 2; PTC: papillary thyroid carcinoma; SMD: standardized mean difference; CI: confidence interval; TCGA: The Cancer Genome Atlas; GTEx: The Genotype‐Tissue Expression; and IHC: Immunohistochemistry (*p < 0.05, **p < 0.01, ***p < 0.001, "ns" represents p > 0.05).
FIGURE 4.
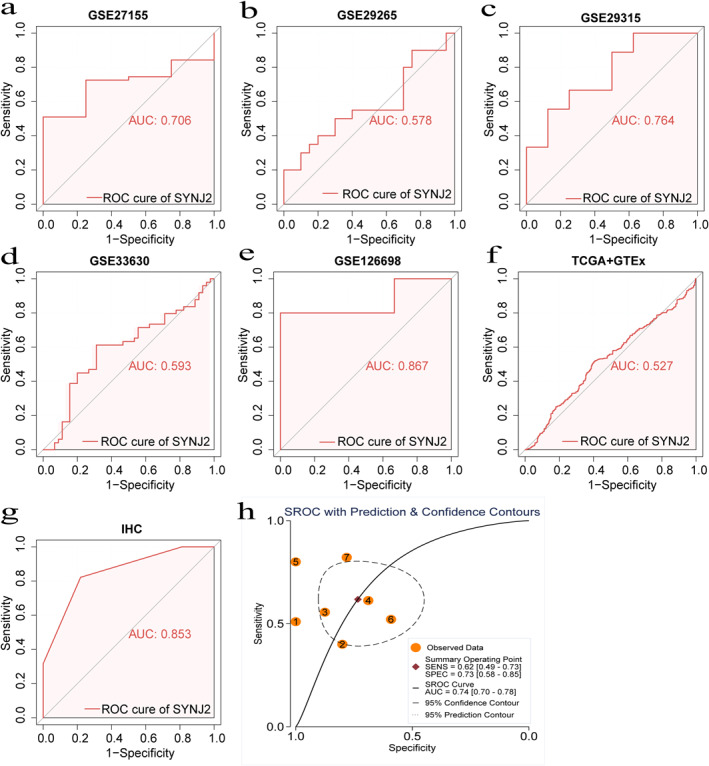
The Receiver operating characteristic (ROC) and summarised receiver operating characteristic (SROC) curves of Synaptojanin 2 (SYNJ2) for distinguishing capacity in PTC samples. (a–g) ROC. (h) SROC. ROC: receiving operator characteristic. AUC: area under the curve; SROC: summarised ROC; SYNJ2: synaptojanin 2; PTC: papillary thyroid carcinoma; TCGA: The Cancer Genome Atlas; GTEx: The Genotype‐Tissue Expression; and IHC: Immunohistochemistry.
3.2. Clinical significance of Synaptojanin 2 in PTC
Analysis of TCGA clinical data indicated that in both THCA and PTC, SYNJ2 showed a significantly high expression in the N‐stage (N1, p < 0.05) subgroup while it was not statistically significant in the M‐stage and T‐stage subgroups (Figure 5a–c, f‐h). In contrast, clinical data from IHC showed that SYNJ2 was highly expressed in THCA and PTC in the T‐stage (T3+T4, p < 0.05), while it was not statistically significant in the N‐stage (Figure 5d–e, i‐j). In addition, the results also showed that there was no difference in SYNJ2 expression between different ages and gender (Supplemental Figure 3a–h).
FIGURE 5.
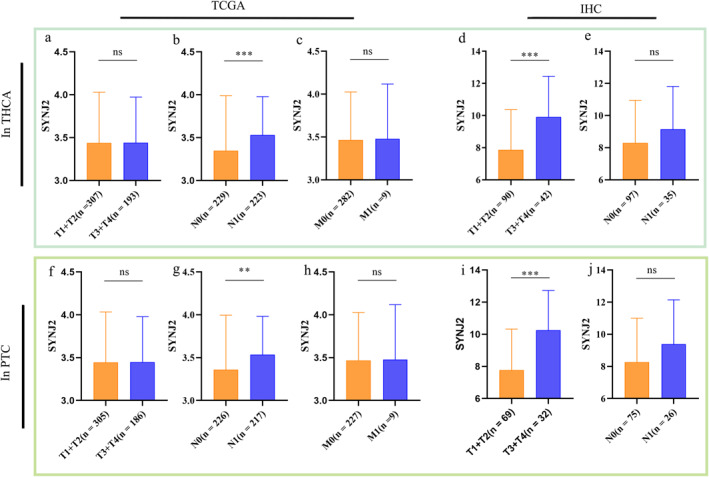
Association between Synaptojanin 2 (SYNJ2) expression and clinicopathological parameters in Thyroid cancer (THCA) and PTC samples (the Cancer Genome Atlas (TCGA) database and immunohistochemistry (IHC) data). (a–c) SYNJ2 expression of THCA and clinicopathological parameters (T, N, M‐stage) in TCGA database. (d–e) SYNJ2 expression of THCA and clinicopathological parameters (T, N‐stage) in IHC data. (f–h) SYNJ2 expression of PTC and clinicopathological parameters (T, N, M‐stage) in the TCGA database. (i–j) SYNJ2 expression of PTC and clinicopathological parameters (T, N‐stage) in IHC data. SYNJ2: synaptojanin 2; THCA: thyroid cancer; PTC: papillary thyroid carcinoma; TCGA: The Cancer Genome Atlas; and IHC: Immunohistochemistry (*p < 0.05, **p < 0.01, ***p < 0.001, and "ns" represents p > 0.05).
3.3. Potential action mechanism of Synaptojanin 2 in PTC
3.3.1. Pathway enrichment analysis
In our study, we screened 235 up‐DEGs and 1036 CEGs of SYNJ2 in PTC and the two overlapped to obtain 134 genes (Figure 6a). Then, we performed the KEGG analysis on the 134 genes and found that the above genes were mainly enriched in angiogenesis, epithelial–mesenchymal transition (EMT), myc_targets_v2, and notch signalling (Figure 6b). To further investigate the potential molecular mechanisms involved in the specific signalling pathways affecting the progression of PTC, GSVA was used to investigate the up‐ and down‐regulated signalling pathways in the high and low SYNJ2 expression groups, and the results showed that the two groups' differential pathways were also mainly enriched in the above four pathways (Figure 6c). Interestingly, GSEA based on TCGA+GTEx data also yielded consistent findings (Figure 6d). These results strongly suggested that these signalling pathways may participate in the development of PTC.
FIGURE 6.
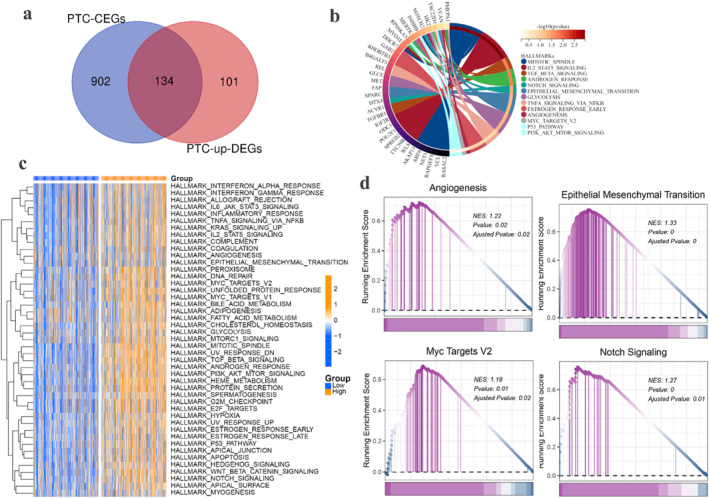
Kyoto Encyclopaedia of Genes and Genomes (KEGG), Gene set variation analysis (GSVA) and gene set enrichment analysis (GSEA) analysis of Synaptojanin 2 (SYNJ2) in PTC. (a) Venn diagram of upregulated differentially expressed genes (up‐DEGs) and co‐expressed genes (CEGs) of SYNJ2 in PTC. (b) KEGG analysis of 134 intersecting genes (based on hallmark gene sets). (c–d) GSVA and GSEA analysis were performed based on different SYNJ2 expression groups. SYNJ2: synaptojanin 2; PTC: papillary thyroid carcinoma; KEGG: Kyoto Encyclopaedia of Genes and Genomes; GSEA: gene set enrichment analysis; and GSVA: Gene set variation analysis.
3.3.2. ScRNA‐seq data analysis
After quality control, a total of 12,030 cells were extracted from the GSE184362 dataset of PTC and used for subsequent analysis. The data were subsequently processed to eliminate batch effects (Figure 7a–b) and the t‐SNE analysis was copolymerised into 16 cell clusters (Figure 7c). Furthermore, 7 clusters of epithelial cells, monocyte, T cells, N.K. cell, B cell, smooth muscle cells, and endothelial cells were further identified by the R package "SingleR" (Figure 7d). Cell–cell interaction analysis of the 7 cell types was performed to further elucidate these cells' interaction. The results showed that the strongest interaction between these 7 cell types was epithelial cells (Figure 7e–f). Additionally, the cells were divided into high‐ and low‐expression groups based on scRNA‐seq data using the SYNJ2 median expression. The subsequent GSVA showed that the pathways predominantly enriched in the high SYNJ2 expression group were consistent with the results in 3.3.1 (Figure 7g). The thyroid gland mainly comprises thyroid follicular epithelial cells and our results also showed that epithelial cells are the most prevalent. In addition, we extracted the markers expression in the cancerous epithelial cells of thyroid cancer (CDH1, CLU, DIO2, EPCAM, FN1, ID4, IYD, KRT18, MGST1, S100A13, TFF3, T.G., TPO) from the CellMarker 2.0 database. The results indicated that all the above markers showed high expression in epithelial cells, further suggesting that epithelial cells may play an essential role in PTC (Figure 7h). Therefore, we selected 6167 epithelial cells for further analysis (Figure 8a–b), and GSVA between normal epithelial cells and PTC epithelial cells suggested that several previous pathways (angiogenesis, EMT, myc_targets_v2, and notch signalling) were also activated in PTC epithelial cells (Figure 8c–d).
FIGURE 7.
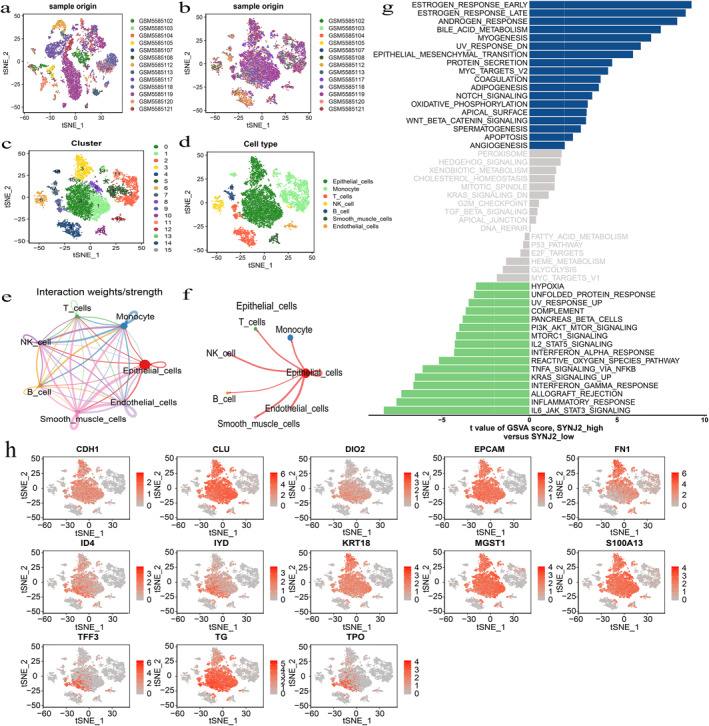
Overview of Synaptojanin 2 (SYNJ2) in the single‐cell RNA sequencing (scRNA‐seq) data for PTC (the data sourced from the GSE184362). (a–b) Elimination of batch effect. (c) Single‐cell transcriptome sequencing dimensionality reduction and clustering by using the Seurat t‐distributed stochastic neighbour embedding (t‐SNE). (d) Cell type annotations plot. (e–f) Cell–Cell interactions between the 7 primary cell types by Cellchat analysis. (g) Differences in pathway activity scores between SYNJ2 low and high groups by Gene set variation analysis (GSVA) . T‐values from the linear model are shown. (h) Cancerous epithelial markers expression in different cell clusters. SYNJ2: synaptojanin 2; PTC: papillary thyroid carcinoma; and GSVA: Gene set variation analysis.
FIGURE 8.
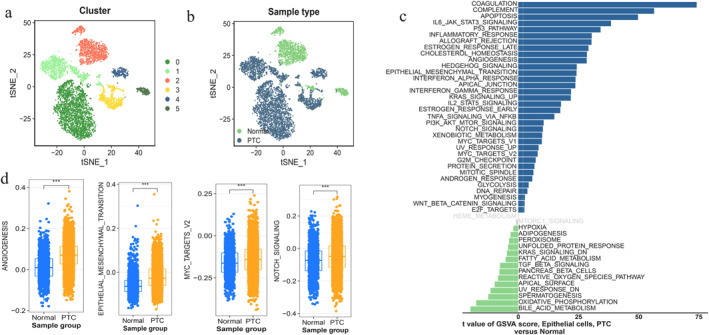
Epithelial cell cluster. (a–b) t‐SNE plot of 6167 epithelial cells, colour‐coded by their associated cluster or sample type. (c) Differences in pathway activities scored per cell by Gene set variation analysis (GSVA) analysis between normal (non‐PTC) and PTC epithelial cells. T‐values from a linear model are shown. (d) Boxplots show activity scores for 5 selected signalling pathways, stratified by normal (non‐PTC) or PTC epithelial clusters (blue and orange). PTC: papillary thyroid carcinoma; and GSVA: Gene set variation analysis.
In addition, to further screen the key CEGs of SYNJ2 in epithelial cells, we identified 31 up‐DEGs in PTC and normal epithelial cells using scRNA‐seq data. Then, the results were intersected with 134 genes to screen a total of 4 core genes (TSC22D1, ARMCX3, IGFBP5, and GGCT), and the above genes were highly expressed in PTC epithelial cells (Figure 9a–c). Analysis based on transcriptome data also showed that the above four core genes were highly expressed in PTC and positively correlated with SYNJ2 expression (Figure 9d–e).
FIGURE 9.
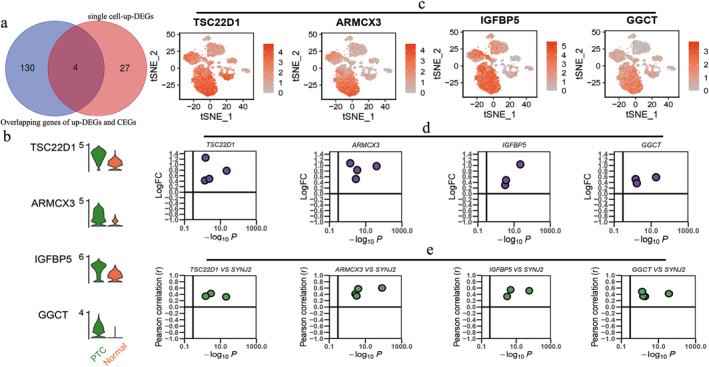
Acquisition of four crucial genes. (a) Venn diagram of upregulated differentially expressed genes (up‐DEGs) of single‐cell and 134 intersecting genes. (b–c) Differential expression of TSC22D1, ARMCX3, IGFBP5, and GGCT in PTC and normal (non‐PTC) epithelial cells. (d) Difference analysis results of 4 crucial genes based on included datasets. (e) Correlation analysis results of 4 crucial genes and Synaptojanin 2 (SYNJ2) based on included datasets. SYNJ2: synaptojanin 2 and PTC: papillary thyroid carcinoma.
3.4. Relation between Synaptojanin 2 expression and therapeutic response
3.4.1. Relation with immunotherapy response
To further understand the potential relevance of SYNJ2 expression to the immune landscape of PTC samples, we compared the differences in immune cell composition between the low and high SYNJ2 expression groups. Specifically, we evaluated 22 immune cell infiltration levels. Our results indicated significant differences in immune cell infiltration levels between the low and high SYNJ2 expression groups, with higher levels of B cells memory, plasma cells, T cells CD8, T cells regulatory (Tregs), and N.K. cells activated infiltration in the low SYNJ2 expression group. Meanwhile, B cells native, N.K. cells resting, and macrophages M0 infiltration levels were higher in the high SYNJ2 expression group (Figure 10a). The low SYNJ2 expression group showed a higher immune score and estimated score, while the tumour purity score was lower than the high expression group, and the stromal score was not yet statistically significant (Figure 10b). Additionally, the scores of three immune‐related molecules, APC_co_stimulation, MHC_class_I, and Type_II_IFN_Reponse, showed higher scores in the high expression group, while the scores of cytolytic activity were higher in the low expression group (Figure 10d). We further analysed the difference in immune checkpoint gene expression and found that multiple checkpoint inhibitors such as B2M, CD274, CD28, and CD40 were more highly expressed in the high SYNJ2 expression group (Figure 10c).
FIGURE 10.
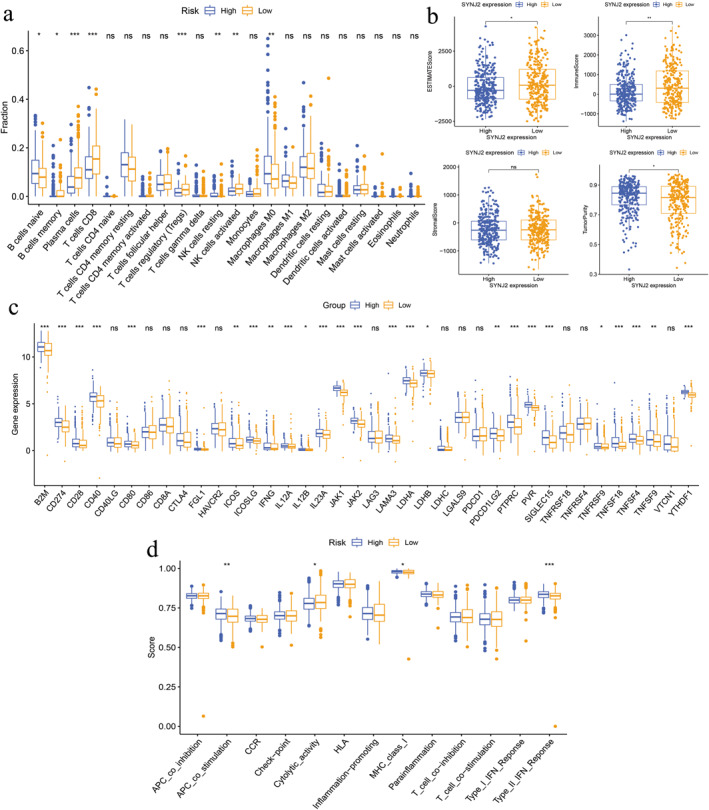
Correlation of Synaptojanin 2 (SYNJ2) expression with immune status and immunotherapy response in patients with PTC. (a) Enrichment levels of various types of immune cells. (b) Differences in the immune score, stromal score, estimated score, and tumour purity. (c) Differences in immune checkpoint genes expression. (d) Differences in 13 immune‐related functions. (*p < 0.05, **p < 0.01, ***p < 0.001, and “ns” represents p > 0.05). SYNJ2: synaptojanin 2 and PTC: papillary thyroid carcinoma.
3.4.2. Drug sensitivity analysis
In our current study, we observed that IC50 values of 6 common drugs, namely sorafenib, sunitinib, dasatinib, imatinib, paclitaxel, and doxorubicin, were lower in the SYNJ2 high expression group, implying that patients in the high SYNJ2 expression group were more sensitive to these drugs compared to the low SYNJ2 expression group (Figure 11a–f).
FIGURE 11.
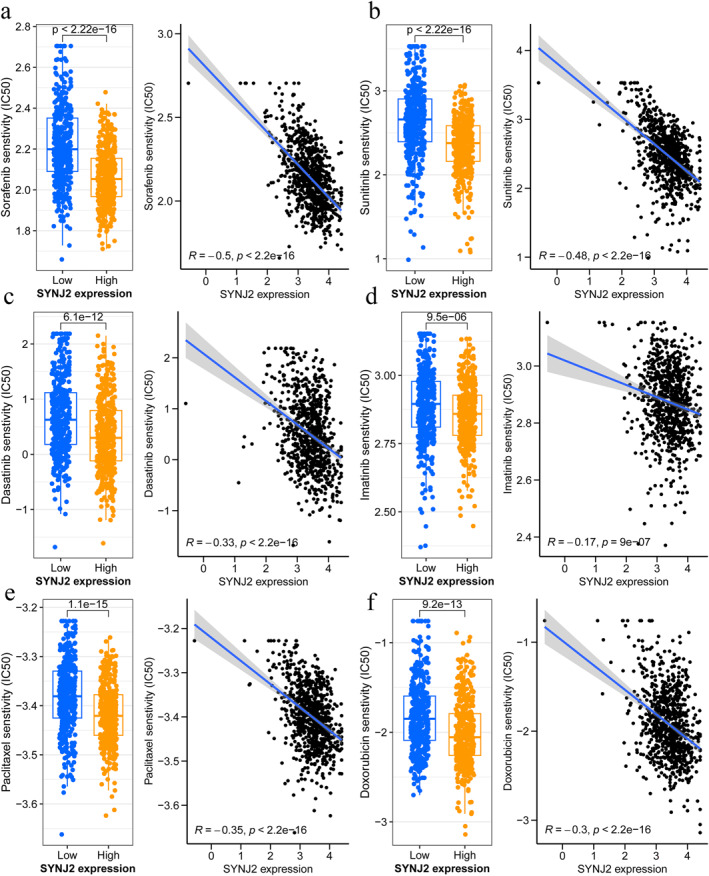
Chemosensitivity analysis. (a) sorafenib; (b) sunitinib; (c) dasatinib; (d) imatinib; (e) paclitaxel; and (f) doxorubicin.
4. DISCUSSION
PTC is the most common subtype of THCA and mostly asymptomatic and limited, but it does not exclude the occurrence of some more advanced stages and metastases. Studies have shown that PTC is the only subtype with a general increase in morbidity and a slight increase in mortality in recent years, posing a threat to human life and health [35, 36, 37]. Our study is the first to investigate the expression and action mechanism of SYNJ2 in PTC. We performed IHC analysis on 101 PTC and 32 non‐PTC tissue samples. Besides, we analysed 685 PTC samples and 362 non‐PTC samples from multiple databases, both of which showed significantly higher expression of SYNJ2 in PTC tissues compared to non‐PTC tissues. Overall, scRNA‐seq and transcriptomic data were used to explore the expression and potential mechanisms of SYNJ2 in PTC and to explore new therapeutic targets for PTC.
Recently, SYNJ2 expression has been reported to be upregulated in a variety of malignancies; however, the expression of SYNJ2 in PTC is currently unknown. Here, we first combined gene microarray and IHC case data to assess the expression level of SYNJ2 in THCA, which showed a high expression in 1176 patients with THCA compared to 747 non‐THCA cases and had high discrimination for THCA and non‐THCA tissues. Additionally, we further analysed the most common subtype of THCA, PTC. The results suggested that SYNJ2 was also highly expressed in PTC (PTC = 786, non‐PTC = 394) and SYNJ2 was equally discriminatory between PTC and non‐PTC. Besides, it also correlated with the clinical outcome of patients, with clinical data from TCGA showing that SYNJ2 was significantly more highly expressed in both THCA (THCA = 229, non‐THCA = 223) and PTC (PTC = 226, non‐PTC = 217) in the N‐stage (N1). However, clinical data from IHC showed no statistical difference yet in THCA and PTC (in the N0–N1 stage), but this followed the same trend as the statistical results from TCGA, where SYNJ2 expression levels were higher in the N1 stage. The results from IHC also suggested that in THCA (THCA = 90, non‐THCA = 42) and PTC (PTC = 69, non‐PTC = 32), SYNJ2 was highly expressed in the late T‐stage (T3+T4). The above results may attribute to the limited number of cases included in the IHC in this study, so the clinical significance of SYNJ2 in PTC needs to be further investigated.
Synaptojanin 2 is involved in the progression of many human tumours, mainly through the dephosphorylation of plasma membrane phosphatidylinositol to regulate cell proliferation and apoptosis [18, 19, 24]. Recent studies have indicated that SYNJ2 mutations correlate with an elevated risk of developing colon cancer [38]. Additionally, downregulation of SYNJ2 in patients with adrenocortical carcinoma is linked to unfavourable prognoses [39]. Moreover, increased SYNJ2 expression has been identified as a pivotal risk factor in uveal melanoma development [40]. To understand the signalling pathways of SYNJ2 in PTC, our functional enrichment analysis and GSVA of 134 genes showed that SYNJ2 was mainly enriched in a total of 4 pathways in PTC, including angiogenesis and EMT, myc_targets_v2, etc., where angiogenesis and EMT have received the most extensive attention in the development of tumours. Angiogenesis is participated in various pathophysiological processes in the body, and tumour growth and metastasis also depend on angiogenesis, which is an important component of the tumour microenvironment. Pathological angiogenesis usually leads to abnormal vascular structure and function. A study on epithelial ovarian cancer showed that by downregulating angiogenesis‐related proteins, angiogenesis could be inhibited, thereby suppressing tumour metastasis [41]. Targeting tumour‐associated angiogenesis has been applied to the study of renal cell carcinoma and Lm‐LLO‐CD105 has become a breakthrough point in treating renal cell carcinoma under its significant anti‐angiogenic effect [42]. In PTC, MiR‐1178‐3p can regulate tumour cell‐induced angiogenesis by targeting YWHAH [43]. Epithelial–mesenchymal transition, which refers to epithelial‐to‐mesenchymal cell transformation, a process by which cells gain the ability to metastasise and invade, plays a key role in PTC progression. It has been shown that some genes are overexpressed in PTC and can inhibit the proliferation and migration of PTC cells by suppressing EMT, such as ANK3 [44] and PRDM16 [45]. In our study, scRNA‐seq data analysis showed that epithelial cells were a key cell type affecting PTC progression. Gene set variation analysis also showed that the high SYNJ2 expression group was mainly associated with angiogenesis and EMT pathways. Meanwhile, TSC22D1, ARMCX3, IGFBP5, and GGCT were identified as the core genes of SYNJ2 in PTC. It is worth noting that TSC22D1 has been reported to be related to the differentiation process of various types of epithelial cells [46, 47]. Additionally, studies have shown that IGFBP5 can promote or inhibit the EMT process [48, 49]. Similarly, GGCT may affect the development of tumour cells by activating EMT [50, 51]. Therefore, our results suggest that SYNJ2 may act synergistically with TSC22D1, ARMCX3, IGFBP5, and GGCT in PTC cells and participate in the angiogenesis and EMT pathways to influence the development of PTC.
The immune system plays an essential role in regulating the progression of PTC [52, 53]. In our study, we investigated the immune landscape of PTC using different algorithms, including ESTIMATE and CIBERSORT, to estimate the immune score, stromal score, estimated score, and tumour purity, respectively, in PTC samples. Our results showed that the high SYNJ2 expression group had higher tumour purity scores and lower immune scores. We further explored the expression of immune checkpoint molecules in different SYNJ2 expression groups to predict the immunotherapeutic response in patients with PTC. Interestingly, most immune checkpoint molecules such as B2M, CD274, CD28, and CD40 showed higher expression in the high SYNJ2 expression group and higher scores for APC_co_stimulation, MHC_class_I, and Type_II_IFN_Reponse. Furthermore, in this study, we observed 6 commonly used drugs (sorafenib, sunitinib, dasatinib, imatinib, paclitaxel, and doxorubicin) were more sensitive in the high SYNJ2 expression group. Taken together, our results suggest that SYNJ2 is a biomarker for predicting the response to immunotherapy and chemotherapy in PTC, offering new possibilities for improving the outcome of PTC.
Although our study provides new ideas for the mechanism of PTC and therapeutic studies, there are still shortcomings. First, the study's mRNA chip and RNA sequencing data were from public databases, not ours. Second, the clinical data from the IHC data we provided were limited and more case numbers should be included in the future to fully explore the clinical value of SYNJ2 in PTC. In addition, further experiments are needed to investigate the biological action mechanism of SYNJ2 in PTC and its ability to serve as a target for improving the efficacy of immunotherapy and chemotherapy.
5. CONCLUSION
Our study suggests that SYNJ2 is highly expressed in PTC tissues and may be involved in the development of PTC through the angiogenesis and EMT pathways. Additionally, high expression of SYNJ2 may suggest a good immunotherapeutic and chemotherapeutic response for PTC.
AUTHOR CONTRIBUTIONS
Yu‐Yan Pang designed and directed the study; Yuan‐Ping Yang, Gang Chen and Zhi‐Guang Huang were responsible for the implementation of immunohistochemistry. Jia‐Yuan Luo, Juan He and Lin Shi were responsible for the data analysis. Yuan‐Ping Yang, Si‐Yuan Chen, Yu‐Wen Deng, Yi‐Jia Yang, and Yi‐Jun Tang participated in the writing of the manuscript. All authors were involved in the revision of the manuscript.
CONFLICT OF INTEREST STATEMENT
The authors declare no conflicts of interest.
ETHICS APPROVAL AND CONSENT TO PARTICIPATE
The ethics committee of the First Affiliated Hospital of Guangxi Medical University and Guilin Fanpu Biotechnology Co. approved the study (Fanpu, [2018] No. 23).
CONSENT FOR PUBLICATION
Not applicable.
Supporting information
Table S1
Figure S1
Figure S2
Figure S3
ACKNOWLEDGEMENTS
Thanks for the technical support provided by the Guangxi Key Laboratory of Medical Pathology. This study was supported by the Guangxi Zhuang Autonomous Region Health Commission Self‐financed Scientific Research Project (Z20201138, Z‐A20220521), Innovation Project of Guangxi Graduate Education (YCBZ2023096), Guangxi Higher Education Undergraduate Teaching Reform Project (2022JGA146), Guangxi Educational Science Planning Key Project (2021B167), Guangxi Medical High‐level Key Talents Training "139" Programme (2020), and The First Affiliated Hospital of Guangxi Medical University 2020 Undergraduate Innovation and Entrepreneurship Training Programme (S202210598098).
Yang, Y.‐P. , et al.: Comprehensive transcriptome and scRNA‐seq analyses uncover the expression and underlying mechanism of SYNJ2 in papillary thyroid carcinoma. IET Syst. Biol. 18(5), 183–198 (2024). 10.1049/syb2.12099
[Correction added on 16 October 2024, after the first online publication. The keywords big data, biochemistry, biocommunications, bioinformatics, biology, cancer are replaced with papillary thyroid carcinoma (PTC), single‐cell RNA sequencing (scRNA‐seq), synaptojanin 2 (SYNJ2), underlying mechanism]
DATA AVAILABILITY STATEMENT
All data covered in this study were included in the manuscript.
REFERENCES
- 1. Yao, X. , Zhang, Q. : Function and clinical significance of circular RNAs in thyroid cancer. Front. Mol. Biosci. 9, 925389 (2022). 10.3389/fmolb.2022.925389 [DOI] [PMC free article] [PubMed] [Google Scholar]
- 2. Kim, H. , et al.: Clinical assessment of T2 papillary thyroid carcinoma: a retrospective study conducted at a single tertiary institution. Sci. Rep. 12(1), 13548 (2022). 10.1038/s41598-022-17979-2 [DOI] [PMC free article] [PubMed] [Google Scholar]
- 3. Cao, Z. , et al.: Receptor‐ligand pair typing and prognostic risk model for papillary thyroid carcinoma based on single‐cell sequencing. Front. Immunol. 13, 902550 (2022). 10.3389/fimmu.2022.902550 [DOI] [PMC free article] [PubMed] [Google Scholar]
- 4. Zhang, X. , et al.: A multi‐channel deep convolutional neural network for multi‐classifying thyroid diseases. Comput. Biol. Med. 148, 105961 (2022). 10.1016/j.compbiomed.2022.105961 [DOI] [PubMed] [Google Scholar]
- 5. Zhou, X. , et al.: SPTBN2 promotes the progression of thyroid cancer by accelerating G1/S transition and inhibiting apoptosis. Dis. Markers 2022, 2562595–2562616 (2022). 10.1155/2022/2562595 [DOI] [PMC free article] [PubMed] [Google Scholar]
- 6. Yan, X. , et al.: The utility of sentinel Lymph node biopsy in the lateral neck in papillary thyroid carcinoma. Front. Endocrinol. 13, 937870 (2022). 10.3389/fendo.2022.937870 [DOI] [PMC free article] [PubMed] [Google Scholar]
- 7. Ben Thayer, M. , et al.: Incidental discovery of a Hodgkin lymphoma synchronous to a papillary thyroid carcinoma. Clinical case reports 10(8), e6246 (2022). 10.1002/ccr3.6246 [DOI] [PMC free article] [PubMed] [Google Scholar]
- 8. Kuchareczko, A. , et al.: A significance of concomitant BRAF and TERT mutations in polish patients with papillary thyroid microcarcinoma: a retrospective cohort study based on 430 cases. Thyroid: official journal of the American Thyroid Association 32(11), 1372–1381 (2022). 10.1089/thy.2022.0155 [DOI] [PubMed] [Google Scholar]
- 9. Tang, L. , et al.: Clinical significance of multi‐genic assay in identifying aggressive papillary thyroid carcinoma. Am. J. Otolaryngol. 43(5), 103563 (2022). 10.1016/j.amjoto.2022.103563 [DOI] [PubMed] [Google Scholar]
- 10. Fei, Y. , Li, Y. , Chen, F. : viaLncRNA‐IQCH‐AS1 sensitizes thyroid cancer cells to doxorubicin modulating the miR‐196a‐5p/PPP2R1B signalling pathway. J. Chemother., 1–9 (2022) [DOI] [PubMed] [Google Scholar]
- 11. Ding, M. , et al.: Pathology confirmation of the efficacy and safety of microwave ablation in papillary thyroid carcinoma. Front. Endocrinol. 13, 929651 (2022). 10.3389/fendo.2022.929651 [DOI] [PMC free article] [PubMed] [Google Scholar]
- 12. Wang, M. , et al.: Safety and efficacy of ultrasound‐guided thermal ablation in treating T1aN0M0 and T1bN0M0 papillary thyroid carcinoma: a meta‐analysis. Front. Endocrinol. 13, 952113 (2022). 10.3389/fendo.2022.952113 [DOI] [PMC free article] [PubMed] [Google Scholar]
- 13. Geng, J. , et al.: Phosphorylation of synaptojanin differentially regulates endocytosis of functionally distinct synaptic vesicle pools. J. Neurosci. : the official journal of the Society for Neuroscience 36(34), 8882–8894 (2016). 10.1523/jneurosci.1470-16.2016 [DOI] [PMC free article] [PubMed] [Google Scholar]
- 14. Dong, Y. , et al.: Synaptojanin cooperates in vivo with endophilin through an unexpected mechanism. Elife 4 (2015). 10.7554/elife.05660 [DOI] [PMC free article] [PubMed] [Google Scholar]
- 15. Watanabe, S. , et al.: Synaptojanin and endophilin mediate neck formation during ultrafast endocytosis. Neuron 98(6), 1184–1197.e6 (2018). 10.1016/j.neuron.2018.06.005 [DOI] [PMC free article] [PubMed] [Google Scholar]
- 16. Vanhauwaert, R. , et al.: The SAC1 domain in synaptojanin is required for autophagosome maturation at presynaptic terminals. EMBO J. 36(10), 1392–1411 (2017). 10.15252/embj.201695773 [DOI] [PMC free article] [PubMed] [Google Scholar]
- 17. Liu, Y. , Bankaitis, V. : Phosphoinositide phosphatases in cell biology and disease. Prog. Lipid Res. 49(3), 201–217 (2010). 10.1016/j.plipres.2009.12.001 [DOI] [PMC free article] [PubMed] [Google Scholar]
- 18. Zhang, R. , et al.: Identifying the prognostic risk factors of synaptojanin 2 and its underlying perturbations pathways in hepatocellular carcinoma. Bioengineered 12(1), 855–874 (2021). 10.1080/21655979.2021.1890399 [DOI] [PMC free article] [PubMed] [Google Scholar]
- 19. Chuang, Y. , et al.: Regulation of synaptojanin 2 5'‐phosphatase activity by Src. Cell Adhes. Migrat. 6(6), 518–525 (2012). 10.4161/cam.22139 [DOI] [PMC free article] [PubMed] [Google Scholar]
- 20. Hou, W. , et al.: SYNJ2 is a novel and potential biomarker for the prediction and treatment of cancers: from lung squamous cell carcinoma to pan‐cancer. BMC Med. Genom. 15(1), 114 (2022). 10.1186/s12920-022-01266-0 [DOI] [PMC free article] [PubMed] [Google Scholar]
- 21. Martelletti, E. , et al.: Synaptojanin2 mutation causes progressive high‐frequency hearing loss in mice. Front. Cell. Neurosci. 14, 561857 (2020). 10.3389/fncel.2020.561857 [DOI] [PMC free article] [PubMed] [Google Scholar]
- 22. Vázquez‐Carretero, M. , et al.: The Synaptojanins in the murine small and large intestine. J. Bioenerg. Biomembr. 48(6), 569–579 (2016). 10.1007/s10863-016-9689-1 [DOI] [PubMed] [Google Scholar]
- 23. Planchart, A. : Analysis of an intronic promoter within Synj2. Biochem. Biophys. Res. Commun. 440(4), 640–645 (2013). 10.1016/j.bbrc.2013.09.115 [DOI] [PMC free article] [PubMed] [Google Scholar]
- 24. Csolle, M. , et al.: PTEN and other PtdIns(3,4,5)P lipid phosphatases in breast cancer. Int. J. Mol. Sci. 21(23), 9189 (2020). 10.3390/ijms21239189 [DOI] [PMC free article] [PubMed] [Google Scholar]
- 25. Manji, S. , et al.: A mutation in synaptojanin 2 causes progressive hearing loss in the ENU‐mutagenised mouse strain Mozart. PLoS One 6(3), e17607 (2011). 10.1371/journal.pone.0017607 [DOI] [PMC free article] [PubMed] [Google Scholar]
- 26. Luciano, M. , et al.: Longevity candidate genes and their association with personality traits in the elderly. Am. J. Med. Genet. Part B, Neuropsychiatric genetics : the official publication of the International Society of Psychiatric Genetics 159B(2), 192–200 (2012). 10.1002/ajmg.b.32013 [DOI] [PMC free article] [PubMed] [Google Scholar]
- 27. Lopez, L. , et al.: Evolutionary conserved longevity genes and human cognitive abilities in elderly cohorts. Eur. J. Hum. Genet. : EJHG (Eur. J. Hum. Genet.) 20(3), 341–347 (2012). 10.1038/ejhg.2011.201 [DOI] [PMC free article] [PubMed] [Google Scholar]
- 28. Chuang, Y. , et al.: Role of synaptojanin 2 in glioma cell migration and invasion. Cancer Res. 64(22), 8271–8275 (2004). 10.1158/0008-5472.can-04-2097 [DOI] [PubMed] [Google Scholar]
- 29. Ben‐Chetrit, N. , et al.: Synaptojanin 2 is a druggable mediator of metastasis and the gene is overexpressed and amplified in breast cancer. Sci. Signal. 8(360), ra7 (2015). 10.1126/scisignal.2005537 [DOI] [PubMed] [Google Scholar]
- 30. Roesli, C. , et al.: Comparative analysis of the membrane proteome of closely related metastatic and nonmetastatic tumor cells. Cancer Res. 69(13), 5406–5414 (2009). 10.1158/0008-5472.can-08-0999 [DOI] [PubMed] [Google Scholar]
- 31. He, R. , et al.: LPCAT1 overexpression promotes the progression of hepatocellular carcinoma. Cancer Cell Int. 21(1), 442 (2021). 10.1186/s12935-021-02130-4 [DOI] [PMC free article] [PubMed] [Google Scholar]
- 32. Li, G. , et al.: Laryngeal squamous cell carcinoma: clinical significance and potential mechanism of cell division cycle 45. Cancer Biother. Radiopharm. 37(4), 300–312 (2022). 10.1089/cbr.2020.4314 [DOI] [PubMed] [Google Scholar]
- 33. Zhang, H. , et al.: Overexpression of cyclin‐dependent kinase 1 in esophageal squamous cell carcinoma and its clinical significance. FEBS open bio 11(11), 3126–3141 (2021). 10.1002/2211-5463.13306 [DOI] [PMC free article] [PubMed] [Google Scholar]
- 34. Huang, W. , et al.: The indication of poor prognosis by high expression of ENO1 in squamous cell carcinoma of the lung. Journal of oncology 2021, 9910962–9911011 (2021). 10.1155/2021/9910962 [DOI] [PMC free article] [PubMed] [Google Scholar]
- 35. Miranda‐Filho, A. , et al.: Thyroid cancer incidence trends by histology in 25 countries: a population‐based study. Lancet Diabetes Endocrinol. 9(4), 225–234 (2021). 10.1016/s2213-8587(21)00027-9 [DOI] [PubMed] [Google Scholar]
- 36. Kim, J. , Gosnell, J. , Roman, S. : Geographic influences in the global rise of thyroid cancer. Nat. Rev. Endocrinol. 16(1), 17–29 (2020). 10.1038/s41574-019-0263-x [DOI] [PubMed] [Google Scholar]
- 37. Todorović, L. , Stanojević, B. : VHL tumor suppressor as a novel potential candidate biomarker in papillary thyroid carcinoma. Bosn. J. Basic Med. Sci. (2022). 10.17305/bjbms.2022.7850 [DOI] [PMC free article] [PubMed] [Google Scholar]
- 38. Qingguo, D. , et al.: SYNJ2 variant rs9365723 is associated with colorectal cancer risk in Chinese Han population. Int. J. Biol. Markers 31(2) (2015) [DOI] [PubMed] [Google Scholar]
- 39. Chitra, S. , Mark, S.C. : Identification of novel lipid metabolic biomarkers associated with poor adrenocortical carcinoma prognosis using integrated bioinformatics. Surgery 171(1) (2021) [DOI] [PubMed] [Google Scholar]
- 40. Xiaoyu, G. , et al.: Identification of survival‐related metabolic genes and a novel gene signature predicting the overall survival for patients with uveal melanoma. Ophthalmic Res. 65(5), 516–528 (2022). 10.1159/000524505 [DOI] [PubMed] [Google Scholar]
- 41. Wang, Y. , et al.: Efficacy of epi‐1 modified epirubicin and curcumin encapsulated liposomes targeting‐EpCAM in the inhibition of epithelial ovarian cancer cells. J. Liposome Res. 33(2), 1–17 (2022). 10.1080/08982104.2022.2153138 [DOI] [PubMed] [Google Scholar]
- 42. Oladejo, M. , et al.: Listeria‐based immunotherapy directed against CD105 exerts anti‐angiogenic and anti‐tumor efficacy in renal cell carcinoma. Front. Immunol. 13, 1038807 (2022). 10.3389/fimmu.2022.1038807 [DOI] [PMC free article] [PubMed] [Google Scholar]
- 43. Ma, Y. , Yang, D. , Guo, P. : Circ_0000144 acts as a miR‐1178‐3p decoy to promote cell malignancy and angiogenesis by increasing YWHAH expression in papillary thyroid cancer. Journal of otolaryngology ‐ head & neck surgery = Le Journal d'oto‐rhino‐laryngologie et de chirurgie cervico‐faciale 51(1), 28 (2022). 10.1186/s40463-022-00574-w [DOI] [PMC free article] [PubMed] [Google Scholar]
- 44. Zeng, C. , et al.: Genetic alterations in papillary thyroid carcinoma with hashimotos thyroiditis: ANK3, an indolent maintainer of papillary thyroid carcinoma. Front. Oncol. 12, 894786 (2022). 10.3389/fonc.2022.894786 [DOI] [PMC free article] [PubMed] [Google Scholar]
- 45. Liu, W. , et al.: PRDM16 inhibits cell proliferation and migration via epithelial‐to‐mesenchymal transition by directly targeting pyruvate carboxylase in papillary thyroid cancer. Front. Cell Dev. Biol. 9, 723777 (2021). 10.3389/fcell.2021.723777 [DOI] [PMC free article] [PubMed] [Google Scholar]
- 46. Gupta, R. , et al.: Peroxisome proliferator‐activated receptor gamma and transforming growth factor‐beta pathways inhibit intestinal epithelial cell growth by regulating levels of TSC‐22. J. Biol. Chem. 278(9), 7431–7438 (2003). 10.1074/jbc.m208076200 [DOI] [PubMed] [Google Scholar]
- 47. Huser, C. , et al.: TSC‐22D1 isoforms have opposing roles in mammary epithelial cell survival. Cell Death Differ. 17(2), 304–315 (2010). 10.1038/cdd.2009.126 [DOI] [PubMed] [Google Scholar]
- 48. Dong, C. , et al.: IGFBP5 increases cell invasion and inhibits cell proliferation by EMT and Akt signaling pathway in Glioblastoma multiforme cells. Cell Div. 15(1), 4 (2020). 10.1186/s13008-020-00061-6 [DOI] [PMC free article] [PubMed] [Google Scholar]
- 49. Wang, J. , et al.: Insulin‐like growth factor binding protein 5 (IGFBP5) functions as a tumor suppressor in human melanoma cells. Oncotarget 6(24), 20636–20649 (2015). 10.18632/oncotarget.4114 [DOI] [PMC free article] [PubMed] [Google Scholar]
- 50. Li, Y. , et al.: γ‐Glutamyl cyclotransferase contributes to tumor progression in high grade serous ovarian cancer by regulating epithelial‐mesenchymal transition via activating PI3K/AKT/mTOR pathway. Gynecol. Oncol. 149(1), 163–172 (2018). 10.1016/j.ygyno.2018.01.023 [DOI] [PubMed] [Google Scholar]
- 51. Xu, S. , et al.: γ‐Glutamyl cyclotransferase contributes to endometrial carcinoma malignant progression and upregulation of PD‐L1 expression during activation of epithelial‐mesenchymal transition. Int. Immunopharm. 81, 106039 (2020). 10.1016/j.intimp.2019.106039 [DOI] [PubMed] [Google Scholar]
- 52. Pani, F. , et al.: The immune landscape of papillary thyroid cancer in the context of autoimmune thyroiditis. Cancers 14(17), 4287 (2022). 10.3390/cancers14174287 [DOI] [PMC free article] [PubMed] [Google Scholar]
- 53. Nakazawa, T. , et al.: Expression of T‐cell immunoreceptor with immunoglobulin and tyrosine‐based inhibitory motif domains (TIGIT) in anaplastic thyroid carcinoma. BMC Endocr. Disord. 22(1), 204 (2022). 10.1186/s12902-022-01113-4 [DOI] [PMC free article] [PubMed] [Google Scholar]
Associated Data
This section collects any data citations, data availability statements, or supplementary materials included in this article.
Supplementary Materials
Table S1
Figure S1
Figure S2
Figure S3
Data Availability Statement
All data covered in this study were included in the manuscript.


