

Abstract
The evolution of T cell molecular signatures in the distal lung of patients with severe pneumonia is understudied. Here, we analyzed T cell subsets in longitudinal bronchoalveolar lavage fluid samples from 273 patients with severe pneumonia, including unvaccinated patients infected with SARS-CoV-2, or with respiratory failure not linked to pneumonia. In patients with SARS-CoV-2 pneumonia, activation of interferon signaling pathways, low activation of the NF-κB pathway and preferential targeting of spike and nucleocapsid proteins early after intubation were associated with favorable outcomes, while loss of interferon signaling, activation of NF-κB-driven programs and specificity for the ORF1ab complex late in disease were associated with mortality. These results suggested that in patients with severe SARS-CoV-2 pneumonia, alveolar T cell interferon responses targeting structural SARS-CoV-2 proteins characterized patients who recovered, while responses against non-structural proteins and activation of NF-κB were associated with poor outcomes.
Severe pneumonia due to SARS-CoV-2 is responsible for the bulk of the acute morbidity and mortality caused by the COVID-19 pandemic1. Compared to patients with pneumonia secondary to other pathogens, patients with severe SARS-CoV-2 pneumonia experience prolonged episodes of respiratory failure2. A systems biology approach that included data generated from bronchoalveolar lavage (BAL) sampling of the importance of T cells in the immune response to SARS-CoV-23,4. Most longitudinal data investigating the T cell response to SARS-CoV-2 has been limited to analysis of peripheral blood samples and suggest that a coordinated response between interferon (IFN)-producing innate and adaptive immune cells drives viral clearance in patients with less severe COVID-19, while older patients with more severe disease exhibit excessive T cell responses5. Whether these responses reflect those in the alveolar space and whether the alveolar T cell responses in SARS-CoV-2 pneumonia are similar to pneumonia caused by other pathogens is currently unknown.
Here we examined alveolar T cell responses in 432 BAL fluid samples collected longitudinally over the course of mechanical ventilation from 273 patients with severe pneumonia, 74 of which had SARS-CoV-2 pneumonia, or with respiratory failure not caused by pneumonia. Compared to similarly ill patients with non-SARS-CoV-2 etiologies of pneumonia and respiratory failure, higher abundance of T cell subsets that expressed IFN-related gene signatures and targeted structural SARS-CoV-2 proteins (spike and nucleocapsid) associated with survival to hospital discharge, whereas a T cell activation profile dominated by a TNF-NF-κB inflammatory signature and enrichment in SARS-CoV-2 ORF1ab antigen specificity associated with mortality in patients with severe SARS-CoV-2 pneumonia. These findings suggested a pattern and evolution of alveolar T cell responses that may drive clinical outcomes in severe SARS-CoV-2 pneumonia.
Results
BAL T cell enrichment associates with favorable outcomes
The SCRIPT (successful clinical response in pneumonia therapy) study is a prospective, single-center observational cohort study of mechanically ventilated patients who undergo lower respiratory tract sampling with at least one clinically-indicated BAL procedure to evaluate known or suspected pneumonia as part of routine clinical care. We obtained clinical BAL fluid samples from 337 patients who consented to enroll in SCRIPT between June 2018 and August 2020. During this period, 273 of the 337 participants (81%) had at least one BAL sample analyzed with flow cytometry; these 273 participants are referred to here as the SCRIPT cohort (Extended Data Fig. 1a–c). Eighty-seven out of 273 (31.9%) study participants died in the hospital (hereafter, deceased) and 68.1% were alive at the time of hospital discharge (hereafter, discharged) (Extended Data Table 1a). Patients were not followed after hospital discharge. Overall, the median ICU length of stay was 13 days (IQR 6.0, 23.0), and the mediation duration of mechanical ventilation was 10 days (IQR 4.0, 22.0) (Extended Data Table 1a). Of the 273 participants, 33 had a non-pneumonia etiology for respiratory failure (most often due to aspiration, cardiogenic pulmonary edema, or atelectasis; median age 62.0 years [IQR 42.0, 70.0], 48.5% female; 30.3% deceased; hereafter, non-pneumonia control [NPC]). The 240 patients diagnosed with pneumonia included 133 with pneumonia due to a bacterial pathogen (median age 65.0 years [IQR 51.0, 72.0], 41.4% female; 35.3% deceased; hereafter, other pneumonia [OP]), 74 with SARS-CoV-2 pneumonia, with or without bacterial superinfection (median age 58.5 years [IQR 44.5, 66.8], 31.1% female; 25.7% deceased; hereafter, SARS-CoV-2-P), and 33 with pneumonia due to other viruses, with or without bacterial superinfection (median age 60.0 years [IQR 55.0, 69.0], 42.4% female; 33.3% deceased; hereafter, other viral pneumonia [OVP]), none of which were vaccinated against SARS-CoV-2 (Extended Data Table 1a,b). Some de-identified clinical information from this cohort has been published on PhysioNet5, and some of these patients have been included in other publications2,3,6,7. Demographics, body mass index and the severity of illness as measured by sequential organ failure assessment (SOFA) score and acute physiology score (APS) were similar across groups (Extended Data Table 1a). Patients with SARS-CoV-2-P had nominally lower rates of common comorbidities than the overall cohort (Extended Data Table 1a). 46.1% of SARS-CoV-2-P samples and 38.6% of OVP samples (p = 0.603, Fisher exact test) indicated a bacterial superinfection, defined as a BAL-confirmed bacterial infection co-occurring with a viral pathogen8. Because most samples were collected before the first randomized controlled trial that demonstrated efficacy of corticosteroids in patients with COVID-19 (RECOVERY trial)9, the administration of corticosteroids was not systematically guided by diagnosis (Extended Data Table 1a). One-third of the cohort was received in external transfer from an outside hospital (Extended Data Table 1a).
Flow cytometry analysis of BAL fluid was available for 432 (n=36 NPC, n=187 OP, n=165 SARS-CoV-2-P, n=44 OVP) out of 480 (79.1%) samples obtained from the 273 participants (Fig. 1a and Extended Data Fig. 1b,c)3. The median number of BAL samples obtained per patient was 1 (IQR 1–2); 92 out of 273 (33.7%) patients underwent more than one BAL. Because pneumonias diagnosed by BAL sampling within the first 48 hours of mechanical ventilation reflect infections acquired before the initiation of mechanical ventilation10, we stratified the timing of BAL sampling into early (≤48 hours following intubation, n=148 samples) and late (>48 hours following intubation, n=284 samples) categories. Hierarchical clustering performed on the normalized abundance of BAL fluid cell populations indicated a distinctive enrichment in CD3ε+ T cells (hereafter T cells), including CD8+ and CD4+ T cells and regulatory CD3ε+CD4+CD25+CD127−T cells (Treg cells), and HLA-DR+CD4+CD206− monocytes (hereafter monocytes) in SARS-CoV-2-P, compared to NPC, OP and OVP, irrespective of bacterial superinfection status (Fig. 1b, Extended Data Fig. 2a–e, Supplementary Data 1). CD206+ macrophages (hereafter macrophages) were enriched in NPC compared with OP and SARS-CoV-2-P, while CD15+ neutrophil (hereafter neutrophils) frequency was higher in OP compared with NPC, SARS-CoV-2-P and OVP (Extended Data Fig. 2f,g). The proportion of T cells—including CD4+ T cells, CD8+ T cells and Treg cells—and monocytes was lower and the proportion of neutrophils was higher in SARS-CoV-2-P in late samples compared to early samples (Fig. 1c,d and Extended Data Fig. 2h–p), while the proportion of macrophages was higher in early NPC compared to early OP (Extended Data Fig. 2q–r).
Fig. 1. BAL T cell enrichment is associated with clinical outcome in SARS-CoV-2-P.

(a) Alluvial diagram showing multi-step analysis of BAL samples with flow cytometry (n=432 samples (NPC [n=36], OP [n=187], SARS-CoV-2-P [n=165] and OVP [n=44]), bulk RNA-seq (n=336 samples; NPC [n=38], OP [n=51], SARS-CoV-2-P [n=200] and OVP [n=47]) and bulk TCR-seq (n=130 samples; NPC [n=13], OP [n=16], SARS-CoV-2-P [n=73] and OVP [n=28]). (b) Flow cytometry analysis of BAL immune cell subset composition of CD3ε+CD4+ T cells, CD3ε+CD8+ T cells, CD3ε+CD4+CD25+CD127− Treg cells, HLA-DR+CD4+CD206− monocytes, CD206+ macrophages, and CD15+ neutrophils indicating whether a given patient was discharged or deceased, the duration of mechanical ventilation (range 0–110 days; blanks indicate chronically ventilated patients), and presence (superinfection) or absence of bacterial infection. VAP (ventilator-associated pneumonia) designates samples from NPC or patients with SARS-CoV-2-P or OVP who cleared the virus and then developed bacterial pneumonia. Each column represents a BAL sample. Samples were clustered using Euclidean distance and Ward’s minimum variance linkage method. (c) Percentage of T cells between early (≤48 hours following intubation, n=148) and late (>48 hours following intubation, n=284) in NPC, OP, SARS-CoV-2-P and OVP samples (q < 0.05, pairwise Wilcoxon rank-sum tests with FDR correction). (d) Spearman correlation analysis between the percentage of BAL T cells and the duration of mechanical ventilation in flow cytometry samples as in a, by diagnosis. (e,f) Comparison of the frequency of T cells between patients who were discharged or deceased (e) or sampled early or late (f) as in a (q < 0.05, pairwise Wilcoxon rank-sum tests with FDR correction). (g) Correlation analysis between the percentage of BAL immune cell subsets (CD4+ T cells, CD8+ T cells, Treg cells, monocytes, macrophages and neutrophils) and clinical, physiological and laboratory variables in SARS-CoV-2-P samples with Spearman rank correlation coefficient and FDR correction (q < 0.05 [*], q < 0.01 [**] and q < 0.001 [***]).
Abbreviations: PaCO2, partial arterial carbon dioxide pressure; HCO3, bicarbonate; days on MV, days on mechanical ventilation; WBC, peripheral white blood cells; SOFA, Sequential Organ Failure Assessment; CK, creatine kinase; LDH, lactate dehydrogenase; FiO2, fraction of inspired oxygen; CRP, C-reactive protein; P/F, ratio of partial arterial oxygen pressure to fraction of inspired oxygen; COPD, chronic obstructive pulmonary disease; AST, aspartate aminotransferase; PaO2, partial arterial oxygen pressure; Vte, minute ventilation; BMI, body mass index; PEEP, positive end-expiratory pressure.
We next examined the association between discharged versus deceased status and the frequency of immune cell subsets in BAL fluid. The abundance of T cells—including CD4+ T cells, CD8+ T cells and Treg cells—positively associated with discharged status in SARS-CoV-2-P (Fig. 1e and Extended Data Fig. 3a–c). In contrast to reports in endotracheal tube washes11, we observed a positive association between discharged status and the overall abundance of macrophages, but not monocytes, in SARS-CoV-2-P (Extended Data Fig. 3d,e). Persistence of T cells—including CD4+ T cells, CD8+ T cells and Treg cells—and monocytes in BAL fluid over the course of mechanical ventilation was associated with discharged status, whereas a decrease in the abundance of T cells and macrophages was associated with deceased status in SARS-CoV-2-P (Fig. 1f and Extended Data Fig. 3f–j). We found an inverse association between BAL fluid neutrophilia and discharged status in SARS-CoV-2-P (Extended Data Fig. 3k). Patients with SARS-CoV-2-P in the deceased group had increased neutrophilia in late samples (median 73.5% of total cells [IQR 45.9–90.6]) compared to patients with SARS-CoV-2-P in the discharged group (median 54% of total cells [IQR 20.5–86.4]) (Extended Data Fig. 3l). Enrichment of BAL fluid neutrophils positively correlated with procalcitonin, troponin, D-dimer, steroid administration, severity of illness, driving pressure, duration of mechanical ventilation, presence of superinfection and deceased status in SARS-CoV-2-P (Fig. 1g), but not in NPC, OP and OVP (Extended Data Fig. 4a–c), while CD4+ T cell, CD8+ T cell and Treg cell enrichment in BAL fluid over the course of mechanical ventilation was associated with favorable clinical parameters, including respiratory system compliance, in SARS-CoV-2-P (Fig. 1g). Resolution of pneumonia based on expert clinical adjudication8 was associated with discharged status in SARS-CoV-2-P (Extended Data Fig. 4d,e).
Consistent with reports that expression of CD127 (IL-7 receptor) correlates with less severe disease and better outcomes, while expression of HLA-DR correlates with worsened disease severity and poorer outcomes in SARS-CoV-2-P12,13,14, we found that expression of CD127 on BAL fluid CD8+ T cells negatively correlated with severity of illness measured by SOFA score and duration of mechanical ventilation, while HLA-DR expression positively correlated with D-dimer, among other variables (Extended Data Fig. 4f,g). Thus, enrichment in T cell subsets in SARS-CoV-2-P predicted favorable clinical outcomes, including lower illness severity, shorter duration of mechanical ventilation and less hospital mortality.
Early IFN signatures associate with discharge
Next, sorted CD8+ T cells, CD4+ T cells and Treg cells with sufficient high-quality RNA (336 samples from 113 patients as shown in Fig. 1a and Extended Data Fig. 1c) were analyzed by bulk RNA-sequencing (Extended Data Fig. 5a–f, Supplementary Data 2, 3, 4, 5). We identified 975 and 866 differentially expressed genes in CD8+ T cells and CD4+ T cells, respectively (FDR q < 0.05) between NPC, OP, SARS-CoV-2-P and OVP (Fig. 2a). K-means clustering with K = 2 revealed genes in both CD8+ and CD4+ T cells that distinguished SARS-CoV-2-P from NPC, OP and OVP (Fig. 2a and Supplementary Data 6a–d). Within CD8+ T cells, cluster 1_CD8 contained genes (mostly upregulated in SARS-CoV-2-P) involved in cell proliferation (e.g., MKI67), monocyte and T cell migration (CCL2, CCL3, CCR1), tissue residency (ITGA1) and immune cell inhibition (CTLA4, LAG3, ENTPD1) (Extended Data Fig. 5g). Cluster 1_CD4 in CD4+ T cells (mostly upregulated in SARS-CoV-2-P) contained genes associated with cell proliferation (MKI67), immune cell activation (IFI6, IFI44, GZMB), co-inhibitory molecules (PDCD1, LAG3), markers of tissue resident-memory/effector-memory T cells (LGALS3, WARS) and monocyte and B cell chemoattractants (CCL3, CCL4, CCL5, CXCL13) (Extended Data Fig. 5g). In CD8+ and CD4+ T cells, genes in cluster 2 (cluster 2_CD8 and cluster 2_CD4, respectively), which were mostly downregulated in SARS-CoV-2-P, were associated with a resting or quiescent T cell program characteristic of naïve or central-memory T cells (TCM cells), such as LEF1 and IL7R (Fig. 2a). Gene ontology (GO) analysis of the biological processes associated with cluster 1_CD8 and cluster 1_CD4 and gene set enrichment analysis (GSEA) on the pairwise comparison between SARS-CoV-2-P and the combined NPC, OP and OVP groups, as well as between SARS-CoV-2 and OVP, indicated that genes upregulated in SARS-CoV-2-P (cluster 1_CD8 and cluster 1_CD4) were associated with T cell proliferation, heightened immune cell activation typified by an enriched interferon γ (IFN-γ) and TNF signature, vascular-specific pathways and co-inhibitory markers (Fig. 2b, Extended Data Fig. 5h–j, Supplementary Data 7 and Supplementary Data 8a–f).
Fig. 2. BAL T cell IFN and NF-κB responses are associated with discharged and deceased status, respectively.

(a) K-means clustering of 975 differentially expressed genes (DEG) (q < 0.05, likelihood-ratio test with FDR correction) between NPC (n=15), OP (n=15), SARS-CoV-2-P (n=72) and OVP (n=23) in CD8+ T cell samples (top) and 866 differentially expressed genes between NPC (n=14), OP (n=23), SARS-CoV-2-P (n=81) and OVP (n=20) in CD4+ T cell samples (bottom) from discharged or deceased patients on mechanical ventilation (range 0–90 days, blanks indicate chronically ventilated patients), with or without superinfection. VAP (ventilator-associated pneumonia) designates samples from NPC or patients with SARS-CoV-2-P or OVP who cleared the virus and then developed bacterial pneumonia. Columns represent unique samples. Samples were clustered using Euclidean distance and Ward’s minimum variance linkage method. Cluster 1_CD8 (595 DEG), Cluster 2_CD8 (380 DEG), Cluster 1_CD4 (552 DEG) and Cluster 2_CD4 (314 DEG). Representative genes are shown for each cluster. (b) Gene set enrichment analysis (GSEA) of Hallmark gene sets for the pairwise comparison between SARS-CoV-2-P samples and NPC, OP and OVP samples combined in CD8+ T cells (top) and CD4+ T cells (bottom) as in a. Count denotes pathway size after removing genes not detected in the expression dataset. Enrichment denotes significant (q < 0.25 with FDR correction) upregulated (red) and downregulated (blue) pathways by normalized enrichment score. (c) GSEA of genes from SARS-CoV-2-P CD8+ T cells samples (n=72) ranked by Spearman correlation with deceased status as in b. (d) Violin plot of normalized expression values for selected core genes (TNFAIP3, NR4A3) revealed by leading edge analysis driving pathway enrichment signal in c (pairwise Wilcoxon rank-sum tests). (e) GSEA of genes from SARS-CoV-2-P CD8+ T cells samples (n=72) ranked by Spearman correlation with the duration of mechanical ventilation. (f) Correlation analysis of normalized expression for selected core genes (NR4A3, TNFAIP3, IFI44, MKI67) revealed by leading edge analysis as in e, against the duration of mechanical ventilation in SARS-CoV-2-P CD8+ T cells samples (n=72). Shaded area represents 95% CI. (g) GSEA of genes from SARS-CoV-2-P CD4+ T cells (n=81) ranked by Spearman correlation with deceased status as in b. (h) Violin plot of normalized expression values for selected core genes (BATF, IRF4) revealed by leading edge analysis driving pathway enrichment signal in g (pairwise Wilcoxon rank-sum tests). (i) GSEA of genes from SARS-CoV-2-P CD4+ T cells ranked by Spearman correlation with the duration of mechanical ventilation (left) or respiratory system compliance (right). (j) Correlation analysis of selected leading edge gene (IFI44L) against duration of mechanical ventilation and (XAF1) against respiratory system compliance in SARS-CoV-2-P CD4+ T cells samples (n=81). Shaded area represents 95% CI.
Correlation analyses between differentially expressed genes in BAL CD8+ and CD4+ T cells and clinical variables, followed by GSEA with leading edge analysis, indicated that T cells from patients with SARS-CoV-2-P with poor outcomes showed upregulation of processes linked to inflammatory responses and TNF-NF-κB signaling and downregulation of processes associated with cell proliferation and IFN signaling (Fig. 2c–j, Fig. 3a–h). Conversely, higher respiratory system compliance was associated with higher expression of cell proliferation and IFN-related signatures and downregulation of signatures linked to TNF-NF-κB signaling (Fig. 2i,j and Fig. 3i,j). We observed higher expression of genes involved in IFN-mediated signaling (IFI44, IFI44L and IFIT family genes) in early compared to late BAL CD4+ and CD8+ T cells in SARS-CoV-2-P (Fig. 4a,b). Longitudinal analysis in combined CD8+ and CD4+ T cells also showed higher expression of IFN-stimulated genes (IFI44, IFI44L and IFIT family genes) in early compared to late SARS-CoV-2-P (Fig. 4c). Viral loads were higher in early compared with late samples in SARS-CoV-2-P (Fig. 4d). Deceased patients with SARS-CoV-2-P had higher initial viral loads, with a slower decline, compared to discharged patients (Spearman R = −0.45 versus −0.71) (Fig. 4e).
Fig 3. BAL T cell NF-κB responses are associated with superinfection and worsened severity of illness.

(a,b) GSEA of genes from SARS-CoV-2-P CD4+ T cells samples (n=81) ranked by Spearman correlation with superinfection status (a) and SOFA score (b). Count denotes pathway size after removing genes not detected in the expression dataset. Enrichment denotes significant (q < 0.25 with FDR correction) upregulated (red) and downregulated (blue) pathways by normalized enrichment score. (c) Violin plot of normalized expression values for selected core gene (TGFBI) revealed by leading edge analysis driving pathway enrichment signal in a (pairwise Wilcoxon rank-sum tests). (d) Correlation analysis of normalized expression for selected core gene (FOSB) revealed by leading edge analysis in b, against SOFA score in SARS-CoV-2-P CD4+ T cells samples (n=81). Shaded area represents 95% CI. (e,f) GSEA of genes from SARS-CoV-2-P CD8+ T cells (n=72 samples) ranked by Spearman correlation with superinfection status (e) and and SOFA score (f). (g) Violin plot of normalized expression values for selected core gene (TNFRSF9, TNFAIP3, DUSP2, PLK1) revealed by leading edge analysis driving pathway enrichment signal in e. (h) Correlation analysis of normalized expression for selected core gene (TNFAIP3, NR4A3, PLK1, CDKN3) revealed by leading edge analysis in f, against SOFA score in SARS-CoV-2-P CD8+ T cells samples (n=72). (i) GSEA of genes from SARS-CoV-2-P CD8+ T cells (n=72 samples) ranked by Spearman correlation with respiratory system compliance. (j) Correlation analysis of normalized expression for selected core gene (TOP2A, XAF1, TNFAIP3, NR4A3) revealed by leading edge analysis in i, against respiratory system compliance in SARS-CoV-2-P CD8+ T cells samples (n=72). Shaded area represents 95% CI.
Fig 4. IFN signaling dominates the early BAL T cell response in SARS-CoV-2-P.

(a) RNA-seq of CD4+ T cells comparing early (n=18) versus late (n=63) samples (top) and CD8+ T cell early (n=17) versus late (n=55) samples (bottom) from 46 patients with SARS-CoV-2-P. Significantly upregulated genes in early samples are shown in red, and significantly upregulated genes in late samples are shown in blue (q < 0.05, likelihood-ratio tests with FDR correction). Genes shown in gray are not significantly differentially expressed. Representative significant genes are annotated. (b) Longitudinal analysis of IFN-stimulated genes in combined CD4+ and CD8+ T cells in SARS-CoV-2-P (n=153 samples from n=52 patients) discharged or deceased, with or without superinfection. Severity of illness (SOFA score), cumulative steroid dose (mg of hydrocortisone), C-reactive protein (CRP), D-dimer, viral load (Ct value) and ordered by duration of mechanical ventilation are indicated. Columns represent unique T cell samples. Blanks indicate missing values. (c) Comparison of SARS-CoV-2 viral load (Ct value) in discharged versus deceased and early versus late sampling in SARS-CoV-2-P samples (n=46; q < 0.05, pairwise Wilcoxon rank-sum tests with FDR correction). (d) Bar plot showing the number of discharged versus deceased and early versus late SARS-CoV-2-P with a Ct value above the limit of detection (>40). (e) Correlation analysis of SARS-CoV-2 Ct values and duration of mechanical ventilation in discharged versus deceased SARS-CoV-2-P with Spearman rank correlation coefficient. Shaded area represents 95% CI.
Because Treg cells were reported to populate the alveolar space following virus-induced lung injury and to orchestrate tissue-protective and reparative processes15, we performed K-means clustering of 80 differentially expressed genes in BAL Treg cells (FDR q < 0.05) and identified two clusters (cluster 1_Treg and cluster 2_Treg) that separated SARS-CoV-2-P from NPC, OP and OVP (Extended Data Fig. 6a). In BAL Treg cells, GSEA of the pairwise comparison between SARS-CoV-2-P and the combined OP and OVP groups found enrichment of processes linked to cell proliferation (e.g., G2M CHECKPOINT) (Extended Data Fig. 6b), while comparison of SARS-CoV-2-P to OVP found enrichment in IFN signaling (INTERFERON ALPHA RESPONSE, INTERFERON GAMMA RESPONSE) (Extended Data Fig. 6c).
As most lung T cells are resident-memory T cells (TRM cells), which were suggested to play a protective role in mouse models of SARS-CoV infection and lung fluid samples from patients with severe SARS-CoV-2-P11,16, we leveraged a published single-cell RNA-sequencing dataset of BAL fluid obtained from 10 patients with severe pneumonia3 to perform in silico cell-type deconvolution of the bulk RNA-seq analysis of BAL T cells. For the deconvolution analysis, cell types are reported as defined by the single-cell cluster annotations in reference3. The majority (56.75%) of BAL CD8+ and CD4+ T cells in NPC, OP, SARS-CoV-2-P and OVP were memory T cells and TRM cells (63.4%, IQR 46–77) (Extended Data Fig. 6d–i). In BAL CD8+ T cells from SARS-CoV-2-P, CD8+ TRM cells remained elevated irrespective of clinical outcome or timing of sampling (Extended Data Fig. 6f). In SARS-CoV-2-P, BAL TCM cells (50.1% [IQR 14–48]) and Treg cells (43.6% [IQR 29–71]) were more abundant than cytotoxic CD4+ T cells (0% [IQR 0–2]) and proliferating CD4+ T cells (0% [IQR 0–4] (Extended Data Fig. 6i). Collectively, transcriptional profiling of CD8+ and CD4+ T cell subsets revealed that expression of IFN-stimulated genes associated with discharge, whereas a T cell activation profile dominated by a TNF-NF-κB inflammatory signature associated with hospital mortality in patients with severe SARS-CoV-2-P.
TCR repertoires are specific to pneumonia etiology
The specificity and complexity of T cell responses is determined by the T cell antigen receptor (TCR). As such, we performed bulk TCR-seq on 130 BAL CD8+ T cell (n=7 NPC, n=8 OP, n=36 SARS-CoV-2-P, n=15 OVP) and CD4+ T cell (n=6 NPC, n=8 OP, n=37 SARS-CoV-2-P, n=13 OVP) samples from 47 patients (NPC n=8, 50% female, 7.2 median [IQR 5.1–9.9] mean SOFA score, 62.5% deceased; OP n=8, 62.5% female, 6.3 median [IQR 5.8–9.1] mean SOFA score, 37.5% deceased; SARS-CoV-2-P n=16, 37.5% female, 8.2 median [IQR 6.5–10.7] mean SOFA score, 31.3% deceased; OVP n=15, 40% female, 6.5 median [IQR 4.5–8.9] mean SOFA score, 33.3% deceased) that had sufficient residual RNA (>0.5 ng) to generate TCR-seq libraries (Fig. 1a, Extended Data Fig. 1c, Extended Data Fig. 7a–f, Supplementary Data 9, 10, 11a). Alpha diversity with clonotype richness measurement (Chao 1) within the combined BAL CD8+ and CD4+ T cells was similar across NPC, OP, SARS-CoV-2 and OVP, although there were small but statistically significant differences between early and late samples and between discharged and decreased status (Extended Data Fig. 7g–i). TCR repertoire diversity trended lower as a function of age (Extended Data Fig. 7j), similar to prior reports17,18,19. Because approximately 50% of patients with SARS-CoV-2-P develop a secondary bacterial pneumonia either as a superinfection or a de novo ventilator-associated pneumonia following viral clearance2,6, we tested whether TCR repertoire diversity would become more oligoclonal (i.e., narrow) in response to secondary bacterial pneumonias. Whereas TCR repertoire richness increased over the course of mechanical ventilation in NPC, OP and OVP, richness decreased over time in SARS-CoV-2-P (Extended Data Fig. 7k). Comparing discharged to deceased patients with SARS-CoV-2-P, we observed significantly lower TCR repertoire richness in SARS-CoV-2-P with a secondary bacterial infection (superinfection or de novo ventilator-associated pneumonia following viral clearance) compared to patients with only primary SARS-CoV-2-P (Extended Data Fig. 7l).
Next, we used the GLIPH2 (grouping of lymphocyte interactions by paratope hotspots 2) algorithm20 to computationally infer disease-relevant TCRs with predicted shared antigen specificity within the TCR sequences from BAL CD8+ T cells (CDR3β = 37,297) and BAL CD4+ T cells (CDR3β = 64,276). We applied stringent filtering criteria (Supplementary Table 1) to obtain enriched TCR clusters with the highest probability to bind similar HLA-restricted peptides across NPC, OP, SARS-CoV-2-P and OVP (Supplementary Data 11b–c). Our network analysis for CD8+ and CD4+ T cells indicated greater shared TCR sequence similarity in SARS-CoV-2-P when compared with OVP (Fig. 5a–i). Additionally, gene usage analysis indicated an enrichment of TRBV12–3/TRBV27 and TRBV20–1/TRBV6–6 with distinct associations with particular epitopes (e.g., SQA, HTT, GRC and EDL) and patient-specific HLA restrictions in CD8+ and CD4+ T cells, respectively (Extended Data Fig. 8a–h), consistent with observations in peripheral blood21.
Fig. 5. The BAL T cell response to SARS-CoV-2-P is pathogen specific.

(a) Network analysis of CD8+ TCR sequences in SARS-CoV-2-P (n=35) and OVP (n=15) samples by viral pathogen. Nodes represent unique TCR (CDR3β) sequences. Edges connect TCRs belonging to the same patterns or specificity groups. (b) As in a for SARS-CoV-2-P (n=35) and combined OVP (n=15) samples. (c) As in b for SARS-CoV-2-P samples (n=35). (d) Bar plot of proportion of inferred CD4+ T cell responses from MIRA dataset by SARS-CoV-2 protein in n=12 patients and n=22 samples. (e) Network analysis of shared CD4+ TCR sequences recognizing SARS-CoV-2 epitopes. Nodes represent SARS-CoV-2-P patients (n=12), edges represent shared TCR sequences by at least two patients mapped to a MIRA MHCII dataset epitope pool and width of edges (magnitude) denotes total number of shared TCR sequences. (f) Immunoprevalence of inferred SARS-CoV-2 epitopes (n=8) in SARS-CoV-2-P patients (n=12) represented as percentage (%) (left) and total percentage of TCR sequences inferred to recognize a given SARS-CoV-2 epitope (n=8) in SARS-CoV-2-P patients (right). * denotes other epitopes are present within MIRA MHCII dataset peptide pool. (g) Network analysis of CD4+ TCR sequences in SARS-CoV-2-P (n=36) and OVP (n=10) samples by viral pathogen. Nodes represent unique TCR (CDR3β) sequences. Edges connect TCRs belonging to the same patterns or specificity groups. (h) Network analysis of CD4+ TCR sequences in SARS-CoV-2-P (n=36) and combined OVP (n=10) samples. (i) Network analysis of CD4+ TCR sequences in SARS-CoV-2-P (n=36) samples.
To uncover potential targets of BAL CD8+ and CD4+ T cell responses to SARS-CoV-2-P, we undertook an unsupervised reverse epitope discovery approach22 to interrogate GLIPH2-enriched BAL CDR3β sequences and identify immunodominant epitope responses in SARS-CoV-2-P as well as NPC, OP and OVP. Specifically, we leveraged the MIRA (multiplex identification of antigen-specific T cell receptors assay) dataset23 to compare the BAL CD8+ and CD4+ TCR sequences in NPC, OP, SARS-CoV-2-P and OVP with more than 135,000 high-confidence SARS-CoV-2-specific CDR3β sequences and uncover putative shared epitopes. We annotated 20.3% (381 out of 1,876) of GLIPH2-enriched TCRs to the MIRA MHCI dataset and 10% (223 out of 2,227) of GLIPH2-enriched TCRs to the MIRA MHCII dataset based on identical sequence similarity (Supplementary Data 12a,b). MHCI/MHCII datasets were comprised of 269/56 target peptide pools (deconvolved to 545/251 unique epitopes) from 15/9 unique combinatorial overlapping antigenic targets of the SARS-CoV-2 proteome, respectively. We mapped TCRs from NPC, OP, SARS-CoV-2-P and OVP to 32.7% (88 out of 269) of MIRA MHCI and 25% (14 out of 56) of MIRA MHCII peptide pools (Supplementary Data 12a). Notably, in SARS-CoV-2-P, we mapped 80.6% (71 out of 88) of the MIRA MHCI and 85.7% (12 out of 14) of the MIRA MHCII peptide pools detected in NPC, OP, SARS-CoV-2-P, and OVP (Supplementary Data 12a–c), suggesting the BAL T cell response in SARS-CoV-2 pneumonia was specific compared with NPC, OP, and OVP.
We next investigated the antigen hierarchy distribution of alveolar T cells targeting the SARS-CoV-2 proteome. Computational analysis of SARS-CoV-2 antigenic targets in BAL CD8+ T cells found an overall dominance of ORF1ab (33.6%), spike (S, 21.7%) and nucleocapsid (N, 18.1%) (Fig. 6a,b). Combined, S and N accounted for 41.4% of epitopes in discharged patients with SARS-CoV-2-P, whereas ORF1ab accounted for 43.2% of epitopes in deceased patients with SARS-CoV-2-P (Fig. 6c,d). Within the ORF1ab polyprotein complex, the non-structural proteins NSP3 and NSP12 accounted for 35.1% and 22.1% of overall NSP targets in patients with SARS-CoV-2-P, without a significant association with discharged versus deceased status (Fig. 6e). 95% of TCRs recognized structural proteins (M, 44.6%; S, 30.6%; N, 19.9%) in BAL CD4+ T cells (Fig. 5f), consistent with the known bias of CD4+ T cell responses toward viral structural proteins24. BAL CD8+ T cells maintained an S- and N-specific T cell response in early and late samples from discharged patients with SARS-CoV-2-P, while they showed fewer S targets and exhibited ORF1ab immunodominance in samples from deceased patients with SARS-CoV-2-P obtained late compared with early (Fig. 6f–h). BAL CD8+ T cell epitope targets from patients with SARS-CoV-2-P who were ≤65 years-old were primarily enriched for SARS-CoV-2 structural proteins, while BAL CD8+ T cell epitope targets from deceased patients with SARS-CoV-2-P who were >65 years-old mainly targeted NSP (Fig. 6i,j). ORF1ab was the immunodominant antigen in deceased patients >65 years-old with SARS-CoV-2-P (Fig. 6i,j).
Fig. 6. BAL CD8+ T cells targeting non-structural proteins associate with deceased status.
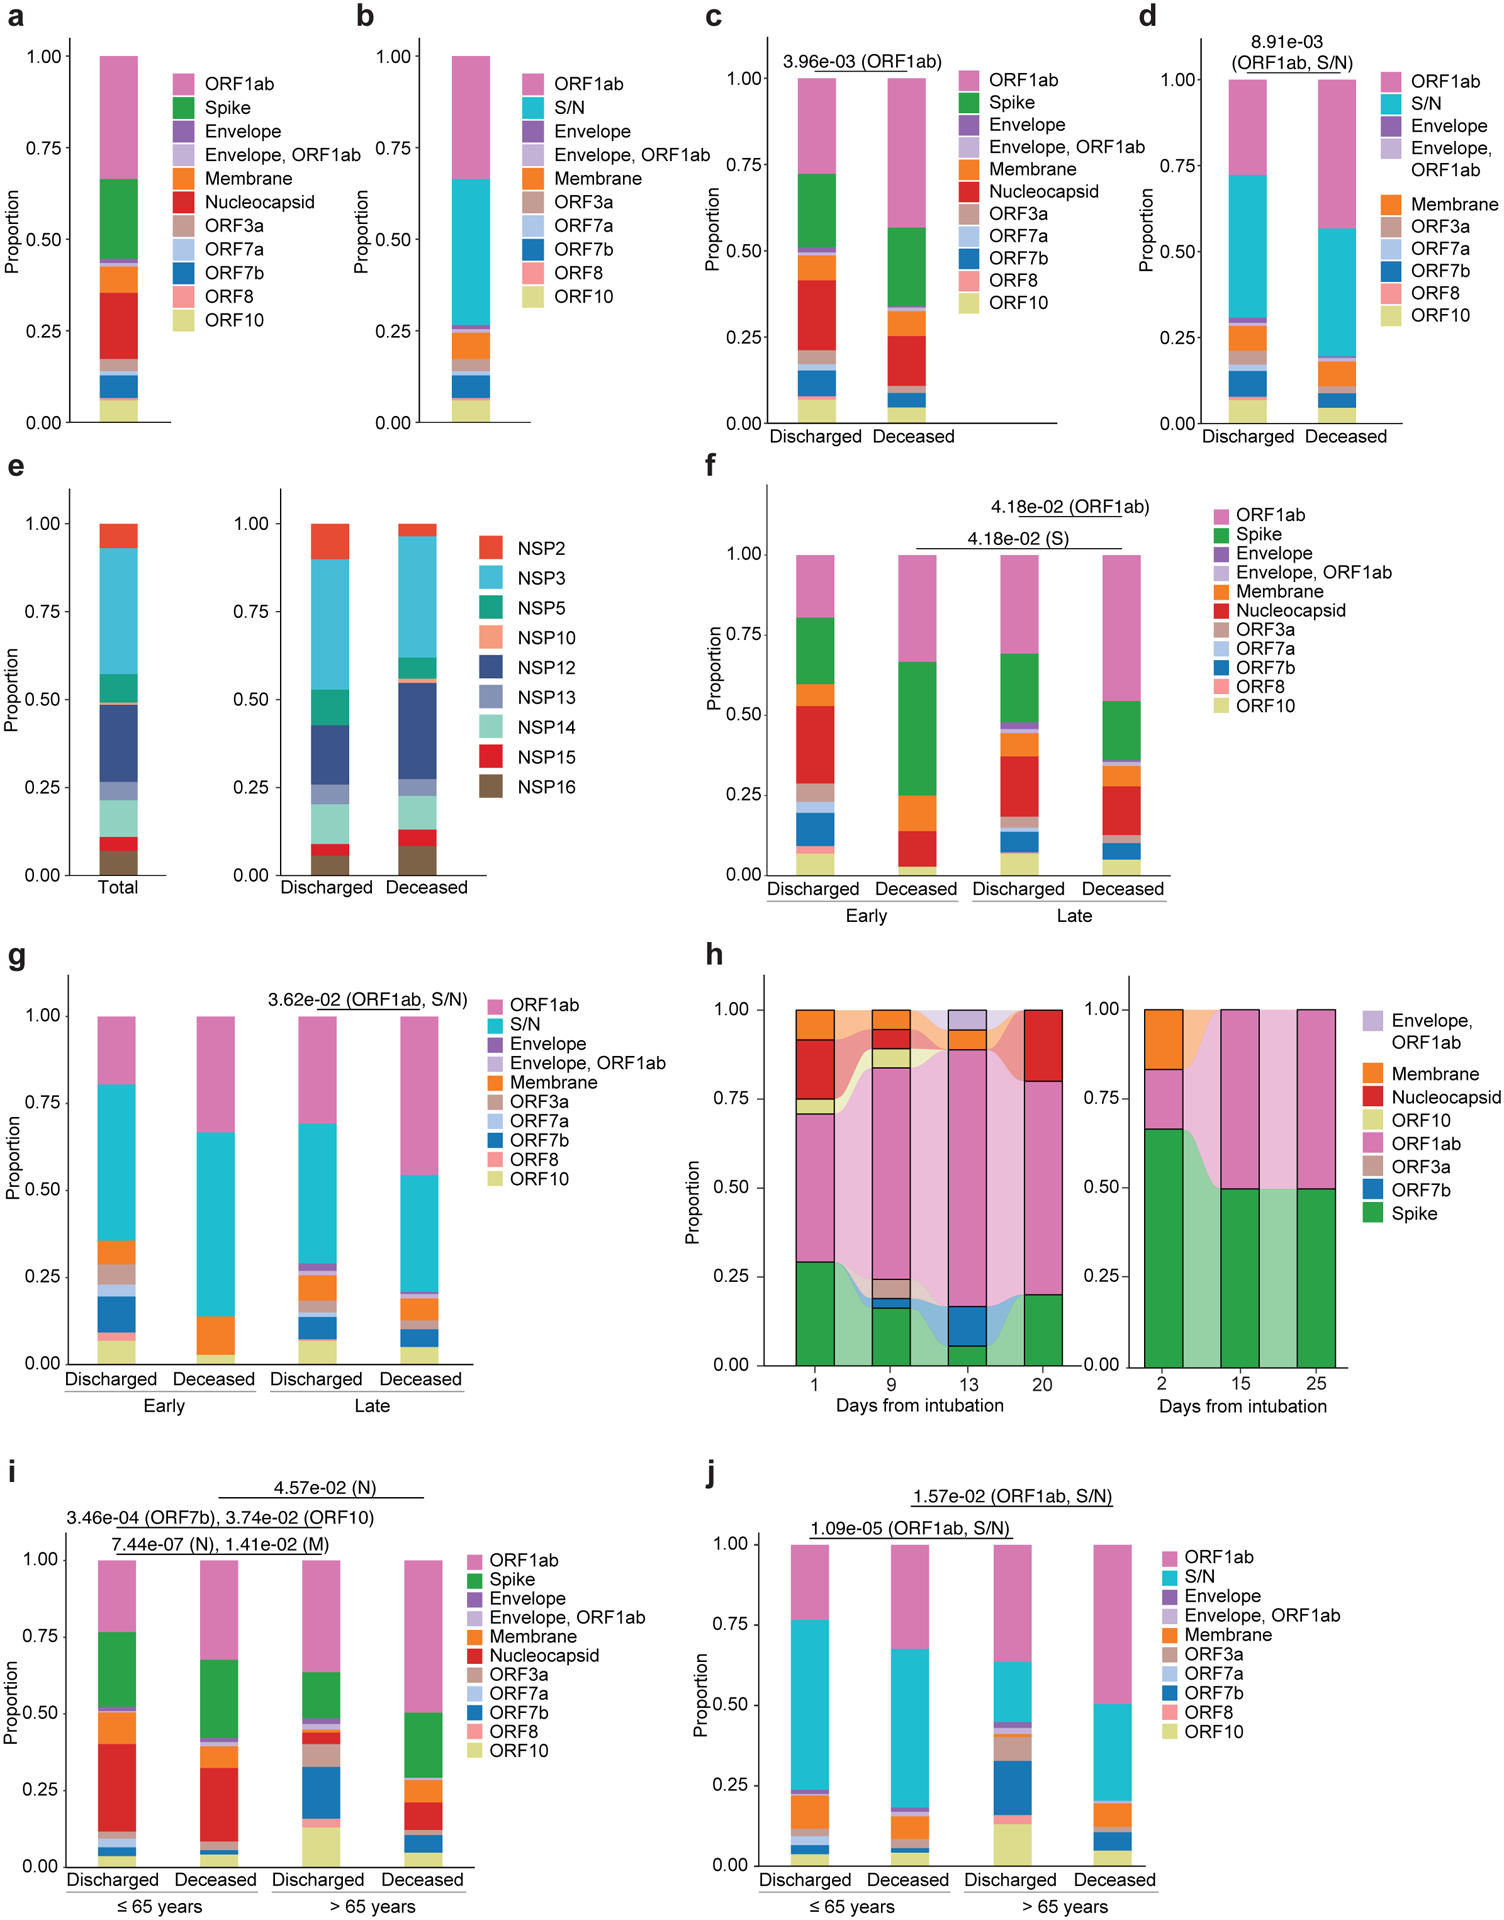
(a) Proportion of CD8+ T cell inferred antigen targets by SARS-CoV-2 protein in n=14 patients and n=29 samples. (b) Proportion of CD8+ T cell inferred antigen targets by SARS-CoV-2 protein, with grouping of Spike and Nucleocapsid (S/N), as in a. (c) Proportion of SARS-CoV-2 inferred antigen targets by SARS-CoV-2 protein in discharged (n=9 patients, n=15 samples) versus deceased (n=5 patients, n=14 samples) patients. q-value < 0.05, row wise Fisher exact tests with FDR correction (per antigen). (d) Proportion of SARS-CoV-2 inferred antigen targets by SARS-CoV-2 protein with grouping of S and N (S/N) as in c. q-value < 0.05, row wise Fisher exact tests with FDR correction (per S/N and ORF1ab antigens). (e) Proportion of CD8+ T cell inferred antigen targets for the nonstructural proteins (NSP) within the ORF1ab complex in n=13 patients, n=24 samples (left) and proportion of CD8+ T cell antigen targets for NSP in discharged (n=8 patients, n=12 samples) and deceased (n=5 patients, n=12 samples) (right) patients. (f) Proportion of CD8+ T cell inferred antigen targets in early and late samples in discharged and deceased SARS-CoV-2-P patients (discharged, early = 5; deceased, early = 2; discharged, late = 6; deceased, late = 5). Sample numbers (discharged, early = 5; deceased, early = 2; discharged, late = 10; deceased, late = 12). q-value < 0.05, row wise Fisher exact tests with FDR correction (per antigen for late and deceased sample groups). (g) Proportion of CD8+ T cell inferred antigen targets with grouping of S and N (S/N) as in f. q-value < 0.05, row wise Fisher exact tests with FDR correction (per S/N and ORF1ab antigens for late and deceased groups). (h) Alluvial plots depicting the evolution of CD8+ T cell inferred antigen targets in Patient J (deceased) (top) and patient D (deceased) (bottom) (i) Proportion of CD8+ T cell antigen targets by age (≤65 years versus >65 years) in discharged versus deceased patients (discharged, ≤65 years = 6; deceased, ≤65 years = 2; discharged, >65 years = 3; deceased, >65 years = 3); samples (discharged, ≤65 years = 10; deceased, ≤65 years = 6; discharged, >65 years = 5; deceased, >65 years = 8). q-value < 0.05, row wise Fisher exact tests with FDR correction (per antigen). (j) Proportion of CD8+ T cell antigen targets as in i, with grouping of S and N (S/N). q-value < 0.05, row wise Fisher exact tests with FDR correction (per S/N and ORF1ab antigens).
To identify the overall breadth, immunodominance and immunoprevalence of the epitope repertoire recognized by alveolar T cells during the course of severe SARS-CoV-2 pneumonia, we performed a network analysis of predicted CD8+ T cell epitope targets. Cross-reference of the MIRA MHCI dataset identified 44 out of 71 unique peptide pools from 10 out of 11 SARS-CoV-2 proteins that were shared between at least two patients with SARS-CoV-2-P (Fig. 7a). While the breadth of BAL CD8+ T cell responses to SARS-CoV-2 antigens between discharged (n=10) and deceased (n=8) patients with SARS-CoV-2-P and the epitope pools in discharged (n=21) and deceased (n=27) patients were similar, and the immunodominant and immunoprevalent epitopes were well-distributed across the viral proteome in discharged patients, epitopes were highly and disproportionately enriched in the ORF1ab polyprotein complex in deceased patients with SARS-CoV-2-P (Fig. 7b–e). In BAL CD4+ T cells, we identified 8 out of 12 unique peptide pools from 4 out of 9 SARS-CoV-2 proteins shared between at least two patients with SARS-CoV-2-P (Extended Data Fig. 8a,b).
Fig. 7. Immunodominance and immunoprevalence of ORF1ab epitope targeting by BAL CD8+ T cells associate with deceased status.

(a) Network analysis of shared CD8+ TCR sequences recognizing SARS-CoV-2 epitopes. Nodes represent SARS-CoV-2-P patients (n=14), edges represent shared TCR sequences by at least two patients mapped to a MIRA MHCI dataset epitope pool and width of edges (magnitude) denotes total number of shared TCR sequences. (b) Network analysis of shared CD8+ TCR sequences recognizing SARS-CoV-2 epitopes as in a for discharged SARS-CoV-2-P patients (n=9). (c) Immunoprevalence of inferred SARS-CoV-2 epitopes (n=21) in discharged patients represented as percentage (%) (left) and total percentage of TCR sequences inferred to recognize a given SARS-CoV-2 epitope (n=21) in discharged patients (right). (d) Network analysis of shared CD8+ TCR sequences recognizing SARS-CoV-2 epitopes as in a for deceased patients (n=5). (e) Immunoprevalence of inferred SARS-CoV-2 epitopes (n=27) in deceased patients represented as percentage (%) (left) and total percentage of TCR sequences inferred to recognize a given SARS-CoV-2 epitope (n=27 epitopes) in deceased patients (right). (f) Predicted SARS-CoV-2 epitope binding affinity to patient TCR sequences, restricted to patient-specific HLA molecules. Percentile rank denotes predicted affinity strength with percentile ranks <1% and <5% denote strong and weak MHC binder sequences, respectively. Gray tiles represent epitopes not detected within a given patient. Column labels are color-coded by patient, binary outcome, and HLA alleles. Row labels are color-coded by SARS-CoV-2 antigens. M (Membrane), 7b (ORF7b), 10 (OFR10). * denotes that other epitopes are present within the MIRA MHCI dataset peptide pool.
We used a bioinformatics tool (arcasHLA)25 to infer HLA typing in SARS-CoV-2-P (Supplementary Table 2, 3, Extended Data Fig. 8c,d) and a machine learning tool (NetMHCIpan-4.1)26 to assess the likelihood of a specific epitope to bind to a given HLA molecule. We selected the top five epitopes in our peptide network analysis of discharged (n=14) and deceased (n=5) patients (Fig. 7c,e) and predicted the immunodominant epitopes within the immunodominant SARS-CoV-2 region at the level of individual patients (a total of 18 epitopes). We then mapped predicted BAL CD8+ T cell reactivities to the four patient-specific HLA A and B alleles (Fig. 7f and Supplementary Data 11b,c and 12d)27. The majority (94.4%) of immunodominant epitopes (17 out of 18) were predicted to bind (defined as a percentile rank < 5%) to at least one HLA molecule expressed in the corresponding patient (Fig. 7f). All ORF1ab epitopes along with epitopes YLQ (spike), TPS (nucleocapsid) and MIE (ORF7b) were predicted to bind with high affinity (defined as percentile rank < 1%) to at least three patient-specific HLA molecules (Fig. 7f). Together, these results identified an association between BAL T cells targeting epitopes of SARS-CoV-2 non-structural proteins, including ORF1ab, and deceased status and older age in patients with severe SARS-CoV-2-P.
TCR publicity associates with outcomes
Public TCR sequences, which are defined as the occurrence of identical TCRs within multiple individuals, are enriched for specificity to common epitopes and pathogens28 and, in SARS-CoV-2-P, are associated with immunodominant responses and severity of disease29,30. Because our similarity network analysis suggested connectivity between and within NPC, OP, SARS-CoV-2-P and OVP, particularly in SARS-CoV-2-P, we investigated whether public TCRs were over-represented in NPC, OP, SARS-CoV-2-P and OVP. We calculated the probability of generation (Pgen), which is the likelihood of detecting a given TCR sequence based on the sum of all possible V(D)J recombination events resulting in a given nucleotide or amino acid TCR sequence28, for BAL CD8+ and CD4+ TCR sequences in NPC, OP, SARS-CoV-2-P and OVP. We found that TCRβ chains in SARS-CoV-2-P had significantly lower Pgen than in NPC, OP and OVP. In OP, SARS-CoV-2-P, and OVP (but not NPC), patients with discharged status had lower Pgen than those with deceased status (Fig. 8a–f, Extended Data Fig. 9a–e, Supplementary Data 13a,b).
Fig. 8. Generation probabilities (Pgen) of BAL CD8+ TCRs are associated with outcomes.
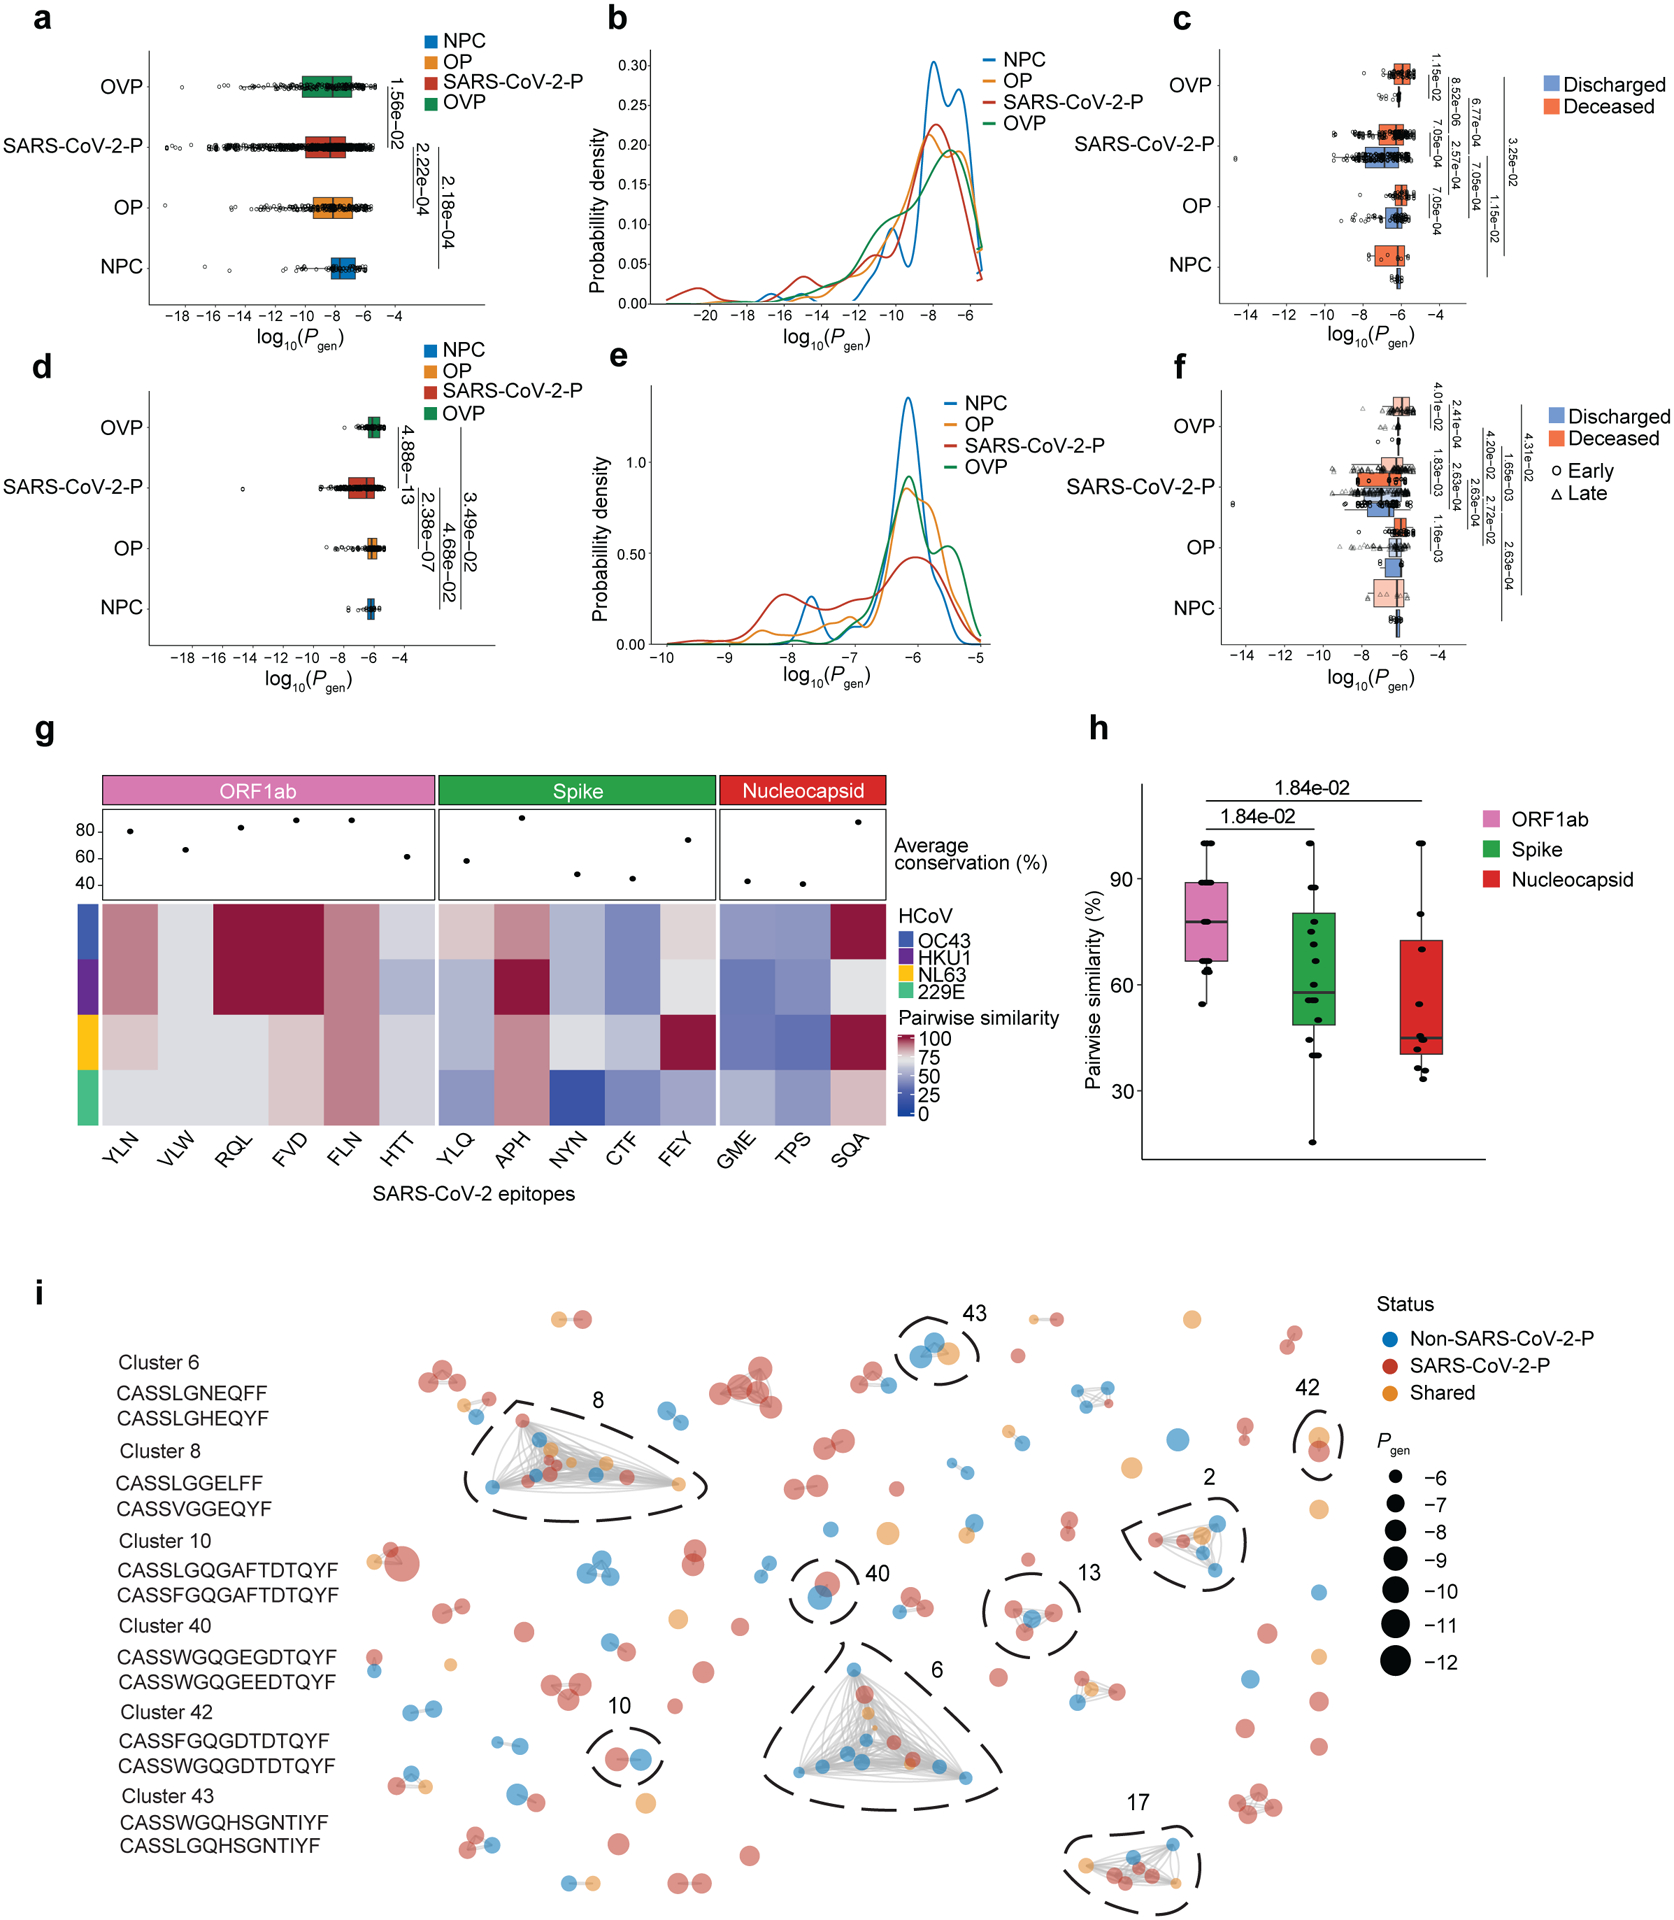
(a,b) Logarithmic distribution of Pgen (a) and probability density (b) for GLIPH2-enriched CDR3β amino acid sequences across OVP, SARS-CoV-2-P, OP and NPC (q < 0.05, pairwise Wilcoxon rank-sum tests with FDR correction). Each dot corresponds to a TCRβ chain. (c) Logarithmic distribution of Pgen for GLIPH2-enriched and cross-referenced CDR3β amino acid sequences to MIRA MHCI dataset in discharged or deceased across OVP, SARS-CoV-2-P, OP and NPC patients. (d,e) Logarithmic distribution of Pgen (d) and probability density (e) for GLIPH2-enriched and cross-referenced CDR3β amino acid sequences to MIRA MHCI dataset across OVP, SARS-CoV-2-P, OP, and NPC (q < 0.05, pairwise Wilcoxon rank-sum tests with FDR correction). (f) Logarithmic distribution of Pgen for GLIPH2-enriched and cross-referenced CDR3β amino acid sequences to MIRA MHCI dataset in discharged or deceased, and early and late samples across OVP, SARS-CoV-2-P, OP and NPC patients. (g) Conserved sequence similarity between dominant BAL CD8+ T cell inferred SARS-CoV-2 epitopes and human coronaviruses (HCoV). Columns represent SARS-CoV-2 epitopes grouped and color-coded by antigen region. Rows are color-coded by distinct HCoV. Pairwise similarity denotes percentage of sequence homology between viruses. An average sequence homology percentage across all HCoV for each SARS-CoV-2 epitope is depicted as a dot in the column header. (h) Pairwise sequence similarity scores between SARS-CoV-2 epitopes and closest matching epitopes from HCoV. q < 0.05, pairwise Wilcoxon rank-sum tests with FDR correction. (i) Similarity network analysis of BAL CD8+ TCR sequences cross-referenced to MIRA MHCI dataset epitope pools. Nodes represent TCR (CDR3β) sequences unique in non-SARS-CoV-2-P (NPC, OP and OVP) or SARS-CoV-2-P or shared TCR (CDR3β) sequences. Edges connect TCR sequences belonging to the same patterns or specificity groups identified through the GLIPH2 algorithm. Dot size represents calculated generation probability (Pgen) of individual TCRβ sequences. Representative TCR sequences from prominent clusters are annotated.
Previous encounters with human coronaviruses (HCoV), which exhibit conserved sequence homology with SARS-CoV-2, have been suggested to induce functional cross-reactive responses in patients with SARS-CoV-2 infection31,32,33,34,35,36,37. We selected immunodominant SARS-CoV-2 epitopes (n=14) from the most prevalent SARS-CoV-2 proteins (spike, nucleocapsid and ORF1ab) in our peptide network analysis and used the Smith-Waterman algorithm to calculate pairwise sequence similarity alignment scores with peptides from HCoVs (OC43, HKU1, NL63 and 229E). Among the epitopes predicted to be recognized by BAL CD8+ T cells, ORF1ab had the highest average conservation to HCoVs when compared to S and N epitopes, which mostly exhibited low similarity scores with the exception of APH and SQA peptides (Fig. 8g–h and Supplementary Data 12e). Similarity network analysis matching on BAL CD8+ TCR beta chain occurrence between patients with SARS-CoV-2-P and NPC, OP and OVP indicated that while the majority of clusters were enriched for public (high Pgen) TCRs, which likely represented the pre-thymic repertoire28, some clusters with low Pgen TCRs exhibited shared connectivity across NPC, OP, SARS-CoV-2-P and OVP (Fig. 8i, Extended Data Fig. 9e and Supplementary Data 13c,d). These results suggested that BAL CD8+ TCR repertoires with lower Pgen were associated with discharged status during severe pneumonia, including SARS-CoV-2-P, and that some BAL CD8+ T cells in SARS-CoV-2-P may cross-react with HCoV.
Discussion
Here, we found that the abundance of BAL CD8+ and CD4+ T cells that exhibited enriched IFN signaling pathways early (≤48 hours) post-initiation of mechanical ventilation in patients with severe SARS-CoV-2-P correlated with survival to hospital discharge, a pattern that was not observed in patients with pneumonia and respiratory failure due to other causes. In contrast, persistent T cell activation with a heightened TNF-NF-κB inflammatory signature was associated with poor outcomes, including mortality. TCR repertoire profiling of BAL CD8+ and CD4+ T cells indicated distinct specificity networks in patients with SARS-CoV-2-P and that specificity for ORF1ab was associated with hospital mortality and age in patients with SARS-CoV-2-P.
Preclinical and human studies established how dynamic changes in T cell-specific activation programs determine Sarbecovirus disease severity16,38,39. Specifically, while an early and robust IFN response in T cells correlates with effective viral clearance and mild disease, a delayed and suboptimal IFN response is associated with impaired T cell function, inducing an unchecked innate immune-mediated proinflammatory response12,38,40,41. Our observations suggest that failure of IFN responses early in the course of critical illness lead to persistent activation of NF-κB-driven inflammation over the duration of mechanical ventilation. These cellular and molecular features may serve as prognostic markers of protective or pathological immunity during severe pneumonia, including COVID-19.
We posit that ORF1ab-specific T cells during the late phase of severe SARS-CoV-2 pneumonia (>48 hours after initiation of mechanical ventilation) could be associated with augmented viral immune escape mechanisms leading to delayed adaptive T cell responses in a subset of patients exhibiting poor outcomes. A study of healthcare workers reported that pre-existing NSP-specific T cells were associated with protection from COVID-19, likely by inducing abortive infection42. Alternatively, higher viral replication leading to greater translation of ORF1ab in patients with SARS-CoV-2-P who died could explain our observation that ORF1ab-specific T cells were associated with poor outcomes.
T cells in blood samples collected before the COVID-19 pandemic were shown to possess reactivity against specific SARS-CoV-2 peptides in regions of conserved homology with other human coronaviruses34,36,43,44. We predicted that TCRs in our dataset specific for immunodominant SARS-CoV-2 peptides had high sequence similarity with TCRs specific for other human coronaviruses and that some TCRs with low Pgen were shared between SARS-CoV-2-P and pre-pandemic samples, suggesting potential cross-reactivity. The presence of TCR beta chains with low Pgen was associated with survival from severe pneumonia across etiologies, suggesting that specific TCRs elicited during infection could serve as biomarkers of successful immune responses to lung infection caused by viruses and bacteria. Whether immunodominant SARS-CoV-2 T cell responses are generated from cross-reactive memory T cells generated during infection with HCoVs or they originate from the highly-abundant naïve repertoire pool remains an area under active investigation30.
Our study has limitations. First, while we were able to perform deep molecular phenotyping of T cell subsets, cell numbers and study design limited our ability to perform functional studies of T cell avidity and cross-reactivity. Hence, all TCR and epitope prediction results in our study were computationally inferred. Second, as pneumonia is an encompassing syndrome, our single-site study population was heterogeneous. Third, molecular phenotyping in the cohort was feasible only for samples with sufficient numbers of T cells in the BAL fluid, potentially imparting selection bias. Fourth, because all samples were obtained early in the COVID-19 pandemic, we could not determine the effects of vaccination and novel variants on T cell responses. Finally, our TCR analyses are based on single beta chain measurements and relied on reverse epitope prediction, which is a powerful technique to identify the likely antigens recognized by the TCRs in our dataset but is nonetheless reliant on the robustness and accuracy of existing databases and computational procedures. Accordingly, we have made our data publicly available for reanalysis as these techniques evolve.
Methods
Human participants.
The Northwestern University Institutional Review Board approved all research involving human participants under study STU00204868. All study participants or their surrogates provided informed consent. The details of participant recruitment in the SCRIPT Systems Biology Center have been previously reported1,2,3. In brief, the SCRIPT study screened patients at least 18 years of age who were receiving mechanical ventilation and had clinical suspicion of pneumonia based on clinical signs, including, but not limited to, fever, radiographic infiltrate, and respiratory secretions and had undergone at least one BAL procedure to evaluate the presence and microbial etiology of pneumonia. For this study, we included data and samples from patients enrolled in SCRIPT from June 2018 to August 2020 in the ICU at Northwestern Memorial Hospital in Chicago. We selected this time period because it was a study era in which SCRIPT used flow cytometry to analyze and sort T cell subsets for bulk transcriptional profiling. Participants could re-enter the study under a new study identifier if they were discharged from the hospital and subsequently re-admitted to the ICU. The etiology of pneumonia (SARS-CoV-2, other viral pneumonia, other pneumonia, or non-pneumonia [intubated for reasons other than pneumonia]) and outcome of each pneumonia episode (cured, indeterminate, or not cured) were adjudicated by consensus of pulmonary and critical care medicine physicians using a validated procedure3,4. The etiology of pneumonia was determined based on clinical and BAL fluid data obtained on the date of study enrollment. Detailed definitions of pneumonia episodes and resolution status are available in reference4. Superinfection was defined as bacterial infection co-occurring with a viral pathogen diagnosed by BAL sampling. For the purposes of this report, ventilator-associated pneumonia (VAP) refers to incident bacterial pneumonia occurring after at least 48 hours of mechanical ventilation in patients who were enrolled as a non-pneumonia control or who were enrolled with viral pneumonia (due to SARS-CoV-2 or another virus) but who did not have evidence of an underlying viral infection at the time of the current BAL sample (i.e., had cleared their viral infection). Demographics, clinical data, and outcomes were extracted from the electronic health record (EHR) via the Northwestern Medicine Enterprise Data Warehouse5. Racial groups with fewer than five individuals were censored to ‘Other’ to protect patient anonymity. Comorbidities were extracted based on ICD codes as aligned to Charlson Comorbidity Index at time of hospital admission. No compensation was provided to study participants.
Clinical management.
Bronchoscopic or non-bronchoscopic BAL sampling was performed using standard techniques with modifications to limit the generation of infectious aerosols6. We routinely instill 120 mL of non-bacteriostatic saline in four 30-mL aliquots, discarding the return from the first aliquot. Quantitative bacterial cultures, multiplex or targeted PCR (BioFire® FilmArray® Pneumonia (PN) Panel, targeted SARS-CoV-2 PCR, and Respiratory Pathogen Panel), and automated cell count and differential were performed on BAL fluid, and nearly all patients underwent urinary antigen testing for Streptococcus pneumoniae and Legionella pneumophilia serogroup 1. Patient management was guided by institutional practice, including adherence to lung-protective mechanical ventilation strategies and use of prone positioning and ECMO, consistent with published guidelines7. Some patients were enrolled in the ACTT-1 placebo-controlled trial of remdesivir for COVID-198.
Flow cytometry analysis and sorting.
The details of the standard operating procedures of the SCRIPT study for flow cytometry have been previously reported1. In brief, BAL fluid samples were stored at 4 °C for no longer than 24 hours before filtration through a 70-μm filter, centrifugation, and hypotonic lysis (BD PharmLyse). All cell counts were performed on a K2 Cellometer (Nexcelom) with AO/PI reagent. Fc receptors were blocked using Human TruStain FcX (Biolegend) in MACS buffer (Miltenyi Biotech). Cells were incubated with fluorochrome-conjugated antibodies at 4 °C for 30 minutes, washed, and resuspended in MACS buffer containing SYTOX Green viability dye (ThermoFisher). The following conjugated antibodies were used: CD4 RPA-T4::BUV395 BD Biosciences Cat# 564724, RRID:AB_2738917, dilution factor 0.025; CD25 2A3::BUV737 BD Biosciences Cat# 564385, RRID:AB_2744342, dilution factor 0.05; HLA-DR L243::eFluor450 Thermo Fisher Scientific Cat# 48-9952-42, RRID:AB_1603291, dilution factor 0.025; CD15 HI98::BV786 BD Biosciences Cat# 563838, RRID:AB_2738444, dilution factor 0.05; CD3 SK7::PE Thermo Fisher Scientific Cat# 12-0036-42, RRID:AB_10805512, dilution factor 0.025; CD127 HIL-7R::PECF594 BD Biosciences Cat# 562397, RRID:AB_11154212, dilution factor 0.05; CD206 19.2::Pe-Cy7 Thermo Fisher Scientific Cat# 25-2069-42, RRID:AB_2573426, dilution factor 0.025; CD8 SK1::APC BioLegend Cat# 344721, RRID:AB_2075390, dilution factor 0.025; EpCAM 9C4::APC BioLegend Cat# 324208, RRID:AB_756082, dilution factor 0.025. A FACS Aria III SORP with 100-μm nozzle operating at 20 psi was used to sort pre-defined T cell populations into 300 μL of MACS buffer using previously validated gating strategies (see Extended Data Figure 2 in reference1). Specifically, we defined regulatory T (Treg) cells as live FSCloSSClo CD3ε+CD4+CD25hiCD127lo cells, CD4+ non-Treg cells as live FSCloSSClo CD3ε+CD4+ cells not in the Treg cell gate, bulk CD4+ T cells as live FSCloSSClo CD3ε+CD4+ cells, and CD8+ T cells as live FSCloSSClo CD3ε+CD8+ cells. Sorting for Treg cells, CD4+ non-Treg cells, and CD8+ T cells was performed if at least 1,000 Treg cells could be captured; otherwise, the gate was collapsed to capture bulk CD4+ T cells. Lastly, samples were not processed for flow cytometry if <4 mL were available for research use, if staff were unavailable, if the sample was grossly purulent (pus), or if the sample was collected in the first weeks of the pandemic before biosafety approval for research on these samples was obtained.
Bulk RNA-sequencing and processing.
Following sorting of T cell subsets, cells were pelleted by centrifugation and lysed in 350 μL of RLT Plus lysis buffer (Qiagen) supplemented with 1% 2-mercaptoethanol and immediately stored at −80 °C. The Qiagen AllPrep DNA/RNA Micro Kit was used for simultaneous isolation of RNA and DNA, and RNA quality and quantity was assessed using a 4200 TapeStation System (Agilent Technologies). RNA-sequencing libraries were prepared from 300 pg of total RNA using SMARTer Stranded Total RNA-seq Kit v2 – Pico Input Mammalian (TakaraBio). Libraries were pooled and sequenced on a NextSeq 500 instrument (Illumina), 75 cycles, single-end, to an average sequencing depth of 20.83 million reads. Computational and bioinformatics pipelines were performed using Northwestern University’s Quest High Performance Computing Cluster Facility. The pipelines were constructed based on open-source software using nf-core /rnaseq pipeline v.3.3 implemented in Nextflow v.21.04.39. Nf-core/rnaseq pipeline was run with nu_genomics profile and skip_bigwig option and otherwise default options. Briefly, Quality control using FastQC v.0.11.9 and adaptor trimming using Trimgalore v.0.6.6 were performed on sequence reads from the RNA-sequencing data. STAR v2.6.10d10 was used to align the reads to the reference genome (GRCh38 version of iGenomes reference, originally donwloaded from NCBI Homo sapiens Annotation Release 106), and Salmon v.1.4.011 was used for gene and transcripts quantification. Downstream analysis was performed in R v.4.2.3. Sample swaps and mis-annotations were first identified by comparing a given patient’s known sex with sex determined by levels of XIST and RPSY41, followed by exploration of expression of canonical markers for T cells subsets and macrophages (CD8A, CD4, FOXP3, C1QC). Samples exhibiting either poor alignment, unexpected correlation, or extreme deviation in PCA were excluded from downstream analysis. Details for these procedures and all code described below are available in our GitHub repository: https://github.com/NUPulmonary/2024_Markov_Ren_Senkow.
Differential expression analysis (DEA).
DEA was performed using edgeR v.3.40.212. In brief, genes with very low count reads were filtered executing the function filterByExpr. Effective or normalized library sizes were calculated using calcNormFactors function. A generalized linear model (GLM) framework was used for matrix design with pneumonia category as imputed factor for the main RNA-seq analyses and timing of BAL relative to intubation (COVID-19 samples only) as imputed factor for the comparison of early versus late samples. Common and tagwise dispersion were calculated using the estimateDisp command, and DEA was performed using likelihood ratio tests with functions glmFit and glmLRT. Significantly variable genes (FDR q-value < 0.05) were identified after performing a likelihood ratio test under the GLM framework as described above. We used k-means algorithms to cluster the significantly variable genes with the optimal number of clusters calculated using fviz_nbclust function from factoextra v.1.0.7 followed by clustering with Hartigan-Wong algorithm from kmeans function in stats. Samples were subsequently hierarchically clustered by using Euclidean distance and Ward’s linkage method and visualized with ComplexHeatmap v.2.14.013.
Functional enrichment analysis.
Gene Ontology (GO) Enrichment Analysis was performed with topGO v.2.50.014. DEG were used as “genes of interest” within the gene universe. Gene Ontology annotations and attributes of interest were extracted with biomaRt v.2.54.115 to build the topGO data object. Significant GO terms were obtained after performing a classical enrichment analysis (algorithm = “classic”, statistical test = “Fisher exact test”) followed by multiple testing correction using the Benjamini-Hochberg method. To minimize redundancy between identified GO terms, help infer biological significance, and improve visualization of multiple significant GO terms, we used rrvgo v.1.10.016 to group similar GO terms by semantic similarity methods (method = Rel, threshold = 0.5). Gene set enrichment analysis (GSEA)17 was performed after retrieving the Hallmark gene set collection (h.all.v7.5.1.symbols.gmt) and using log-fold change ranked genes with fgseaMultilevel feature, which implements an adaptive multilevel splitting Monte Carlo approach for enhanced estimation of small p-values with Fast Gene Set Enrichment Analysis (fgsea) v.1.24.018.
Correlation analysis of bulk RNA sequencing from T cell subsets with clinical outcomes.
DEG obtained from DEA with edgeR were used to calculate correlation between gene expression levels and clinical metadata in COVID-19 samples. Cor function from stats was used to compute correlation coefficient in the presence of missing values (method = “spearman”, use = “pairwise.complete.obs”). Gene-associated correlation coefficients were ranked for individual clinical variables of interest, followed by GSEA as described above. Genes of interest were selected from the leading edge subsets within Hallmark processes.
Real Time SARS-CoV-2 PCR Ct values.
Viral RNA was extracted from specimens using the QIAamp Viral RNA Minikit and the QIAamp 96 Virus QIAcube HT Kit (Qiagen). Viral transport media (VTM)-only controls were included in each extraction. Laboratory testing for the presence of SARS-CoV-2 was performed by quantitative reverse transcription and PCR (qRT-PCR) with the CDC 2019-nCoV RT-PCR Diagnostic Panel utilizing N1 and RNase P probes as previously described (https://www.cdc.gov/coronavirus/2019-ncov/lab/rt-pcr-panel-primer-probes.html). Positive and negative controls for SARS-CoV-2 and Rnase P were included in each qRT-PCR experiment alongside the VTM only sample from the RNA extraction, a no template control, and standard curves for SARS-CoV-2 and Rnase P. Specimens with Rnase P cycle thresholds (Ct) above 35 were of insufficient quality and were excluded from future studies. N1 Ct values less than or equal to 35 were considered positive, and these Ct values were used in all subsequent analyses.
Cell-type deconvolution of bulk RNA sequencing T cell signatures.
Deconvolution of T cell bulk RNA sequencing was performed using AutoGeneS v.1.0.419. Signatures were derived using the single-cell dataset from Grant et al. Nature. 20211. A model was trained on CD8+ T cells, CD4+ T cells, and Treg cells. Signatures were automatically derived from 1,000 highly variable genes with function optimize (ngen=2000, seed=0, nfeatures=200, mode=“fixed”) for CD8+ T cells and function optimize (ngen=2000, seed=0, nfeatures=150, mode=“fixed”) for CD4+ T cells and Treg cells. The model was then applied to bulk RNA-sequencing data to estimate the proportion of specific cell types using regression analysis.
T cell receptor (TCR) sequencing and analysis.
We performed TCR-sequencing on selected samples of CD4+ and CD8+ T cells that contained at least 0.5 ng of residual RNA following bulk RNA-sequencing. RNA quality and quantity were measured using a 4200 TapeStation using high-sensitivity RNA ScreenTape (Agilent Technologies) before library preparation using the SMARTer Human TCR α/β Profiling Kit (Takara Bio). In brief, this kit uses a 5’ RACE-like approach to capture complete V(D)J variable regions of TCR transcripts and primers that incorporate Illumina-specific adaptor sequences during cDNA amplification. Libraries were then pooled, denatured, and diluted to a 1.8-pM DNA solution. PhiX control was spiked in at 20%. Libraries were sequenced on an Illumina NextSeq 500 instrument using NextSeq 500/550 Mid Output Kit v2.5 (300 cycles) with a target read depth of approximately 17.39 million aligned reads per sample. Raw sequencing reads in FASTQ format were aligned against a default reference database of V-, D-, J- and C- gene segments, followed by assemblage into clonotypes using MiXCR software v.3.0.1320. We defined a clonotype by a unique TCRβ nucleotide sequence with V- and J- gene restriction. We preserved this definition of a clonotype throughout analysis. MiXCR-processed files were exported and analyzed using the R-based package, immunarch v.0.9.021. Clonotype diversity was calculated with the repDiversity function, using a non-parametric asymptotic estimator method of species richness, chao1.
HLA typing from RNA-sequencing.
We used arcasHLA v.0.4.0 to perform high-resolution HLA class I and class II genotyping from RNA sequencing22. Specifically, HLA sequences were extracted from mapped chromosome 6 reads in sorted BAM files (RNA sequencing files) and referenced with IMG/HLA database v.3.47.0. Singularity container v.3.8.7 was used to perform analysis using commands arcasHLA extract and arcasHLA genotype. In certain cases, the specific HLA protein field was reduced to the most frequent within the allele group.
Identification of TCR motifs and shared specificity groups using GLIPH2.
The GLIPH2 algorithm was implemented to identify TCR sequences predicted to bind similar epitopes in an HLA-restricted manner23. After imputing participant-specific CDR3β amino acid sequences, TRβV genes, and HLA alleles from our cohort, the GLIPH2 algorithm compared CDR3β sequences to a reference database of over 200,000 nonredundant naïve CD4+ and CD8+ TCRβ sequences from 12 healthy controls and clustered them into specificity groups (patterns) according to global and local convergence sequence metrics. To identify high-confidence TCR specificity groups shared among our cohort, GLIPH2 analysis provided statistical measurements that identify TRβV gene usage bias and HLA allele usage, comparing enriched TCR sequences between our dataset and a reference dataset using the Fisher exact test. Accordingly, we used these variables coupled with analysis of clusters containing at least 3 unique CDR3β sequences from at least 3 distinct patients within our cohort.
TCR network analysis and COVID-19-specific epitope dominance analysis.
To identify high-confidence SARS-CoV-2-specific TCR epitopes, we mapped our cohort’s CDR3β sequences to the MIRA dataset24. To visualize shared TCR specificity between pneumonia diagnoses, we used network v.1.18.1, tidygraph v.1.3.1, and ggraph v.2.1.025,26.
Entropy calculation.
To estimate a numeric value of association between a specific TRBV gene with a particular HLA allele, we computed normalized Shannon entropy, and plotted 1 minus this value. , where HLA is the set of all detected HLA alleles, and is the proportion of a particular HLA allele i among all alleles detected for the TRBV gene27. The plotted value ranges from 0—meaning no association with any specific HLA allele is detected—to 1, meaning that the gene is only detected with one particular HLA allele. Shannon entropy was computed in python v.3.11 using scipy version v.1.12.0.
Generation probability (Pgen) of TCRβ amino acid sequences.
We used tcrdist3 package (version 0.2.2) to compute the generation probabilities (Pgen) for CD8+ and CD4+ detected TCRβ amino acid sequences, following the tutorial from the package (https://tcrdist3.readthedocs.io/en/latest/pGen.html) with recomb_type=VDJ parameter28. We excluded TCRβ sequences with estimated Pgen of 0 or less than as improbable or highly unlikely.
Selection of SARS-CoV-2 dominant, HLA-restricted epitopes and sequence conservation analysis.
We selected both the top five SARS-CoV-2-specific epitopes from our peptide network analysis. We also selected immunodominant epitope(s) within the immunodominant SARS-CoV-2 antigenic region(s) at the level of individual patients (18 epitopes total), followed by implementation of NetMHCpan EL 4.1 tool (available on Immune Epitope Database and Analysis Resource, http://tools.iedb.org/mhci/ and http://tools.iedb.org/mhcii/)29 to predict their potential binding affinity in a patient-specific, HLA-restricted manner. For epitopes with poor binding capacity (e.g., CTFEYVSQPF, GMEVTPSGTWL and AFLLFLVLI), alternate epitopes within their respective MIRA MHC1 epitope pools were used for analysis (e.g., FEYVSQPFL, TPSGTWLTY, and MIELSLIDFY, respectively). We selected every matching TCRβ sequence to a MIRA epitope pool and queried every single epitope within MIRA dataset pool in an HLA-restricted manner to the IEDB NetMHCpan El 4.1 tool for MHC MHCI or II, respectively. We then selected the best (lowest) binding (affinity) rank among these combinations for any given TCRβ sequence and removed those with affinity rank > 5 for downstream analysis. To estimate the sequence conservation between SARS-CoV-2 epitopes and other HCoV-related epitopes, we first obtained whole-genome sequences for SARS-CoV-2 (GenBank ID: MN985325.1), HCoV 229E (GenBank ID: MN306046.1), HCoV HKU1 (GenBank ID: KY983584.1), HCoV NL63 (GenBank ID: KX179500.1), and HCoV OC43 (GenBank ID: MN306053.1) from the NCBI database. Next, we calculated the pairwise sequence similarity score (https://www.ebi.ac.uk/Tools/psa/) for each selected SARS-CoV-2 epitope. Specifically, we imputed the sequence of a given selected SARS-CoV-2 epitope against the whole antigen-specific and matching HCoV sequence by using global alignment and following these parameters: EMBOSS Needle, Needleman-Wunsch algorithm, BLOSUM62 matrix, gap open (10), gap extend (0.5), end gap penalty (false), end gap open penalty (10) and end gap extension penalty (0.5). The resultant matching HCoV epitopes were subsequently imputed to calculate the local alignment similarity score against the SARS-CoV-2 epitope, using the following parameters: EMBOSS Water, Smith-Waterman algorithm, BLOSUM62 matrix, gap open (10), gap extend (0.5), end gap penalty (false), end gap open penalty (10) and end gap extension penalty (0.5).
Statistics and Reproducibility.
Statistical analysis was performed using R v.4.2.3. Data was analyzed with the statistical test described in the corresponding figure legend and annotated with ggsignif v.0.6.430. For non-normally distributed variables we used non-parametric Wilcoxon rank sum test to compare the distributions. Pearson or Spearman correlation coefficients and p-values were annotated using ggpubr v.0.6.031. Plotting was performed using ggplot2 v.3.4.432. All boxplots show shaded area from the first quartile of the data to the third, with a line indicating the median. Boxplot whiskers extend towards minimum or maximum data point no further than 1.5 * inter-quartile range, and all data points are plotted on top. Adjusted p-values were obtained by correcting for multiple testing using the Benjamini-Hochberg method. A p- or q-value < 0.05 was considered statistically significant with non-significant values not displayed. No statistical methods were used to predetermine sample size or power. The experiments were not randomized. Data collection and analysis by investigators were not blinded.
Extended Data
Extended Data Table. 1.
Study cohort and list of detected pathogens
| Overall | Non-pneumonia control | Other pneumonia | COVID-19 | Other viral pneumonia | |
|---|---|---|---|---|---|
| Number | 273 | 33 | 133 | 74 | 33 |
| Age, median [IQR] | 62.0 [42.0,71.0] | 62.0 [42.0,70.0] | 65.0 [51.0,72.0] | 58.5 [44.5,66.8] | 60.0 [55.0,69.0] |
| Female, n (%) | 108 (39.6) | 16(48.5) | 55(41.4) | 23 (31.1) | 14(42.4) |
| Ethnicity, n (%) | |||||
| Hispanic or Latino | 60 (22.0) | 5(15.2) | 13 (9.8) | 37 (50.0) | 5(15.2) |
| Not Hispanic or Latino | 204 (74.7) | 27 (81.8) | 118(88.7) | 33 (44.6) | 26 (78.8) |
| Unknown or Not Reported | 9 (3.3) | 1 (3.0) | 2(1.5) | 4(5.4) | 2(6.1) |
| Race, n (%) Asian | 10(3.7) | 1 (3.0) | 5 (3.8) | 3(4.1) | 1 (3.0) |
| Black or African American | 59 (21.6) | 7(21.2) | 28 (21.1) | 18(24.3) | 6(18.2) |
| Unknown or Not Reported | 49 (17.9) | 3(9.1) | 15(11.3) | 28 (37.8) | 3(9.1) |
| White | 155 (56.8) | 22 (66.7) | 85 (63.9) | 25 (33.8) | 23 (69.7) |
| External transfer, n (%) | 91 (33.3) | 12(36.4) | 43 (32.3) | 24 (32.4) | 12(36.4) |
| Admission BMI (kg/m2), median [IQR] * | 29.2 [24.6,34.3] | 26.4 [24.6,32.2] | 27.0 [22.1,32.9] | 31.9 [28.9,40.6] | 28.3 [23.7,31.9] |
| SOFA score on ICU admission, median [IQR] | 11.0 [8.0,13.0] | 11.0 [8.0,13.0] | 11.0 [8.0,14.0] | 11.5 [9.0,13.0] | 10.0 [6.0,14.0] |
| APS score on ICU admission, median [IQR] | 90.0 [62.0,108.0] | 80.0 [62.0,104.0] | 87.0 [64.0,108.0] | 91.0 [65.8,109.0] | 83.0 [55.0,100.0] |
| Comorbidities, n (%) | |||||
| Myocardial infarction | 20 (7.3) | 5(15.2) | 12(9.0) | 2(2.7) | 1 (3.0) |
| Congestive heart failure | 81 (29.7) | 13(39.4) | 50 (37.6) | 12(16.2) | 6(18.2) |
| Peripheral vascular disease | 63 (23.1) | 8 (24.2) | 39 (29.3) | 9(12.2) | 7(21.2) |
| Cerebrovascular disease | 57 (20.9) | 6(18.2) | 32 (24.1) | 8(10.8) | 11 (33.3) |
| Dementia | 13(4.8) | 3(9.1) | 4(3.0) | 2(2.7) | 4(12.1) |
| Chronic pulmonary disease | 96 (35.2) | 13(39.4) | 53 (39.8) | 17(23.0) | 13(39.4) |
| Rheumatic disease | 21 (7.7) | 4(12.1) | 11 (8.3) | 3(4.1) | 3(9.1) |
| Peptic ulcer disease | 27 (9.9) | 5(15.2) | 16(12.0) | 1 (1.4) | 5(15.2) |
| Liver disease | 80 (29.3) | 12(36.4) | 44(33.1) | 11 (14.9) | 13(39.4) |
| Diabetes | 104(38.1) | 10(30.3) | 41 (30.8) | 35 (47.3) | 18(54.5) |
| Hemiplegia or paraplegia | 19(7.0) | 3(9.1) | 12(9.0) | 2(2.7) | 2(6.1) |
| Renal disease | 77 (28.2) | 14(42.4) | 41 (30.8) | 11 (14.9) | 11 (33.3) |
| Cancer | 87 (31.9) | 12(36.4) | 48 (36.1) | 11 (14.9) | 16(48.5) |
| Immunocompromise | 70 (25.6) | 8 (24.2) | 40 (30.1) | 6(8.1) | 16(48.5) |
| Biomarkers on day of first BAL procedure, median [IQR] | |||||
| C-reactive protein, mg/dL * | 163.2 [92.0,259.5] | 12.0 [11.0,55.0] | 96.0 [22.5,176.0] | 169.0 [116.0,275.5] | 168.0 [168.0,168.0] |
| D-dimer, ng/mL * | 1103.0 [492.5,3540.5] | 1345.5 [405.8,2220.5] | 2922.0 [886.0,5091.0] | 896.5 [468.8,2892.6] | 1954.2 [1170.5,2931.1] |
| Ferritin, ng/mL * | 663.2 [300.9,1210.3] | 92.4 [57.0,191.2] | 631.8 [319.8,1183.7] | 766.4 [330.1,1355.2] | |
| Lactate, mmol/L * | 1.5 [1.1,2.1] | 1.7 [1.1,2.3] | 1.6 [1.1,2.4] | 1.4 [1.0,1.8] | 1.3 [1.0,1.7] |
| Procalcitonin, ng/mL * | 0.6 [0.2,2.8] | 0.4 [0.1,1.6] | 0.6 [0.3,2.9] | 0.4 [0.1,2.9] | 0.8 [0.3,3.8] |
| White blood cell count, x1,000/μL * | 11.6 [8.0,16.7] | 12.6 [8.1,20.4] | 12.6 [8.7,16.8] | 10.1 [7.1,14.6] | 10.7 [7.2,18.5] |
| Absolute neutrophil count, x1,000/μL * | 9.2 [5.7,13.7] | 12.2 [6.0,18.8] | 9.6 [6.3,15.3] | 8.7 [5.5,11.2] | 8.9 [5.2,13.0] |
| Absolute lymphocyte count, x1,000/μL * | 0.8[0.5,1.4] | 0.6[0.4,0.8] | 0.9[0.5,1.7] | 1.0[0.6,1.3] | 0.8[0.2,1.6] |
| Medications | |||||
| Corticosteroids administered during admission, n (%) | 162 (59.3) | 20 (60.6) | 80 (60.2) | 39 (52.7) | 23 (69.7) |
| Prednisone equivalents administered during admission, mg | 70.0 [0.0,240.0] | 80.0 [0.0,340.0] | 92.0 [0.0,250.0] | 15.0 [0.0,209.0] | 96.0 [0.0,272.0] |
| Tocilizumab, n (%) | 13(4.8) | - | 1 (0.8) | 12(16.2) | - |
| Sarilumab, n (%) | 12 (4.4) | - | - | 12(16.2) | - |
| Remdesivir, n (%) | 12 (4.4) | - | - | 12(16.2) | - |
| Remdesivir or placebo, n (%) | 9 (3.3) | - | - | 9(12.2) | - |
| ICU course | |||||
| Ventilation duration (days), median [IQR] | 10.0 [4.0,22.0] | 3.0 [2.0,9.0] | 9.0 [4.0,19.0] | 20.0 [10.0,33.0] | 7.0 [3.0,13.0] |
| ICU length of stay (days), median [IQR] | 13.0 [6.0,23.0] | 6.0 [4.0,11.0] | 11.0 [5.0,21.0] | 21.0 [14.0,35.0] | 11.0 [9.0,20.0] |
| Tracheostomy, n (%) | 70 (25.6) | 3(9.1) | 29 (21.8) | 32 (43.2) | 6(18.2) |
| Discharge disposition, n (%) | |||||
| Died | 87 (31.9) | 10(30.3) | 47 (35.3) | 19(25.7) | 11 (33.3) |
| Home | 76 (27.8) | 12(36.4) | 27 (20.3) | 30 (40.5) | 7(21.2) |
| LTACH | 35(12.8) | 3(9.1) | 17(12.8) | 12(16.2) | 3(9.1) |
| Rehab | 49 (18.0) | 4(12.1) | 27 (20.3) | 9(12.2) | 9 (27.3) |
| SNF | 18(6.6) | 2(6.1) | 12(9.0) | 4(5.4) | - |
| Hospice | 8 (2.9) | 2(6.1) | 3 (2.3) | 0 (0.0) | 3(9.1) |
| Pathogens | Flow Cytometry | Bulk RNA-seq | Bulk TCR-seq |
|---|---|---|---|
| Achromobacter species | 3 | 1 | 2 |
| Acinetobacter baumannii | 3 | 2 | - |
| Acinetobacter ursingii | 1 | - | - |
| Adenovirus | 1 | 1 | 1 |
| Beta Hemolytic Streptococci, Group C | 1 | - | - |
| Beta Hemolytic Streptococci, Group G | 1 | 1 | - |
| Beta Hemolytic Streptococci, not Group A, B, C, D, F, or G | 1 | 1 | - |
| Burkholderia cepacia complex | 7 | 3 | 4 |
| Chryseobacterium indologenes | 2 | - | - |
| Citrobacter freundii Group | 1 | - | - |
| Citrobacter koseri | 2 | - | - |
| Citrobacter youngae | 1 | - | - |
| Coronavirus 229E | 2 | 2 | 2 |
| Coronavirus HKU1 | 2 | 1 | 1 |
| Coronavirus OC43 | 2 | 1 | |
| Corynebacterium species | 12 | 3 | 3 |
| Elizabethkingia species | 2 | - | - |
| Enterobacter cloacae | 7 | - | - |
| Enterococcus faecal is | 5 | 3 | 2 |
| Enterococcus faecium | 2 | 1 | - |
| Enterococcus species | 1 | - | - |
| Escherichia coil | 19 | 4 | 2 |
| Haemophilus influenzae | 4 | - | - |
| Hafnia alvei | 1 | 1 | 1 |
| Human metapneumovirus | 1 | - | - |
| Human rhinovirus/enterovirus | 12 | 8 | 4 |
| Influenza A | 11 | 10 | 9 |
| Klebsiella aerogenes | 9 | 4 | 4 |
| Klebsiella oxytoca | 1 | - | - |
| Klebsiella pneumoniae | 16 | 5 | 3 |
| Lactobacillus species | 1 | 1 | - |
| Legionella pneumophilia | 1 | 1 | - |
| MRSA | 14 | 2 | - |
| Neisseria meningitidis | 1 | - | - |
| Pantoea species | 1 | - | - |
| Parainfluenzae virus | 4 | 3 | 1 |
| Pathogen-negative | 171 | 41 | 14 |
| Proteus species | 1 | - | - |
| Providencia stuartii | 1 | - | - |
| Pseudomonas aeruginosa | 32 | 12 | 8 |
| Pseudomonas nitroreducens | 1 | 1 | 1 |
| Pseudomonas stutzeri | 1 | - | - |
| Raoultella ornithinolytica | 1 | - | - |
| Respiratory syncytial virus | 2 | 1 | 1 |
| SARS-CoV-2 | 101 | 60 | 26 |
| Serratia marcescens | 12 | 5 | 2 |
| Staphylococcus aureus | 26 | 8 | 2 |
| Staphylococcus coagulase negative | 8 | 2 | 2 |
| Stenotrophomonas maltophilia | 10 | - | - |
| Streptococcus agalactiae | 4 | 2 | - |
| Streptococcus pneumoniae | 1 | 1 | 1 |
| Streptococcus pseudo pneumoniae | 1 | 1 | - |
| Streptococcus pyogenes | 3 | 1 | 1 |
| Viridans streptococcus | 11 | 2 | - |
(a) Description of the cohort. * Missing values, n: BMI, 1; C-reactive protein, 195; D-dimer, 174; ferritin, 208; lactate, 70; procalcitonin, 114; white blood cell count, 3; absolute neutrophil count, 96; absolute lymphocyte count 101. Empty cells represent data not available or not applicable. BMI, body mass index; SOFA, Sequential Organ Failure Assessment; APS, Acute Physiology Score from APACHE II; LTACH, long-term acute care hospital; SNF, skilled nursing facility; IQR, interquartile range. (b) Pathogens identified in BAL samples. Numbers indicate occurrence count identified per analysis category. MRSA, methicillin-resistant Staphylococcus aureus.
Extended Data Fig. 1. Graphical abstract and the study cohort.

(a) Graphical abstract. (b) CONSORT diagram of patients included in this study. (c) Schematic depicting multi-step analysis of BAL fluid samples with flow cytometry, bulk RNA-sequencing, and bulk TCR-sequencing by diagnosis (NPC, OP, SARS-CoV-2-P, OVP) and T cell subset (CD4+, CD8+, Treg).
Extended Data Fig. 2. SARS-CoV-2-P is characterized by a lymphomonocytic alveolar infiltrate early following intubation.

(a) Flow cytometry analysis of BAL immune cell subset composition in CD3ε+CD4+ T cells, CD3ε+CD8+ T cells, Treg cells (CD3ε+CD4+CD25+CD127−), monocytes (HLA-DR+CD4+CD206−), macrophages (CD206+), and neutrophils (CD15+) indicating whether a given patient was discharged or deceased, the duration of mechanical ventilation (range 0–110 days; blanks indicate chronically ventilated patients), and presence (superinfection) or absence of bacterial infection with columns ordered by diagnosis (n=432 samples (NPC [n=36], OP [n=187], SARS-CoV-2-P [n=165], and OVP [n=44]) and then by days from intubation when the sample was obtained. VAP (ventilator-associated pneumonia) designates samples from NPC or patients with SARS-CoV-2-P or OVP who cleared the virus and then developed bacterial pneumonia. Each column represents a BAL sample. (b) Box plot of percentage of BAL CD4+ T cells detected in BAL fluid samples from diagnosis groups (q < 0.05, pairwise Wilcoxon rank-sum tests with FDR correction). (c) As in b, for CD8+ T cells. (d) As in b, for Treg cells. (e) As in b, for monocytes. (f) As in b, for macrophages. (g) As in b, for neutrophils. (h) Box plot of BAL CD4+ T cell percentages between early (≤48 hours following intubation) and late (>48 hours following intubation) samples by diagnosis (q < 0.05, pairwise Wilcoxon rank-sum tests with FDR correction). (i) As in h, for CD8+ T cells. (j) As in h, for Treg cells. (k) Box plot of BAL CD3+ T cell percentage grouped by the presence or absence of bacterial superinfection in early (≤48 hours following intubation) and late (>48 hours following intubation) SARS-CoV-2-P samples (q < 0.05, pairwise Wilcoxon rank-sum tests with FDR correction). (l) As in i, for monocytes. (m) Spearman correlation analysis between the percentage of BAL monocytes and the duration of mechanical ventilation by diagnosis. (n) As in i, for neutrophils. (o) As in m, for neutrophils. (p) As in k, for neutrophils. (q) As in i, for macrophages. (r) As in m, for macrophages.
Extended Data Fig. 3. Persistent BAL T cell enrichment is associated with discharged status.

(a) Box plot of BAL CD4+ T cell percentage by discharged versus deceased status. n=432 samples (NPC [n=36], OP [n=187], SARS-CoV-2-P [n=165], and OVP [n=44]). q <0.05, pairwise Wilcoxon rank-sum tests with FDR correction. (b) As in a, for CD8+ T cells. (c) As in a, for Treg cells. (d) As in a, for monocytes. (e) As in a, for macrophages. (f) As in a, grouped by discharged and deceased status and by early (≤48 hours following intubation) and late (>48 hours following intubation) timing of BAL sampling relative to intubation. (g) As in f, for CD8+ T cells. (h) As in f, for Treg cells. (i) As in f, for monocytes. (j) As in f, for macrophages. (k) As in a, for neutrophils. (l) As in f, for neutrophils.
Extended Data Fig. 4. BAL immune cell subset abundance and phenotype correlate with clinical features.

(a) Correlation analysis between the percentage of BAL immune cell subsets and clinical, physiological, and laboratory variables in NPC. No significant values after calculating Spearman rank correlation coefficient with FDR correction. (b) As in a, for OP. (c) As in a, for OVP. (d) Proportion of SARS-CoV-2-P BAL fluid samples, comparing presence or absence of bacterial superinfection with discharged versus deceased status. Nonsignificant by Fisher exact test. (e) Proportion of SARS-CoV-2-P BAL fluid samples, comparing pneumonia episode outcome status (cured, indeterminate, not cured) with discharged versus deceased status (q < 0.05, Fisher exact test with FDR correction). (f) Correlation analysis between BAL CD4+ and CD8+ T cell surface expression of CD127 and HLA-DR and clinical, laboratory, and physiological variables in SARS-CoV-2-P samples. Spearman rank correlation coefficient with FDR correction (q < 0.05 [*]). (g) Left: Correlation plot of CD4+ T cell surface expression of CD127 against the duration of mechanical ventilation. Spearman rank correlation coefficient shown. Shaded area represents 95% CI. Second from left: As in left, for CD4+ T cell surface expression of HLA-DR. Second from right: As in left, for CD8+ T cell surface expression of CD127. Right: As in left, for CD8+ T cell surface expression of HLA-DR.
Extended Data Fig. 5. BAL T cells in SARS-CoV-2-P are transcriptionally enriched for immune processes compared with NPC, OP, and OVP.

(a) Number of patients contributing BAL samples for RNA-seq analysis (n=336 samples; NPC [n=38], OP [n=51], SARS-CoV-2-P [n=200], and OVP [n=47]). (b) Proportion of samples grouped by T cell subset and diagnosis. (c) Number of samples grouped by early (≤48 hours following intubation) and late (>48 hours following intubation) timing of BAL sampling relative to intubation or obtained in patients receiving chronic ventilation. (d) Box plot of mean Sequential Organ Failure Assessment (SOFA) scores over the day of the BAL. Nonsignificant after pairwise Wilcoxon rank-sum tests with FDR correction). (e) Proportion of discharged versus deceased patients. Nonsignificant after pairwise χ2 tests for homogeneity of proportions with FDR correction. (f) Proportion of sex (pairwise χ2 tests for homogeneity of proportions with FDR correction). (g) Top: K-means clustering of 975 differentially expressed genes (q < 0.05, likelihood-ratio test with FDR correction) in CD8+ T cell samples. Columns represent unique samples and column headers are color-coded by diagnosis, discharged versus deceased status, duration of mechanical ventilation (range 0–90 days, blanks indicate chronically ventilated patients), and superinfection status with columns ordered by NPC (n=15), OP (n=15), SARS-CoV-2-P (n=72), and OVP (n=23) and then by days from intubation when the sample was obtained. VAP (ventilator-associated pneumonia) designates samples from NPC or patients with SARS-CoV-2-P or OVP who cleared the virus and then developed bacterial pneumonia. Representative genes are shown for each cluster. Bottom: As in top, for CD4+ T cell samples (866 differentially expressed genes) in NPC (n=14), OP (n=23), SARS-CoV-2-P (n=81), and OVP (n=20). (h) Top: GSEA of Hallmark gene sets for the pairwise comparison between SARS-CoV-2-P samples and OVP samples in CD8+ T cells from g, top. Count denotes pathway size after removing genes not detected in the expression dataset. Enrichment denotes significant (q < 0.25 with FDR correction) upregulated (red) and downregulated (blue) pathways by normalized enrichment score. Bottom: As in h, top for CD4+ T cells from g, bottom. (i) Left: Gene ontology (GO) parent term annotation (q < 0.05 with FDR correction) from cluster 2_CD8. Points are color-coded by unique terms and size denotes the number of genes within each GO term. Right: As in left, for cluster 1_CD8. (j) As in I for cluster 1_CD4.
Extended Data Fig. 6. BAL T cells have an activated memory phenotype during severe pneumonia.

(a) K-means clustering of 80 differentially expressed genes (q < 0.05, likelihood-ratio test with FDR correction) between NPC (n=9), OP (n=13), SARS-CoV-2-P (n=47), and OVP (n=4) in Treg cell samples. Columns represent unique samples and column headers are color-coded by diagnosis, discharged versus deceased status, duration of mechanical ventilation (range 0–90, blanks indicate chronically ventilated patients), and superinfection status. VAP (ventilator-associated pneumonia) designates samples from NPC or patients with SARS-CoV-2-P or OVP who cleared the virus and then developed bacterial pneumonia. Samples were clustered using Euclidean distance and Ward’s minimum variance linkage method. Representative genes are shown for each cluster. (b) GSEA of Hallmark gene sets for the pairwise comparison between SARS-CoV-2-P samples and NPC, OP, and OVP samples in Treg samples from a. Count denotes pathway size after removing genes not detected in the expression dataset. Enrichment denotes significant (q < 0.25 with FDR correction) upregulated (red) and downregulated (blue) pathways by normalized enrichment score. (c) As in b, for the pairwise comparison between SARS-CoV-2-P samples and OVP samples. (d) Deconvolution analysis showing inferred proportion of BAL CD8+ T cell subsets. Column data labels are as in a. (e) Proportion of inferred BAL CD8+ T cell subsets by diagnosis. (q < 0.05, pairwise Wilcoxon rank-sum tests with FDR correction). (f) Proportion of inferred BAL CD8+ T cell subsets by discharged versus deceased status and early (≤48 hours following intubation) and late (>48 hours following intubation) timing of BAL sampling relative to intubation in SARS-CoV-2-P samples (q < 0.05, pairwise Wilcoxon rank-sum tests with FDR correction). (g) As in d, for CD4+ T cell subsets. (h) As in e, for CD4+ T cell subsets. (i) As in f, for CD4+ T cell subsets.
Extended Data Fig. 7. TCR repertoire diversity is lower in SARS-CoV-2-P samples complicated by superinfection or VAP.

(a) Number of patients contributing BAL samples for TCR-seq analysis (n=130 samples; NPC [n=13], OP [n=16], SARS-CoV-2-P [n=73], and OVP [n=28]). (b) Proportion of TCR-seq samples grouped by T cell subset and diagnosis. (c) Number of TCR-seq samples grouped by early (≤48 hours following intubation) and late (>48 hours following intubation) timing of BAL sampling relative to intubation. (d) Box plot of the mean Sequential Organ Failure Assessment (SOFA) scores on the day of BAL sample. Nonsignificant after pairwise Wilcoxon rank-sum tests with FDR correction. (e) Proportion of discharged versus deceased status patients. Nonsignificant after pairwise χ2 tests for homogeneity of proportions with FDR correction. (f) Proportion of sex (pairwise χ2 tests for homogeneity of proportions with FDR correction. (g) TCR richness analysis showing Chao 1 values in combined BAL CD4+ and CD8+ T cells by diagnosis. (q < 0.05, pairwise Wilcoxon rank-sum tests with FDR correction). (h) As in g, grouped by early (≤48 hours following intubation) and late (>48 hours following intubation) timing of BAL sampling relative to intubation. (i) As in g, grouped by discharged versus deceased status. (j) Pearson correlation analysis between TCR richness (Chao 1 values) and patient age in combined BAL CD4+ and CD8+ T cells in SARS-CoV-2-P samples (left) and NPC, OP, and OVP samples (right). Shaded area represents 95% CI. (k) As in j, correlated with the duration of mechanical ventilation. (l) Richness analysis showing Chao 1 values in SARS-CoV-2-P samples grouped by discharged versus deceased status in primary SARS-CoV-2 infection only (top), bacterial superinfection (middle), and VAP (bottom). Wilcoxon rank sum tests.
Extended Data Fig. 8. BAL T cells in SARS-CoV-2-P are virus specific in HLA context.
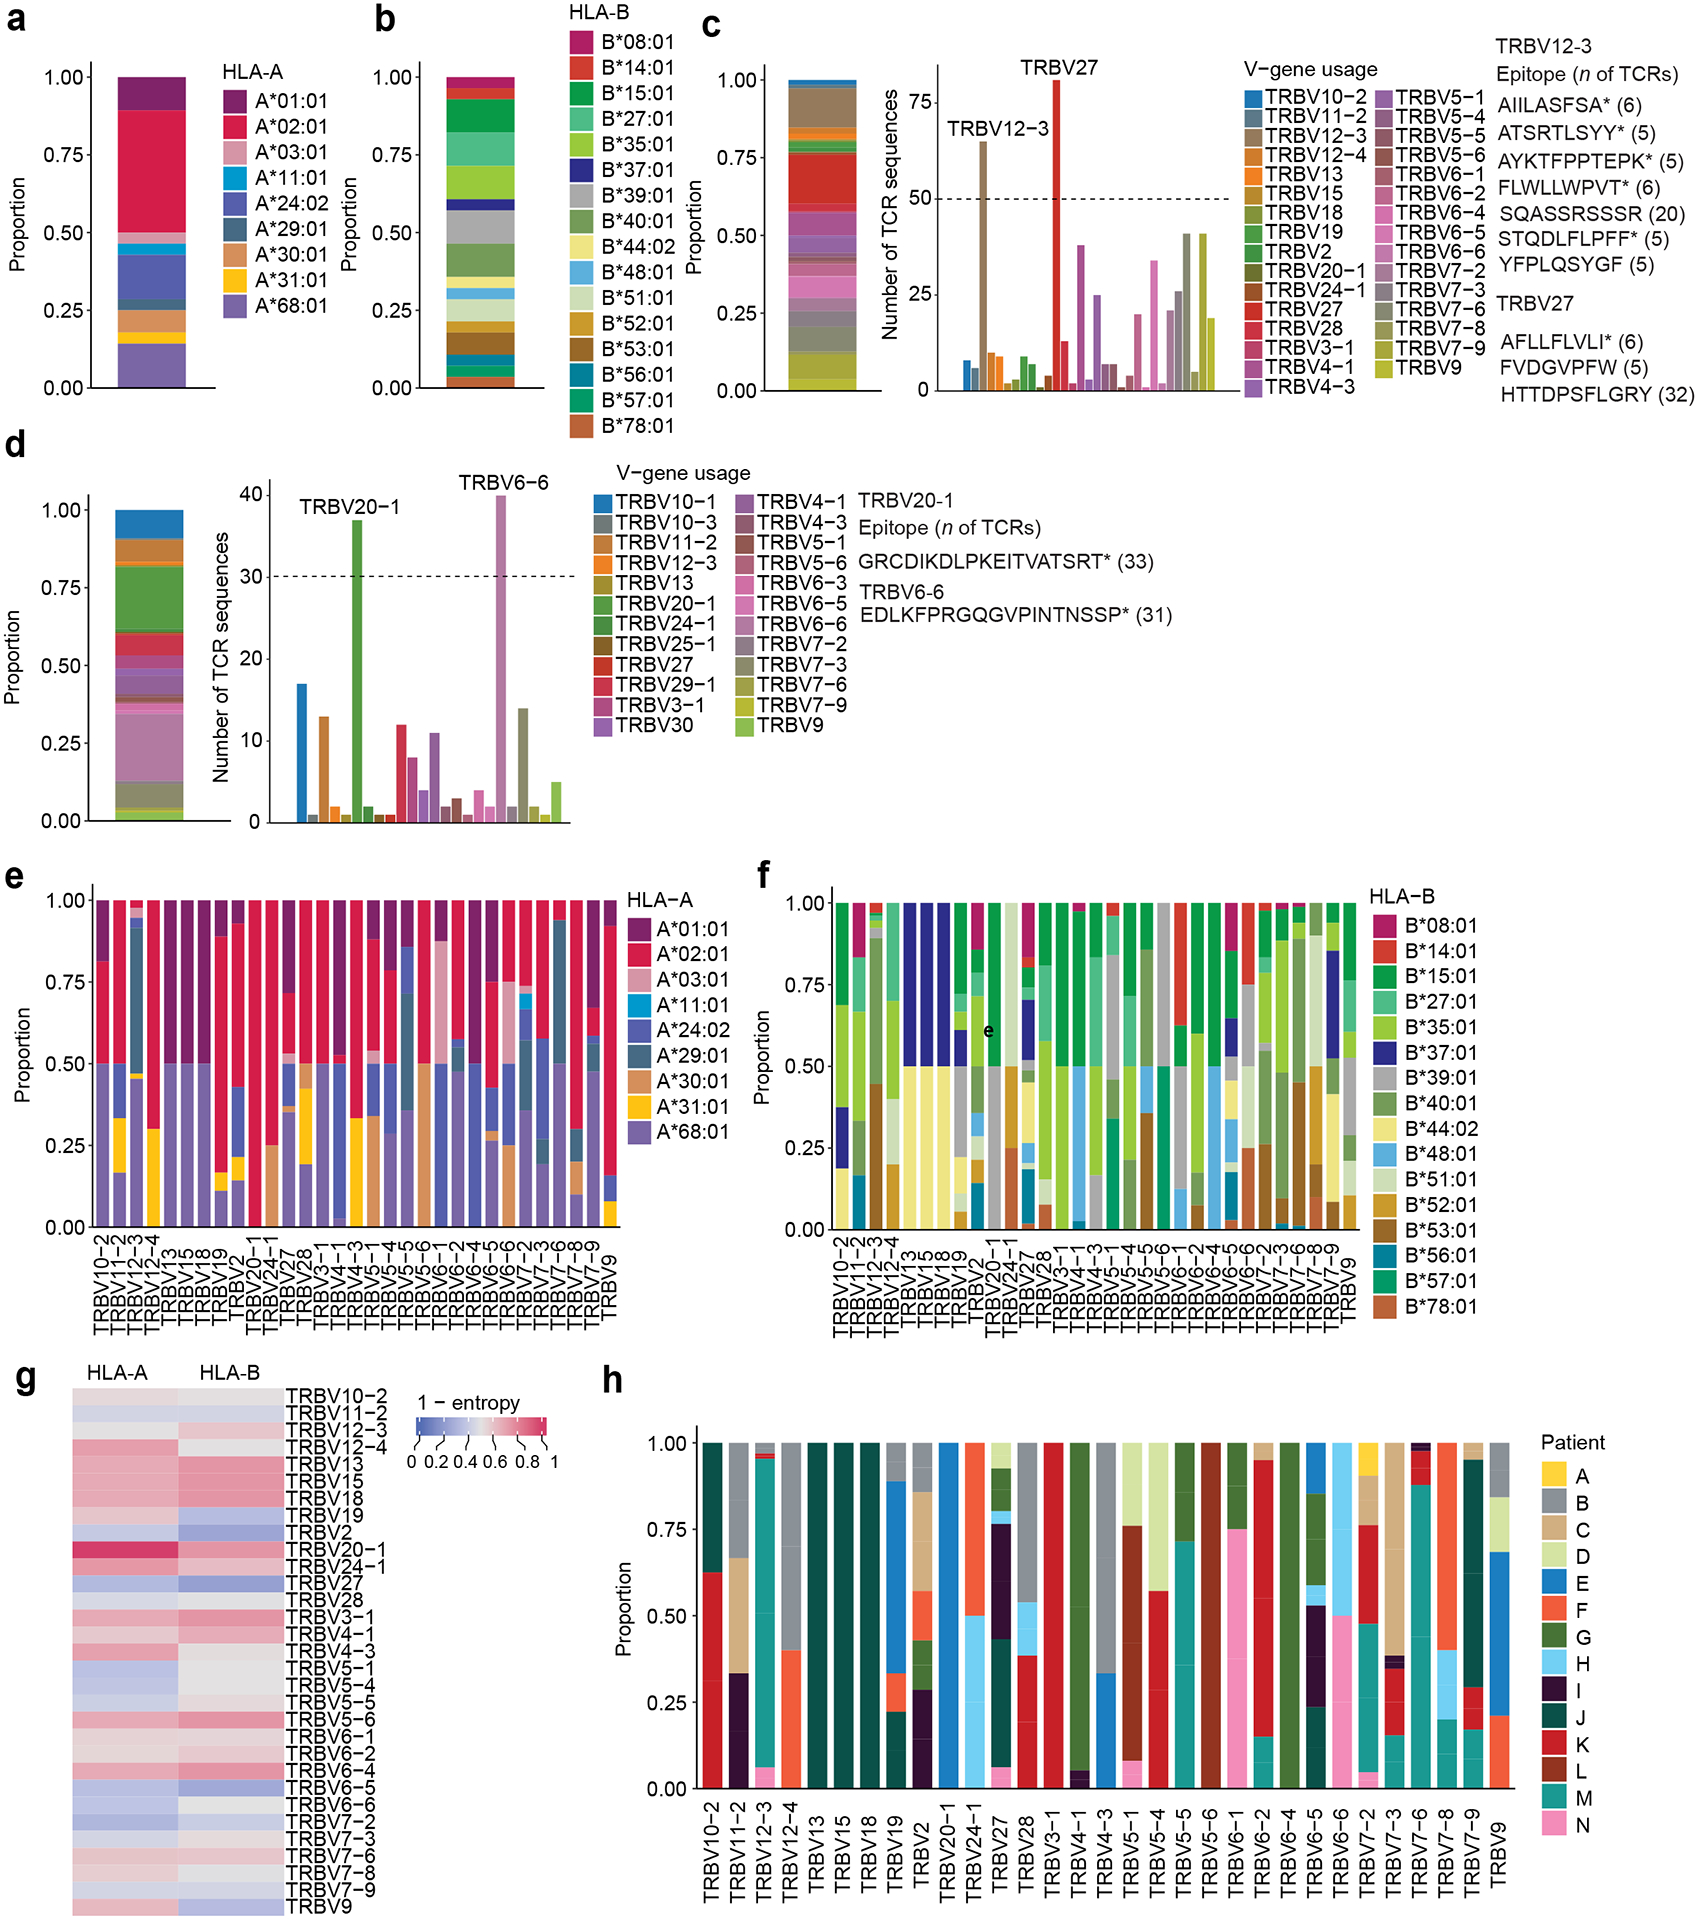
(a) Proportion of HLA-A molecules identified in CD8+ T cells in SARS-CoV-2-P samples (n of patients = 14). (b) As in c, for HLA-B. (c) Left: Proportion of TCRβ (V) gene usage in CD8+ TCR sequences in SARS-CoV-2-P samples (n of patients = 14). Middle: Absolute number of TCRβ sequences for each V region. Right: Representative epitopes from TCR chains exhibiting a count > 5 per dominant gene (TRBV12–3 and TRBV27). (d) As in c, for CD4+ TCR sequences. Right: Dominant genes (TCR count > 30) and representative epitopes are annotated for TRBV6–6 and TRBV20–1. (e) Proportion of HLA-A allele representation for detected CD8+ TCRβ (V) segments. (f) As in e, for HLA-B. (g) Heatmap of association measure of HLA alleles distribution within distinct V genes (1 – normalized Shannon entropy). (h) Proportion of TCRs detected by patient with distinct V gene segments.
Extended Data Fig. 9. Generation probabilities (Pgen) of BAL CD4+ TCRs is lower in SARS-CoV-2-P than in OVP, OP, and NPC.

(a) Logarithmic distribution of Pgen for post-GLIPH2-enriched CDR3β amino acid sequences across diagnoses (q < 0.05, pairwise Wilcoxon rank-sum tests with FDR correction). Each dot corresponds to a TCRβ chain. (b) Probability density of the data in a. (c) Logarithmic distribution of Pgen for post-GLIPH2-enriched and cross-referenced CDR3β amino acid sequences to MIRA MHCII dataset in SARS-CoV-2-P and OP. Each dot corresponds to a TCRβ chain. Nonsignificant after Wilcoxon rank-sum test. (d) Probability density of the data in c. (e) Similarity network analysis of BAL CD4+ TCR sequences cross-referenced to MIRA MHCII dataset epitope pools. Nodes represent unique TCR (CDR3β) sequences and are color-coded by diagnosis status (non-SARS-CoV-2-P [NPC, OP, and OVP], SARS-CoV-2, or shared). Edges connect TCR sequences belonging to the same patterns or specificity groups identified through the GLIPH2 algorithm. Dot size represents calculated generation probability (Pgen) of individual TCRβ sequences. Left: Representative TCR sequences from prominent clusters are annotated.
Supplementary Material
Acknowledgements
We thank the Robert H. Lurie Comprehensive Cancer Center of Northwestern University in Chicago, IL, for the use of the Flow Cytometry Core Facility. The Lurie Cancer Center is supported in part by an NCI Cancer Center Support Grant #P30 CA060553. This research was supported in part through the computational resources and staff contributions provided for the Quest high performance computing facility at Northwestern University which is jointly supported by the Office of the Provost, the Office for Research, and Northwestern University Information Technology. The authors acknowledge the support of The Simpson Querrey Lung Institute for Translational Sciences (SQLIFTS) at Northwestern University, the support of the Dixon Translational Research Grants Initiative at Northwestern Medicine, and the Northwestern University Clinical and Translational Sciences Institute (UL1TR001422). This work was also supported by the Chicago Biomedical Consortium with Support from the Searle Funds at The Chicago Community Trust. NSM was supported by AHA 24PRE1196998. CAG was supported by T32HL076139 and F32HL162377. RAG was funded by NIH grants T32AG020506 and F31AG071225. AVM was supported by NIH grants U19AI135964, P01AG049665, P01HL154998, R01HL153312, R01HL158139, R01ES034350, R21AG075423. RGW was supported by NIH grants U19AI135964, U01TR003528, P01HL154998, R01HL149883, and R01LM013337. GRSB was supported by a Chicago Biomedical Consortium grant, Northwestern University Dixon Translational Science Award, Simpson Querrey Lung Institute for Translational Science (SQLIFTS), and NIH grants AG049665, HL154998, HL14575, HL158139, HL147290, AG075423, AI135964 and The Veterans Administration award I01CX001777. BDS was supported by NIH awards R01HL149883, R01HL153122, P01HL154998, P01AG049665, U19AI135964, and U19AI181102. LM-N was supported by the Parker B. Francis Opportunity Award and NIH awards K08HL15935 and U19AI135964.
Footnotes
The NU SCRIPT Study Investigators are listed in Supplementary Data 14.
Competing Interest Statement
BDS holds United States Patent No. US 10,905,706 B2, “Compositions and Methods to Accelerate Resolution of Acute Lung Inflammation”, and serves on the Scientific Advisory Board of Zoe Biosciences, outside of the submitted work. The other authors have no competing interests to declare.
Code availability. All code used for processing, analysis and figure generation are available at https://github.com/NUPulmonary/2024_Markov_Ren_Senkow.
Data availability.
Patient-specific clinical metadata is available in Supplementary Data 2. De-identified clinical information from this cohort is available on AccessClinicalData@NIAID (https://accessclinicaldata.niaid.nih.gov/study-viewer/clinical_trials/SCRIPT). FACS cell type proportions are available in Supplementary Data 1. Bulk RNA-seq data: raw counts tables for CD4+ T cells, CD8+ T cells and Treg cells are available in Supplemental Data 3, 4, and 5, respectively. Bulk TCR-seq data: MiXCR-processed raw sequencing files for CD4+ T cells and CD8+ T cells are available in Supplementary Data 9 and 10, respectively. Raw data for both bulk RNA-seq and TCR-seq are available in dbGaP repository for the SCRIPT project (phs002300.v1.p1).
The study used reference genome GRCh38 for RNA-seq experiments data processing (available from iGenomes reference, originally donwloaded from NCBI Homo sapiens Annotation Release 106, https://s3.amazonaws.com/igenomes.illumina.com/Homo_sapiens/NCBI/GRCh38/Homo_sapiens_NCBI_GRCh38.tar.gz), single-cell object from Grant et al., 2021 for bulk RNA-seq deconvolution (GSE155249, GSE155249_main.h5ad file), and MIRA (https://adaptivepublic.blob.core.windows.net/publishedproject-supplements/covid-2020/ImmuneCODE-MIRA-Release002.1.zip) and IEDB (http://tools.iedb.org/mhci/download/ and http://tools.iedb.org/mhcii/download/) databases for TCR binding prediction.
References
- 1.Budinger GRS, Misharin AV, Ridge KM, Singer BD & Wunderink RG Distinctive features of severe SARS-CoV-2 pneumonia. J. Clin. Invest 131 (2021). [DOI] [PMC free article] [PubMed] [Google Scholar]
- 2.Gao CA et al. Machine learning links unresolving secondary pneumonia to mortality in patients with severe pneumonia, including COVID-19. J. Clin. Invest 133 (2023). [DOI] [PMC free article] [PubMed] [Google Scholar]
- 3.Grant RA et al. Circuits between infected macrophages and T cells in SARS-CoV-2 pneumonia. Nature 590, 635–641 (2021). [DOI] [PMC free article] [PubMed] [Google Scholar]
- 4.Rydyznski Moderbacher C et al. Antigen-specific adaptive immunity to SARS-CoV-2 in acute COVID-19 and associations with age and disease severity. Cell 183, 996–1012 (2020). [DOI] [PMC free article] [PubMed] [Google Scholar]
- 5.Markov NS et al. SCRIPT CarpeDiem Dataset: demographics, outcomes, and per-day clinical parameters for critically ill patients with suspected pneumonia (version 1.1.0). PhysioNet; 2023. [Google Scholar]
- 6.Pickens CO et al. Bacterial Superinfection Pneumonia in Patients Mechanically Ventilated for COVID-19 Pneumonia. Am. J. Respir. Crit. Care Med 204, 921–932 (2021). [DOI] [PMC free article] [PubMed] [Google Scholar]
- 7.Grant RA et al. Prolonged exposure to lung-derived cytokines is associated with activation of microglia in patients with COVID-19. JCI Insight (2024). [DOI] [PMC free article] [PubMed] [Google Scholar]
- 8.Pickens CI et al. An Adjudication Protocol for Severe Pneumonia. Open Forum Infect Dis 10, ofad336 (2023). [DOI] [PMC free article] [PubMed] [Google Scholar]
- 9.Recovery Collaborative Group et al. Dexamethasone in Hospitalized Patients with Covid-19. N. Engl. J. Med 384, 693–704 (2021). [DOI] [PMC free article] [PubMed] [Google Scholar]
- 10.Wu H, Harder C & Culley C The 2016 Clinical Practice Guidelines for Management of Hospital-Acquired and Ventilator-Associated Pneumonia. Can. J. Hosp. Pharm 70, 251–252 (2017). [DOI] [PMC free article] [PubMed] [Google Scholar]
- 11.Szabo PA et al. Longitudinal profiling of respiratory and systemic immune responses reveals myeloid cell-driven lung inflammation in severe COVID-19. Immunity 54, 797–814 e796 (2021). [DOI] [PMC free article] [PubMed] [Google Scholar]
- 12.Bergamaschi L et al. Longitudinal analysis reveals that delayed bystander CD8+ T cell activation and early immune pathology distinguish severe COVID-19 from mild disease. Immunity 54, 1257–1275 e1258 (2021). [DOI] [PMC free article] [PubMed] [Google Scholar]
- 13.Neidleman J et al. Distinctive features of SARS-CoV-2-specific T cells predict recovery from severe COVID-19. Cell Rep. 36, 109414 (2021). [DOI] [PMC free article] [PubMed] [Google Scholar]
- 14.Mathew D et al. Deep immune profiling of COVID-19 patients reveals distinct immunotypes with therapeutic implications. Science 369 (2020). [DOI] [PMC free article] [PubMed] [Google Scholar]
- 15.Jovisic M, Mambetsariev N, Singer BD & Morales-Nebreda L Differential roles of regulatory T cells in acute respiratory infections. J. Clin. Invest 133 (2023). [DOI] [PMC free article] [PubMed] [Google Scholar]
- 16.Zhao J et al. Airway Memory CD4(+) T Cells Mediate Protective Immunity against Emerging Respiratory Coronaviruses. Immunity 44, 1379–1391 (2016). [DOI] [PMC free article] [PubMed] [Google Scholar]
- 17.Woodland DL & Blackman MA Immunity and age: living in the past? Trends Immunol. 27, 303–307 (2006). [DOI] [PMC free article] [PubMed] [Google Scholar]
- 18.Goronzy JJ, Fang F, Cavanagh MM, Qi Q & Weyand CM Naive T cell maintenance and function in human aging. J. Immunol 194, 4073–4080 (2015). [DOI] [PMC free article] [PubMed] [Google Scholar]
- 19.Goronzy JJ & Weyand CM Successful and Maladaptive T Cell Aging. Immunity 46, 364–378 (2017). [DOI] [PMC free article] [PubMed] [Google Scholar]
- 20.Huang H, Wang C, Rubelt F, Scriba TJ & Davis MM Analyzing the Mycobacterium tuberculosis immune response by T-cell receptor clustering with GLIPH2 and genome-wide antigen screening. Nat. Biotechnol 38, 1194–1202 (2020). [DOI] [PMC free article] [PubMed] [Google Scholar]
- 21.Lineburg KE et al. CD8(+) T cells specific for an immunodominant SARS-CoV-2 nucleocapsid epitope cross-react with selective seasonal coronaviruses. Immunity 54, 1055–1065 e1055 (2021). [DOI] [PMC free article] [PubMed] [Google Scholar]
- 22.Pogorelyy MV et al. Resolving SARS-CoV-2 CD4(+) T cell specificity via reverse epitope discovery. Cell Rep Med 3, 100697 (2022). [DOI] [PMC free article] [PubMed] [Google Scholar]
- 23.Nolan S et al. A large-scale database of T-cell receptor beta (TCRbeta) sequences and binding associations from natural and synthetic exposure to SARS-CoV-2. Res Sq (2020). [Google Scholar]
- 24.Moutaftsi M et al. Uncovering the interplay between CD8, CD4 and antibody responses to complex pathogens. Future Microbiol. 5, 221–239 (2010). [DOI] [PMC free article] [PubMed] [Google Scholar]
- 25.Orenbuch R et al. arcasHLA: high-resolution HLA typing from RNAseq. Bioinformatics 36, 33–40 (2020). [DOI] [PMC free article] [PubMed] [Google Scholar]
- 26.Reynisson B, Alvarez B, Paul S, Peters B & Nielsen M NetMHCpan-4.1 and NetMHCIIpan-4.0: improved predictions of MHC antigen presentation by concurrent motif deconvolution and integration of MS MHC eluted ligand data. Nucleic Acids Res. 48, W449–W454 (2020). [DOI] [PMC free article] [PubMed] [Google Scholar]
- 27.Gonzalez-Galarza FF et al. Allele frequency net database (AFND) 2020 update: gold-standard data classification, open access genotype data and new query tools. Nucleic Acids Res. 48, D783–D788 (2020). [DOI] [PMC free article] [PubMed] [Google Scholar]
- 28.Chi H, Pepper M & Thomas PG Principles and therapeutic applications of adaptive immunity. Cell 187, 2052–2078 (2024). [DOI] [PMC free article] [PubMed] [Google Scholar]
- 29.Schultheiss C et al. Next-Generation Sequencing of T and B Cell Receptor Repertoires from COVID-19 Patients Showed Signatures Associated with Severity of Disease. Immunity 53, 442–455 e444 (2020). [DOI] [PMC free article] [PubMed] [Google Scholar]
- 30.Nguyen THO et al. CD8(+) T cells specific for an immunodominant SARS-CoV-2 nucleocapsid epitope display high naive precursor frequency and TCR promiscuity. Immunity 54, 1066–1082 e1065 (2021). [DOI] [PMC free article] [PubMed] [Google Scholar]
- 31.Le Bert N et al. SARS-CoV-2-specific T cell immunity in cases of COVID-19 and SARS, and uninfected controls. Nature 584, 457–462 (2020). [DOI] [PubMed] [Google Scholar]
- 32.Grifoni A et al. Targets of T Cell Responses to SARS-CoV-2 Coronavirus in Humans with COVID-19 Disease and Unexposed Individuals. Cell 181, 1489–1501 e1415 (2020). [DOI] [PMC free article] [PubMed] [Google Scholar]
- 33.Sekine T et al. Robust T Cell Immunity in Convalescent Individuals with Asymptomatic or Mild COVID-19. Cell 183, 158–168 e114 (2020). [DOI] [PMC free article] [PubMed] [Google Scholar]
- 34.Bacher P et al. Low-Avidity CD4(+) T Cell Responses to SARS-CoV-2 in Unexposed Individuals and Humans with Severe COVID-19. Immunity 53, 1258–1271 e1255 (2020). [DOI] [PMC free article] [PubMed] [Google Scholar]
- 35.Dykema AG et al. Functional characterization of CD4+ T cell receptors crossreactive for SARS-CoV-2 and endemic coronaviruses. J. Clin. Invest 131 (2021). [DOI] [PMC free article] [PubMed] [Google Scholar]
- 36.Mateus J et al. Selective and cross-reactive SARS-CoV-2 T cell epitopes in unexposed humans. Science 370, 89–94 (2020). [DOI] [PMC free article] [PubMed] [Google Scholar]
- 37.Schulien I et al. Characterization of pre-existing and induced SARS-CoV-2-specific CD8(+) T cells. Nat. Med 27, 78–85 (2021). [DOI] [PubMed] [Google Scholar]
- 38.Channappanavar R et al. Dysregulated Type I Interferon and Inflammatory Monocyte-Macrophage Responses Cause Lethal Pneumonia in SARS-CoV-Infected Mice. Cell Host Microbe 19, 181–193 (2016). [DOI] [PMC free article] [PubMed] [Google Scholar]
- 39.Zhao J, Zhao J & Perlman S T cell responses are required for protection from clinical disease and for virus clearance in severe acute respiratory syndrome coronavirus-infected mice. J. Virol 84, 9318–9325 (2010). [DOI] [PMC free article] [PubMed] [Google Scholar]
- 40.Hadjadj J et al. Impaired type I interferon activity and inflammatory responses in severe COVID-19 patients. Science 369, 718–724 (2020). [DOI] [PMC free article] [PubMed] [Google Scholar]
- 41.Tan AT et al. Early induction of functional SARS-CoV-2-specific T cells associates with rapid viral clearance and mild disease in COVID-19 patients. Cell Rep. 34, 108728 (2021). [DOI] [PMC free article] [PubMed] [Google Scholar]
- 42.Swadling L et al. Pre-existing polymerase-specific T cells expand in abortive seronegative SARS-CoV-2. Nature 601, 110–117 (2022). [DOI] [PMC free article] [PubMed] [Google Scholar]
- 43.Ng KW et al. Preexisting and de novo humoral immunity to SARS-CoV-2 in humans. Science 370, 1339–1343 (2020). [DOI] [PMC free article] [PubMed] [Google Scholar]
- 44.Braun J et al. SARS-CoV-2-reactive T cells in healthy donors and patients with COVID-19. Nature 587, 270–274 (2020). [DOI] [PubMed] [Google Scholar]
Methods References
- 1.Grant RA et al. Circuits between infected macrophages and T cells in SARS-CoV-2 pneumonia. Nature 590, 635–641 (2021). [DOI] [PMC free article] [PubMed] [Google Scholar]
- 2.Pickens CO et al. Bacterial Superinfection Pneumonia in Patients Mechanically Ventilated for COVID-19 Pneumonia. Am. J. Respir. Crit. Care Med 204, 921–932 (2021). [DOI] [PMC free article] [PubMed] [Google Scholar]
- 3.Gao CA et al. Machine learning links unresolving secondary pneumonia to mortality in patients with severe pneumonia, including COVID-19. J. Clin. Invest 133 (2023). [DOI] [PMC free article] [PubMed] [Google Scholar]
- 4.Pickens CI et al. An Adjudication Protocol for Severe Pneumonia. Open Forum Infect Dis 10, ofad336 (2023). [DOI] [PMC free article] [PubMed] [Google Scholar]
- 5.Starren JB, Winter AQ & Lloyd-Jones DM Enabling a Learning Health System through a Unified Enterprise Data Warehouse: The Experience of the Northwestern University Clinical and Translational Sciences (NUCATS) Institute. Clin. Transl. Sci 8, 269–271 (2015). [DOI] [PMC free article] [PubMed] [Google Scholar]
- 6.Walter JM, Helmin KA, Abdala-Valencia H, Wunderink RG & Singer BD Multidimensional assessment of alveolar T cells in critically ill patients. JCI Insight 3, e123287 (2018). [DOI] [PMC free article] [PubMed] [Google Scholar]
- 7.Qadir N et al. An Update on Management of Adult Patients with Acute Respiratory Distress Syndrome: An Official American Thoracic Society Clinical Practice Guideline. Am. J. Respir. Crit. Care Med 209, 24–36 (2024). [DOI] [PMC free article] [PubMed] [Google Scholar]
- 8.Beigel JH et al. Remdesivir for the Treatment of Covid-19 - Final Report. N. Engl. J. Med 383, 1813–1826 (2020). [DOI] [PMC free article] [PubMed] [Google Scholar]
- 9.Ewels PA et al. The nf-core framework for community-curated bioinformatics pipelines. Nat. Biotechnol 38, 276–278 (2020). [DOI] [PubMed] [Google Scholar]
- 10.Dobin A et al. STAR: ultrafast universal RNA-seq aligner. Bioinformatics 29, 15–21 (2013). [DOI] [PMC free article] [PubMed] [Google Scholar]
- 11.Patro R, Duggal G, Love MI, Irizarry RA & Kingsford C Salmon provides fast and bias-aware quantification of transcript expression. Nat Methods 14, 417–419 (2017). [DOI] [PMC free article] [PubMed] [Google Scholar]
- 12.Robinson MD, McCarthy DJ & Smyth GK edgeR: a Bioconductor package for differential expression analysis of digital gene expression data. Bioinformatics 26, 139–140 (2010). [DOI] [PMC free article] [PubMed] [Google Scholar]
- 13.Gu Z, Eils R & Schlesner M Complex heatmaps reveal patterns and correlations in multidimensional genomic data. Bioinformatics 32, 2847–2849 (2016). [DOI] [PubMed] [Google Scholar]
- 14.Rahnenfuhrer AA. topGO: Enrichment Analysis for Gene Ontology. 2023.
- 15.Durinck S, Spellman PT, Birney E & Huber W Mapping identifiers for the integration of genomic datasets with the R/Bioconductor package biomaRt. Nat. Protoc 4, 1184–1191 (2009). [DOI] [PMC free article] [PubMed] [Google Scholar]
- 16.Sayols S rrvgo: a Bioconductor package for interpreting lists of Gene Ontology terms. MicroPubl Biol 2023 (2023). [DOI] [PMC free article] [PubMed] [Google Scholar]
- 17.Subramanian A et al. Gene set enrichment analysis: a knowledge-based approach for interpreting genome-wide expression profiles. Proc. Natl. Acad. Sci. U. S. A 102, 15545–15550 (2005). [DOI] [PMC free article] [PubMed] [Google Scholar]
- 18.Korotkevich G, Sukhov V & Sergushichev A Fast gene set enrichment analysis. bioRxiv, 060012 (2019). [Google Scholar]
- 19.Aliee H & Theis FJ AutoGeneS: Automatic gene selection using multi-objective optimization for RNA-seq deconvolution. Cell Syst 12, 706–715 e704 (2021). [DOI] [PubMed] [Google Scholar]
- 20.Bolotin DA et al. MiXCR: software for comprehensive adaptive immunity profiling. Nat Methods 12, 380–381 (2015). [DOI] [PubMed] [Google Scholar]
- 21.Nazarov V et al. immunarch: Bioinformatics Analysis of T-Cell and B-Cell Immune Repertoires. 2023.
- 22.Orenbuch R et al. arcasHLA: high-resolution HLA typing from RNAseq. Bioinformatics 36, 33–40 (2020). [DOI] [PMC free article] [PubMed] [Google Scholar]
- 23.Huang H, Wang C, Rubelt F, Scriba TJ & Davis MM Analyzing the Mycobacterium tuberculosis immune response by T-cell receptor clustering with GLIPH2 and genome-wide antigen screening. Nat. Biotechnol 38, 1194–1202 (2020). [DOI] [PMC free article] [PubMed] [Google Scholar]
- 24.Nolan S et al. A large-scale database of T-cell receptor beta (TCRbeta) sequences and binding associations from natural and synthetic exposure to SARS-CoV-2. Res Sq (2020). [Google Scholar]
- 25.Butts C network: Classes for Relational Data. 2015.
- 26.Pedersen T tidygraph: A Tidy API for Graph Manipulation. 2023.
- 27.Virtanen P et al. SciPy 1.0: fundamental algorithms for scientific computing in Python. Nat Methods 17, 261–272 (2020). [DOI] [PMC free article] [PubMed] [Google Scholar]
- 28.Dash P et al. Quantifiable predictive features define epitope-specific T cell receptor repertoires. Nature 547, 89–93 (2017). [DOI] [PMC free article] [PubMed] [Google Scholar]
- 29.Reynisson B, Alvarez B, Paul S, Peters B & Nielsen M NetMHCpan-4.1 and NetMHCIIpan-4.0: improved predictions of MHC antigen presentation by concurrent motif deconvolution and integration of MS MHC eluted ligand data. Nucleic Acids Res. 48, W449–W454 (2020). [DOI] [PMC free article] [PubMed] [Google Scholar]
- 30.Constantin A & Patil I. ggsignif: R Package for Displaying Significance Brackets for ‘ggplot2’. PsyArxiv (2021). [Google Scholar]
- 31.Kassambara A ggpubr: ‘ggplot2’ Based Publication Ready Plots. 2023.
- 32.Wickham H ggplot2: Elegant Graphics for Data Analysis. Springer-Verlag: New York, 2016. [Google Scholar]
Associated Data
This section collects any data citations, data availability statements, or supplementary materials included in this article.
Supplementary Materials
Data Availability Statement
Patient-specific clinical metadata is available in Supplementary Data 2. De-identified clinical information from this cohort is available on AccessClinicalData@NIAID (https://accessclinicaldata.niaid.nih.gov/study-viewer/clinical_trials/SCRIPT). FACS cell type proportions are available in Supplementary Data 1. Bulk RNA-seq data: raw counts tables for CD4+ T cells, CD8+ T cells and Treg cells are available in Supplemental Data 3, 4, and 5, respectively. Bulk TCR-seq data: MiXCR-processed raw sequencing files for CD4+ T cells and CD8+ T cells are available in Supplementary Data 9 and 10, respectively. Raw data for both bulk RNA-seq and TCR-seq are available in dbGaP repository for the SCRIPT project (phs002300.v1.p1).
The study used reference genome GRCh38 for RNA-seq experiments data processing (available from iGenomes reference, originally donwloaded from NCBI Homo sapiens Annotation Release 106, https://s3.amazonaws.com/igenomes.illumina.com/Homo_sapiens/NCBI/GRCh38/Homo_sapiens_NCBI_GRCh38.tar.gz), single-cell object from Grant et al., 2021 for bulk RNA-seq deconvolution (GSE155249, GSE155249_main.h5ad file), and MIRA (https://adaptivepublic.blob.core.windows.net/publishedproject-supplements/covid-2020/ImmuneCODE-MIRA-Release002.1.zip) and IEDB (http://tools.iedb.org/mhci/download/ and http://tools.iedb.org/mhcii/download/) databases for TCR binding prediction.