

Summary
Control of the electrochemical environment in living cells is typically attributed to ion channels. Here we show that the formation of biomolecular condensates can modulate the electrochemical environment in bacterial cells, which affects cellular processes globally. Condensate formation generates an electric potential gradient, which directly affects the electrochemical properties of a cell, including the cytoplasmic pH and the membrane potential, and condensate formation amplifies the cell-cell variability of their electrochemical properties due to the passive environmental effect. The modulation of the electrochemical equilibria further controls cell-environment interactions, thus directly influencing bacterial survival under antibiotic stress. The condensate-mediated shift of the intracellular electrochemical equilibria also drives a global change of the gene expression profile. Our work reveals biochemical functions of condensates, which extend beyond the biomolecules driving and participating in condensate formation, and uncovers a role of condensates in regulating global cellular physiology.
In brief
Biomolecular condensation modulates the electrochemical equilibria of a cell, affecting cytoplasmic ion distribution and membrane potential. These electrochemical environmental features mediated by condensate formation modulate bacterial cellular physiology.
Graphical Abstract

Introduction
Biomolecular condensates are ubiquitous meso-micro scale cellular structures that regulate various cellular processes, such as transcription, stress response, and RNA splicing 1,2. The formation of condensates is driven by the phase transition of multivalent associative biomacromolecules 3. Studies have uncovered the molecular signatures that encode the phase behaviors in biomacromolecules and the mechanisms by which cells use compartmentalization of specific biomacromolecules to modulate cellular functions 4–6. Besides the participation of biomacromolecules in condensate formation, experimental and theoretical studies have discovered that biomolecular condensates can also spatially segregate ions 7–12, which can result in a pH gradient, and thereby establish an electric potential gradient between the dilute and the dense phases 7,8. A prime example of such an ion gradient is the pH difference between the nucleolar compartment and the nucleoplasm 13,14.
Small ions are the most abundant cellular constituent other than water 15. The spatial distribution of ions dictates the cellular electrochemical potential, which serves as a fundamental driving force of biochemical reactions and cellular signaling 16, such as the proton motive forces set by a membrane electric potential 17. Our present understanding of the mechanism by which ions are modulated intracellularly primarily originates from studies of ion channels in cellular membranes 18.
Simulations based on liquid-state theory predict that complex coacervation, a type of phase separation, can result in an electrostatic potential difference—a Galvani potential—between the dilute and the dense phases 8–10,19,20. Indeed, our recent study demonstrated that condensate formation by certain intrinsically disordered proteins (i.e., resilin-like-polypeptides) could generate an electrical potential gradient between the dilute and the dense phases 7, and thereby create an interfacial electrical double layer that can drive redox reactions. These findings imply a possibility that the phase transition of biomacromolecules can affect the electrochemical equilibria of the entire solution system. However, it is unclear whether condensate formation can modulate the electrochemical environment in the cytoplasm, thereby affecting the intracellular electrochemical equilibrium, and whether this would have an impact on cellular physiology and functions.
Here, we demonstrate the role of condensates in modulating the cytoplasmic ion environment and its functional consequences on the electrochemical equilibria of cells. We find that the selective partitioning or exclusion of ions by condensate formation in a cell can alter the cytoplasmic ionic environment in terms of its spatial pH and the distribution of specific ions. The asymmetry in the distribution of specific ions in the cytoplasm modulates the cellular membrane potential. We further show that these features have a long-reaching impact, including modulation of the interactions between the cell and its environment and regulation of gene expression on a global scale in cells. Moreover, the capacity for this global control depends on the volume fraction of condensates within a cell, which generates highly variable cellular behaviors due to the stochasticity in gene expression. This heterogeneity in cellular behaviors due to condensate formation is in sharp contrast to the role of condensates in mediating the protein concentration homeostasis of the phase separating protein, as shown previously 21. This work uncovers a functional role for condensates in the regulation of cellular electrochemical equilibria, by which condensates can modulate global cellular processes.
Results
Condensation formation modulates abundance of ions in the cytoplasm
We previously found that condensates (the dense phase) possess a distinct pH environment from the cytoplasmic environment (the dilute phase) 7 (Figure 1A). To understand the effects of condensates on cytoplasmic ion environment, we first expanded these results by using the same synthetic intrinsically disordered protein (synIDP) 22, consisting of a resilin-like-polypeptide (RLP; amino acid sequence: Ser-Lys-Gly-Pro-[Gly-Arg-Gly-Asp-Ser-Pro-Tyr-Ser]20-Gly-Tyr) (Table S1), which undergoes phase separation via an upper critical solution temperature (UCST) phase transition 23,24. This synIDP shares similar sequence features and the same thermodynamic driving force as many native IDPs that can drive condensate formation, such as FUS and hnRNP A1 4,25. We placed the synIDP in a pET-24 plasmid under the control of a T7 promoter containing a lac operator, which is inducible by isopropyl ß-D-1-thiogalactopyranoside (IPTG) in E. coli cells expressing LacI 24.
Figure 1. Condensate formation modulates cytoplasmic ion abundance.

A, Phase transition of associative macromolecules can lead to segregation or exclusion of specific types of ions, which can modulate the intracellular ion distribution.
B, Condensate formation mediates a distinct cytoplasmic pH condition as evaluated by C-SNARF-4-AM assay. Line profile shows the spatial pH condition of cells with or without condensates. Lower the C-SNARF-4 ratio corresponds to more basic pH.
C, Inductively coupled plasma mass spectrometry (ICP-MS) analysis of the effects of phase transition of an RLP on cytoplasmic ion concentration. Upper critical solution temperature (UCST) transition behavior is utilized to dissolve RLP condensates by increasing the solution temperature above the transition temperature of the RLP. The supernatant fraction corresponds to the condition of cytoplasm. The supernatant is treated with proteinase K (a final concentration of 0.4 units/mL) and benzonase nuclease (25 units/mL) before analysis by ICP-MS. The ICP-MS result was converted back to estimated cellular ion concentration through cell density and dilution ratio based on the sample processing methods.
D, Cytoplasmic ion concentration of sodium, potassium, magnesium and calcium ions at conditions with or without RLP condensates. Two-tailed t-test for statistical analysis. ns = non-significant. Data are represented as mean ± SD.
Using a pH-dependent ratiometric dye, C-SNARF-4-AM26, we found that condensate formation by the RLP led to a more acidic cytoplasmic pH and a more alkaline environment in the condensate (Figure 1B & Figure S1A&B) within a wide range of the external pH conditions (Figure S1C). We further measured pH modulation using a genetically encoded intracellular ratiometric pH sensing protein, pHluorin27,28, which confirmed the decrease in cytoplasmic pH upon condensate formation (Figure S1D&E). We next investigated condensates formed by an elastin-like polypeptide (ELP) with a sequence of [Val-Pro-Gly-Val-Gly]40 that can undergo phase transition by a lower critical solution temperature (LCST) transition29, but cannot generate an ion gradient 7. We found that the ELP condensates did not significantly affect the cytoplasmic pH (Figure S1F).
The pH gradient between the dilute and the dense phases arises from the differences in the electrical potentials between the two phases under electrochemical potential equilibrium in a solution 9,10,30–32. The establishment of this electric potential gradient is determined by the asymmetric distribution of ions and biomolecules. The charge neutrality in a phase requires a selective partitioning or exclusion of other types of small ions in the two phases, as demonstrated by two-phase aqueous systems formed by complex coacervation 8,9,19,33–36. To identify these ions and measure the change of their abundance upon condensation, we used inductively coupled plasma mass spectrometry (ICP-MS) 37,38. We applied an established protocol to achieve bulk phase separation from mechanically disrupted cells and exploited the temperature sensitivity of the UCST phase behavior of the RLP to dissolve the separated dense phase after isolation directly in the cell lysate23 (Figure 1C). This strategy was applied to generate samples with and without condensates, and enabled us to evaluate the effects of condensation on modulating the ion distribution in a physiologically meaningful environment 39. We measured the abundance of ions in the dilute phase of the samples with and without condensates by ICP-MS and calculated the change of ion concentrations in the cytoplasmic environment upon condensation.
We measured the concentration of four different cations, sodium (Na+), potassium (K+), magnesium (Mg2+) and calcium (Ca2+) ions (Figure 1D), as their distributions are known to control the intracellular pH and various cellular processes, such as ribosome activity and stress resistance 40–44. We found that condensates reduced the cytoplasmic concentration of Mg2+ and Ca2+ by ~2-fold and ~1.4-fold. As the typical volume ratio between condensates and cytoplasm is ~1:4, this implies that condensates have a 5-fold higher Mg++ concentration relative to the cytoplasm. This feature might be attributed to the role of divalent cations in bridging the electrostatic interactions in the dense phase45,46. In contrast, Na+ was excluded from condensates, with condensate formation increasing the cytoplasmic Na+ concentration by 19% compared with that of samples without condensates. The exclusion of Na+ by the condensates might be due to the change of the hydration property of Na+ ions in the condensate solvent environment 47. We did not observe an effect of condensate formation on the distribution of K+ between the two phases. To verify that this modulation by cytoplasmic ions is specifically caused by the RLP condensation, we reconstituted RLP condensates in vitro with purified RLP in a buffer that mimics the physiological salt concentrations 48, and measured ion concentrations in both the dense and the dilute phases (Figure S2A). We found that the divalent cations were enriched in the condensates while all the monovalent cations were excluded from the condensates (Figure S2B). Besides that the purified system showed significant exclusion of potassium ions from the dense phase, while the cell lysate system showed no significant change of the potassium ions, the ion modulation effect aligns with the cell lysate assay. This experiment confirms that condensate formation alone can cause selective partition or exclusion of certain ions. We next measured the ion distribution in the case of ELP condensates. We found that formation of ELP condensates led to a slight change in the concentration of all of these ions in the cytoplasm with exclusion of potassium ion and partitioning of calcium ion to be statistically significant (Figure S2C), which was further evaluated by in vitro reconstitution measurements by purified ELP condensates (Figure S2D). However, the degree of ion modulation by the ELP condensates is less noticeable comparing to that of RLP condensates.
These observations confirm the correlation between a pH gradient between the dilute and dense phases and the capability of condensates to modulate the distribution of small ions in the cytoplasm. The asymmetric distribution of ions between the dilute and the dense phases further suggests that condensate formation can modulate the electrochemical equilibria within a cell.
Volume fraction of condensates modulates cytoplasmic ion and generates noise in cells
During phase separation, thermodynamic constraints dictate that, for a one-component phase separating system49, such as the RLP system, phase separation provides a mechanism to reduce noise in the cytoplasmic concentration of the phase separating component 21. As the concentration of the RLP in the cytoplasm exceeds its Csat, the system enters the two-phase region of the phase diagram and the concentration in each phase stays approximately the same. The increase in the total amount of RLP in a cell is reflected by an increase in the volume fraction of the RLP condensates 50,51 (Figure S3A).
If RLP expression is variable between cells due to stochastic gene expression, this variability will be reflected in the volume fraction of condensates of individual cells (Figure 2A) 52. To test this notion, we modeled the dynamics of phase separation coupled with stochastic gene expression by adopting the framework of Kolesin et al. 21. Our model accounts for both intrinsic noise due to effects of small numbers of interacting molecules and extrinsic noise due to cell-to-cell heterogeneity (see Methods for description of model)53. Consistent with a previous study 21, simulations show that condensate formation led to reduced variability (measured by the coefficient of variation, or CV) in the cytoplasmic concentration of the condensate-forming protein, relative to that of total protein (Figure 2B). In contrast, the volume fraction of the condensates in a cell had similar variability as the phase separating protein of a cell (Figure 2B).
Figure 2. Condensate formation increases the heterogeneity of cellular physiology.

A, Stochastic gene expression leads to variations in condensate formation between cells.
B, Amplitude of noise expressed as coefficient of variance in the total protein concentration, cytoplasmic protein (dilute phase) concentration and condensate volume fraction as a function of expression level. Data are represented as mean ± SD.
C, Dependency of cytoplasmic pH on condensate volume fraction from cells induced for expression for different amounts of times (30 min, 60 min, 180 min and 300 min). Each data point represents a single cell.
D, Single-cell pH variance before and after condensate formation. Cells were analyzed at different time points before (30 min, 0 min before induction) and after condensate formation (60 min, 120 min and 180 min after induction). Coefficient of variance (CV) = (standard deviation/mean)*100. N = 75 individual cells. Data are represented as mean ± SD.
Many native condensates are composed of more than one component51,54. To examine the potential impact of this cofounding factor, we studied the cellular noise caused by a two-component phase separation system based on a previously developed model55 (see Methods). Similarly, phase separation of a two-component system causes the decrease of fluctuations of the concentration of the phase separation driving protein (Figure S3B), but the noise does not go to zero, which is due to the non-fixed binodal points in a multi-component system. We found that the fluctuations of the total protein level still manifest in the volume fraction of the condensates (Figure S3B), suggesting the generality of this feature.
As the total capacity of a phase to partition or exclude ions is proportional to the total volume of the phase, the heterogeneity in the volume fraction of condensates between cells would drive a corresponding heterogeneity in the cytoplasmic ion environment between individual cells. To test this notion, we measured the cytoplasmic pH of individual cells at different time points after induction of RLP expression that corresponded to different condensate volume fractions. We found that a larger condensate volumetric fraction corresponds to a more acidic cytoplasmic pH value, as seen by a higher C-SNARF-4 signal (Figure 2C). We did not find a strong correlation between the dense phase pH and the volume fraction of the condensates (Figure S3C). Moreover, cells with condensates showed a 1.5 fold increase in the variability of their cytoplasmic pH compared to cells without condensates (Figure 2D).
To verify whether the modulation of the cytoplasmic chemical environment is due to the fluctuations of the condensate volume fraction instead of the fluctuations of the cytoplasmic RLP concentration, we measured the cytoplasmic protein concentration before and after condensate formation in individual cells using a previously established fluorescence based method by fusing the RLP with a monomeric green fluorescent protein (mEGFP) 24. We found a slightly reduced variability of cytoplasmic protein concentration after condensate formation (Figure S3D), consistent with our model prediction and previous experimental observation 21. Thus, the amplified cytoplasmic pH variability across a cell population was not due to the fluctuation of protein concentration in the cytoplasm. Taken together, our results confirm that for the environmental effect brought about by condensate formation, phase separation amplifies the cell-cell variability in the intracellular chemical environment.
Intracellular phase separation modulates membrane potential
Cells typically exert control over their intracellular ion content through ion channels 56–58, which in turn modulate the membrane potential 59. As membrane potential is sensitive to the intracellular electrochemical environment59–62, with the new equilibrium state of intracellular ion distribution established by condensates, condensate formation could modulate the electrochemical equilibrium between extracellular and intracellular ions and thereby change the membrane potential (Figure 3A).
Figure 3. Biomolecular condensates regulate membrane potential, establishing a new electrochemical equilibrium between the intracellular and extracellular environment.
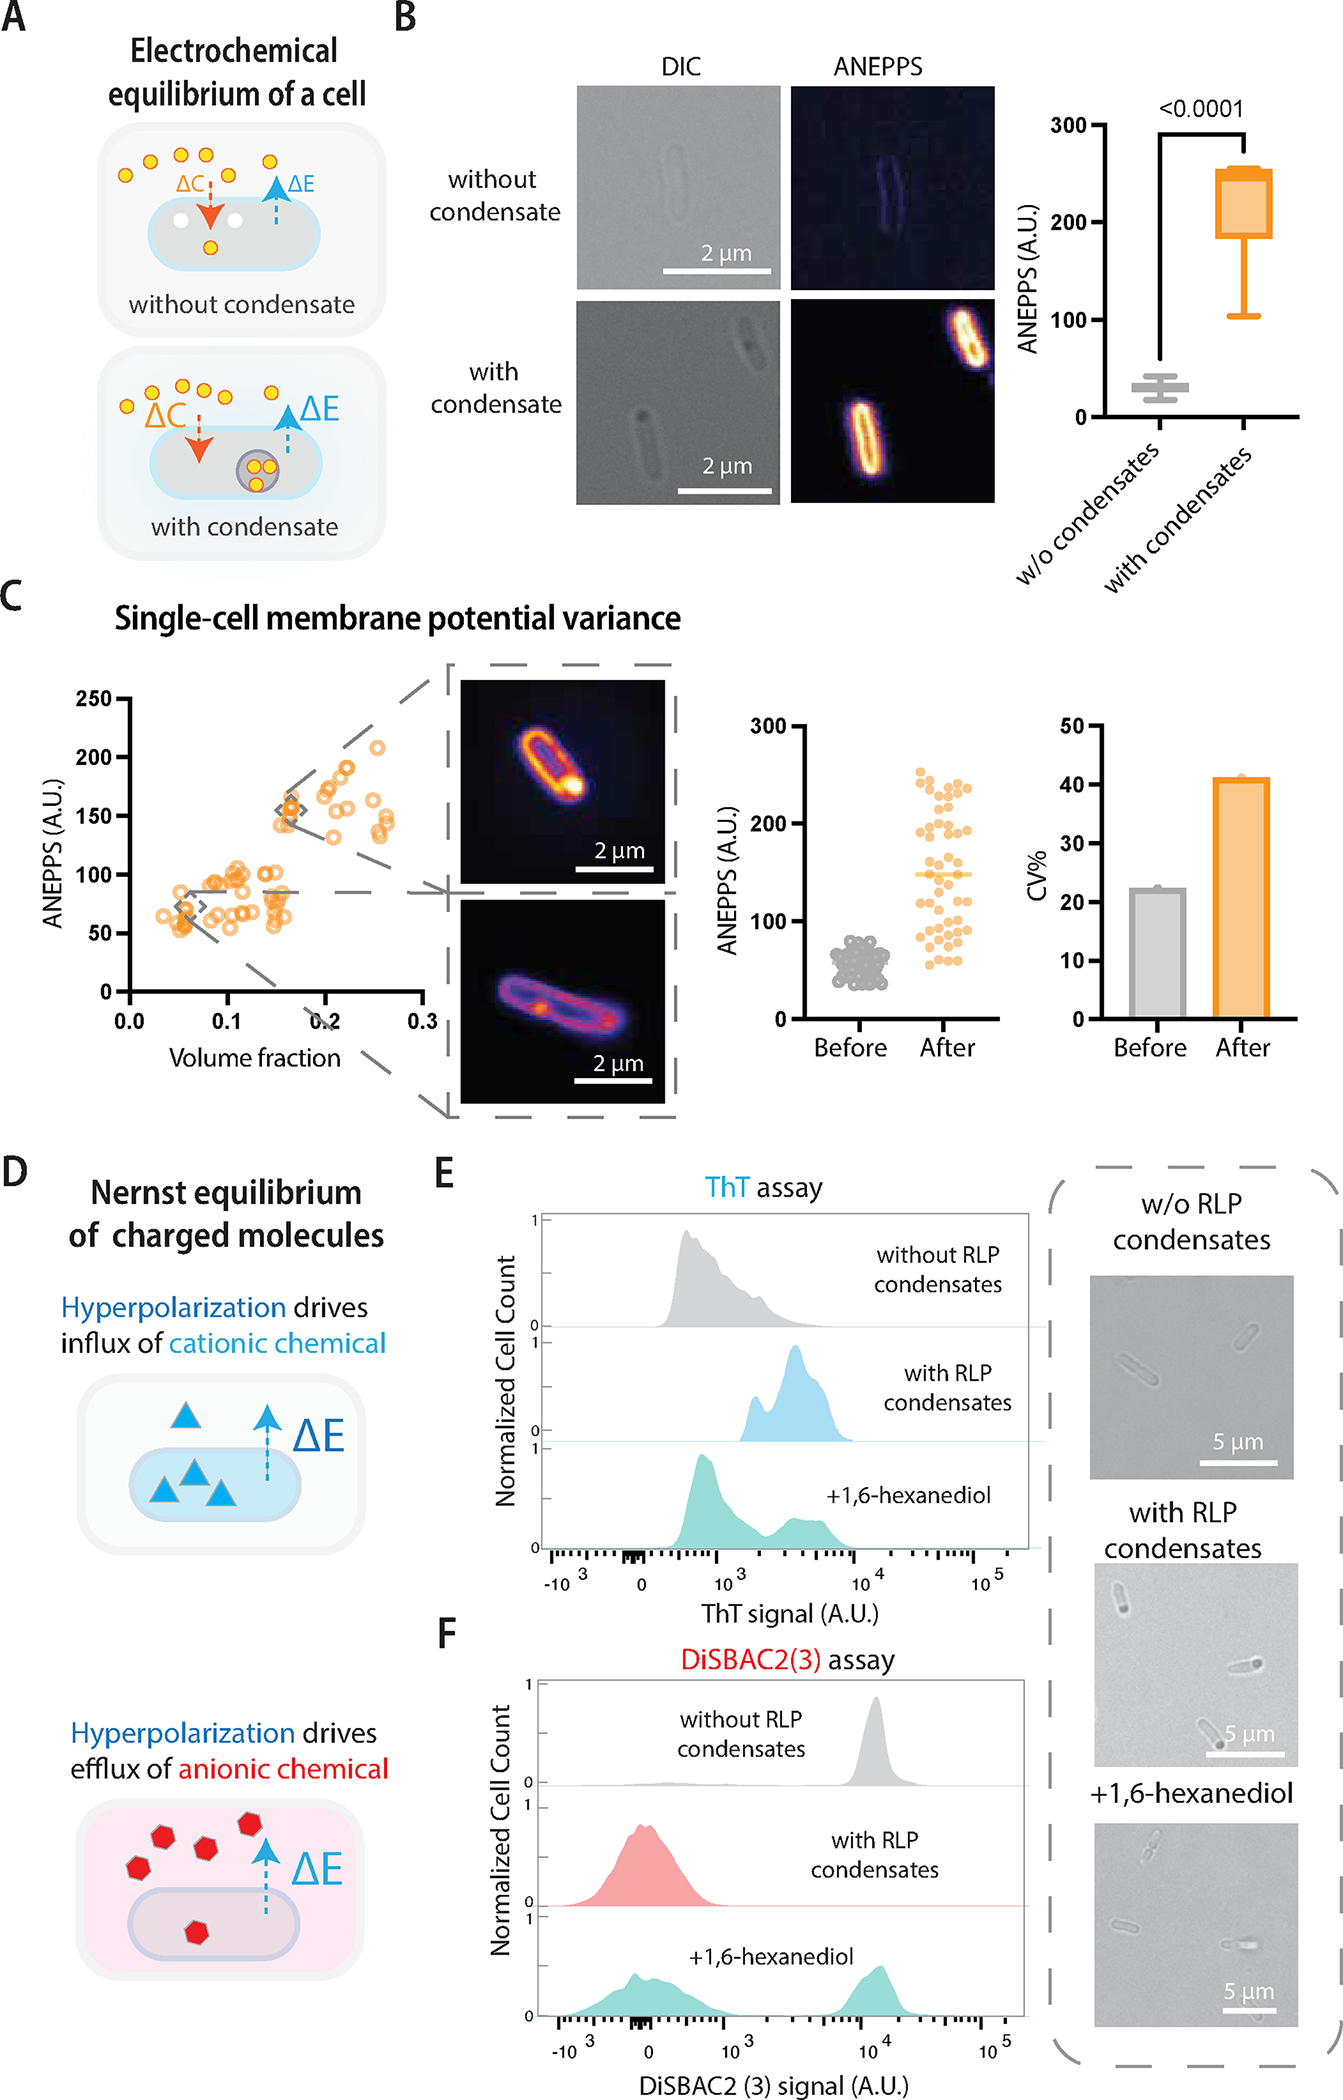
A, Electrochemical potential equilibrium between extracellular and intracellular environments is modulated by condensate formation.
B, Sample images of DI-4-ANEPPS dye that measures the change of membrane potential upon condensate formation. A higher fluorescence corresponds to membrane hyperpolarization. The box center line represents the medium and whiskers suggest min to max. Two-tailed t-test for statistical analysis.
C, Dependency of membrane potential on condensate volume fraction of cells induced for RLP expression for different amounts of times (30 min, 60 min, 180 min and 300 min). Each data point represents a single cell. The quantification of signal fluctuations shows single-cell membrane potential variance before and after condensate formation. Cells were analyzed at different time points before (45 min, 0 min before induction) and after condensate formation (60 min, 180 min and 240 min after induction). Coefficient of variance (CV) = (standard deviation/mean)*100. N = 50 individual cells.
D, Membrane potential modulates the distribution of charged membrane potential dyes based on Nernst equilibrium. The hyperpolarization mediates influx of cationic molecules and efflux of anionic molecules.
E, Flow cytometry analysis of ThT (a cationic membrane potential dye) signal of single cells based on different conditions of cells without or with RLP condensates or with RLP condensates followed by 1,6-hexanediol treatment. Phase contrast images show the representative images of cells at different conditions.
F, Flow cytometry analysis of DiSBAC2(3) (an anionic membrane potential dye) signal of single cells based on different conditions of cells without or with RLP condensates or with RLP condensates followed by 1,6-hexanediol treatment.
To test this hypothesis, we measured the membrane potential of cells with and without RLP condensates by incubating log-phase growing cells in Hank’s balanced salt solution (HBSS) at the same cellular density. We first used an Amino Naphthyl Ethenyl Pyridinium dye (DI-4-ANEPPS) to evaluate the change of membrane potential; upon binding to the cellular membrane, the dye generates a fluorescence signal whose intensity increases with the hyperpolarization of the membrane potential based on a local electric field-dependent change in the electronic structure of the dye 63,64. Indeed, the fluorescence intensity of membrane-associated ANEPPS was ~7.5fold higher in cells containing condensates than those without condensates (Figure 3B). The condensates also showed a substantial increase in the ANEPPS signal compared to the cytoplasm, which is consistent with our previous study that the interface of condensates has an electric potential gradient 7. In single cells where condensate formation was induced for different durations of time, the membrane potential increased with the volume fraction of condensates (Figure 3C). Moreover, condensate formation led to a CV% of 40 % of membrane potential signal, which is similar to the variability of volume fraction (Figure 2B). These results demonstrate that the capability of condensates to modulate intracellular electrochemical equilibria can affect membrane potential, providing another biophysical basis of the global impact of condensates on cellular physiology.
The change of membrane potential may have two distinct causes: 1) the distribution of charged species in the extracellular and intracellular environment is different before and after condensate formation, and 2) the function of the ion channel is specifically affected due to condensate formation. To explore the possible driving forces, we first used a fluorescence-based thioflavin-T (ThT) assay 60. The uptake of ThT into the cells is based on the Nernst equilibrium principle 65; thus the intracellular abundance of ThT serves as a measure of the membrane potential (Figure 3D). We observed that cells with RLP condensates exhibited a 10-fold increase in the ThT signal than those without condensates (Figure 3D), indicating a more negative membrane potential (a state of hyperpolarization) upon condensate formation 60,66. To test whether this effect was primarily caused by condensate formation, we used 1,6-hexanediol, a hydrophobic molecule that can dissolve condensates in bacteria67, to reverse condensate formation and evaluated the response of membrane potential. We found that 15 min treatment of cells containing condensates with 1,6-hexanediol restored the membrane potential to a level similar to that of cells without condensates (Figure 3E), confirming the contribution of condensates to the change of membrane potential.
To further verify the effect of condensate formation on membrane potential based on the Nernst equilibrium principle, we used a negatively charged Nernst dye, Bis-(1,3-Dibutylbarbituric Acid) Trimethine Oxonol (DiBAC4(3)) 68–70, in which the hyperpolarization effect leads to an efflux of anionic dyes (Figure 3D). Compared to cells without condensates, cells with condensates showed significantly lower signal of DiBAC4(3) (Figure 3E), suggesting that the membrane potential was hyperpolarized. The condensation-mediated redistribution of charged membrane potential dye following the Nernst equilibrium confirms that the change of membrane potential arises from the impact of condensates on intracellular electrochemical equilibria, which in turn reflects on the an enhanced asymmetric distribution of ions between the intracellular and extracellular milieu.
We next combined the Nernst assay with a chemical-clamp method 60 to evaluate the ion drivers that mediate the change of membrane potential (Figure S4A). To this end, we supplemented the test buffer (HBSS with ThT dye) with different monovalent and multivalent cations (Na+, K+, Mg2+, Ca2+) that are known to affect membrane potential 64 and measured the change of the ThT signal for cells with condensates relative to that of cells without condensates. The addition of Mg2+ and Ca2+ substantially repressed the ThT fluorescence to the level similar to the cells without condensates (Figure S4B). This observation indicates that the hyperpolarized membrane potential is mediated through the partitioning of Mg2+ and Ca2+ into the condensates, consistent with the ion distribution measurement by ICP-MS (Figure 1D).
ELP condensates also caused a change in the cell membrane potential as measured by the ThT assay (Figure S4C). Using the same chemical-clamp approach, we found that the supplementation of all types of ions other than the potassium ion repressed the hyperpolarized membrane potential. Though we did not find ELP condensates could strongly partition ions (Figure S1F), the change of membrane potential upon the formation of ELP condensates was still significant compared to cells without ELP condensates. We rationalized this finding as follows. As the ELP phase separates through a LCST mechanism 71, in which the phase transition of the ELP leads to the change of the water content in the dense phase, it thereby modulates the water abundance in the cytoplasm. This effect regulates the intracellular water potential as discovered recently72. It is possible that this change in the water content of the cytoplasm results in a change of the osmotic equilibrium between the intracellular and extracellular environments 72,73, which is known to influence the membrane potential 74,75. These observations show that condensates, due to their ability to affect the chemical environment of the cells in a global manner, can regulate the electrochemical equilibrium between the intracellular and extracellular environments.
Condensate specific modulation of membrane potential
We next explored whether the ability of condensates to modulate the membrane potential can be programmed at the protein sequence level. We reasoned that by changing the overall charge of the phase separating proteins, their condensates would exhibit different degrees of ion partitioning, thereby showing a different capacity to perturb the membrane potential. As a proof-of-principle experiment, we fused the same RLP sequence with super folder green fluorescence protein (sfGFP), a negatively charged fluorescent protein, which imparts a net 6 negative charges (Figure S5A). We found that the RLP-sfGFP fusion decreased the ANEPPS signal by 3.5-fold compared to the RLP alone, suggesting that the condensate-mediated electrochemical equilibrium is potentially programmable at the sequence level of a condensate forming protein.
To further evaluate the generality of this feature, we expressed the disordered regions of proteins known to mediate condensate formation, including FUS, DDX4 and hnRNP A14,76,77. With the same induction condition, we observed that IDPs of FUS and DDX4 were able to mediate condensate formation in E. coli¸ which in turn modulated the membrane potential to different extents, as evaluated by the ThT assay (Figure S5B). The addition of 1,6-hexanediol, which dissolved condensates in a fraction of cells, restored the membrane potential to a similar level as that of cells without condensates. For cells expressing IDP of hnRNP A1, which did not drive condensate formation in E. coli, cells with or without induction did not show noticeable difference in membrane potential (Figure S5C). These results showed that the overexpression of IDP per se did not contribute significantly to the change of membrane potential. Instead, the modulation of membrane potential was driven by condensate formation.
Condensate modulates membrane permeability and antibiotic tolerance
A change in the membrane potential could have a profound impact on small molecule signaling 64,78–80, by tuning the direction and magnitude of the flux of small molecules 59,60,62,66. We wondered whether this modulation effect could regulate cellular physiology through altering communication between the cell and its environment (Figure 4A). We hypothesized that this modulation can potentially affect the survival of cells exposed to functional small molecules 81–83, such as antibiotics, based on their electrostatic charge. To test this hypothesis, we measured the growth recovery of back-diluted log-phase cells with and without RLP condensates in M9 media containing different antibiotics.
Figure 4. Biomolecular condensates dictate membrane molecular uptake and cellular fitness.

A, Condensates mediate hyperpolarization of cellular membrane, thereby changing the uptake of antibiotics based on their types of electrostatic charge. This feature can regulate cellular survival under antibiotic stress.
B, Growth of cells with or without condensates in M9 minimum medium. Data are represented as mean ± SD.
C, Growth of cells with or without condensates in M9 minimum medium with negatively charged antibiotics, including 2 μg/mL ampicillin (left panel) and 1 μg/mL carbenicillin (right panel). Data are represented as mean ± SD.
D, Growth of cells with or without condensates in M9 minimum medium with positively charged antibiotics. 1 μg/mL gentamicin (left panel), 6 μg/mL chloramphenicol (middle panel) and 2 μg/mL streptomycin (right panel). Data are represented as mean ± SD.
E, Comparison of the extracted growth lag phase of cells with or without condensates under the treatment of different antibiotics. ****, P<0.0001; ns, non-significance; based on unpaired t-test. Data are represented as mean ± SD.
F, Comparison of the extracted maximum growth rate of cells with or without condensates under the treatment with different antibiotics. *, P = 0.0117; ****, P < 0.0001; ns, non-significance; based on unpaired t-test. Data are represented as mean ± SD.
We first tested the growth recovery in the absence of antibiotics. We found that cells with condensates showed a 2.4-fold longer lag time than cells without condensates (Figure 4B), suggesting a burden caused by condensate formation. The ribosome activity in E. coli is known to be magnesium ion dependent60,84, and the rate of global protein synthesis is a key factor underlying cellular growth85,86. To this end, we quantified protein synthesis using an analog of puromycin87, O-propargyl-puromycin, which forms covalent conjugates with nascent polypeptide chains and allows fluorescence quantification through click chemistry with a fluorescent azide. This measurement shows that, compared with cells without RLP condensates, cells with RLP condensates exhibited a reduced translation rate on a global scale (see Methods for details). Thus, the burden caused by condensate formation was likely due to a reduced ribosome activity.
We next evaluated cellular regrowth under different types of antibiotics. When exposed to two negatively charged antibiotics, ampicillin and carbenicillin, at sublethal concentrations, cells with condensates either showed a faster recovery from the lag phase or a higher maximum growth rate (Figure 4C, E & F). This increased tolerance to ampicillin and carbenicillin likely resulted from the reduced uptake of these negatively charged antibiotics due to the condensate-mediated hyperpolarized membrane potential.
In contrast, condensate formation amplified the impact of several positively charged antibiotics, gentamycin, chloramphenicol, and streptomycin. When applied at concentrations sublethal to cells not containing condensates (Figure 4D, E & F), these antibiotics more strongly inhibited the recovery of cells containing condensates. Streptomycin caused a 3-fold longer lag phase in cells containing condensates than the cells without condensates; Gentamycin and chloramphenicol completely suppressed growth of cells with condensates. The enhanced susceptibility likely resulted from increased uptake of these positively charged antibiotics due to the condensate-mediated hyperpolarized membrane potential.
Stress condensates regulated E. coli growth through condensate-mediated shifts of electrochemical equilibria
The observation that condensate-mediated membrane hyperpolarization can direct antibiotic uptakes by E. coli provides an intuitive explanation of a previous discovery that stress-dependent membraneless organelles in E. coli88, which are liquid-like condensates83, could enhance bacterial tolerance to antibiotics including ampicillin and carbenicillin 83. Stress-dependent condensate formation could lead to hyperpolarization of the membrane potential, thus suppressing the uptake of negatively charged antibiotics and enhancing cell survival. Conversely, stress condensate formation in E. coli would enhance the efficacy of positively charged antibiotics.
To test this hypothesis, we induced condensates formation through heat shock or prolonged culture in wild type E. coli MG165583,89,90. Using the C-SNARF-4 assay, we found that the formation of stress condensates led to an acidic shift in the cytoplasm pH with the condensates showing a more basic pH (Figure S6A&B), which aligns with a previous study showing that the intracellular pH decreased upon the formation of the stress condensates in E. coli88. Using the ANEPPS and ThT assays, we found that the stress condensate formation led to hyperpolarization of membrane potential, and the dissolution of heat stress-induced condensates through 1,6-hexanodiel treatment resulted in the restoration of membrane potential to a level similar to the cells without stress condensates (Figure S6C&D). Consistent with the previous study 83, we found that cells with condensates showed increased tolerance to a negatively charged antibiotic, ampicillin (Figure S6E) 83. In contrast, consistent with our prediction, cells with stress condensates were more susceptible to a positively charged antibiotic, gentamycin, when applied at sublethal concentrations, compared to the growth response of cells without condensates.
The electrochemical features of condensates affect cellular processes
The preceding evidence shows that the formation of biomolecular condensates can modulate the electrochemical equilibria in cells. We hypothesized that this modulation might affect cellular processes in a global manner, given that the chemical environment is a primary factor influencing biochemistry91. We tested this notion by examining whether condensate formation could drive a global change in gene expression in cells using RNA-sequencing (Figure 5A & Table S2).
Figure 5. Condensate dependent change of global transcriptome.
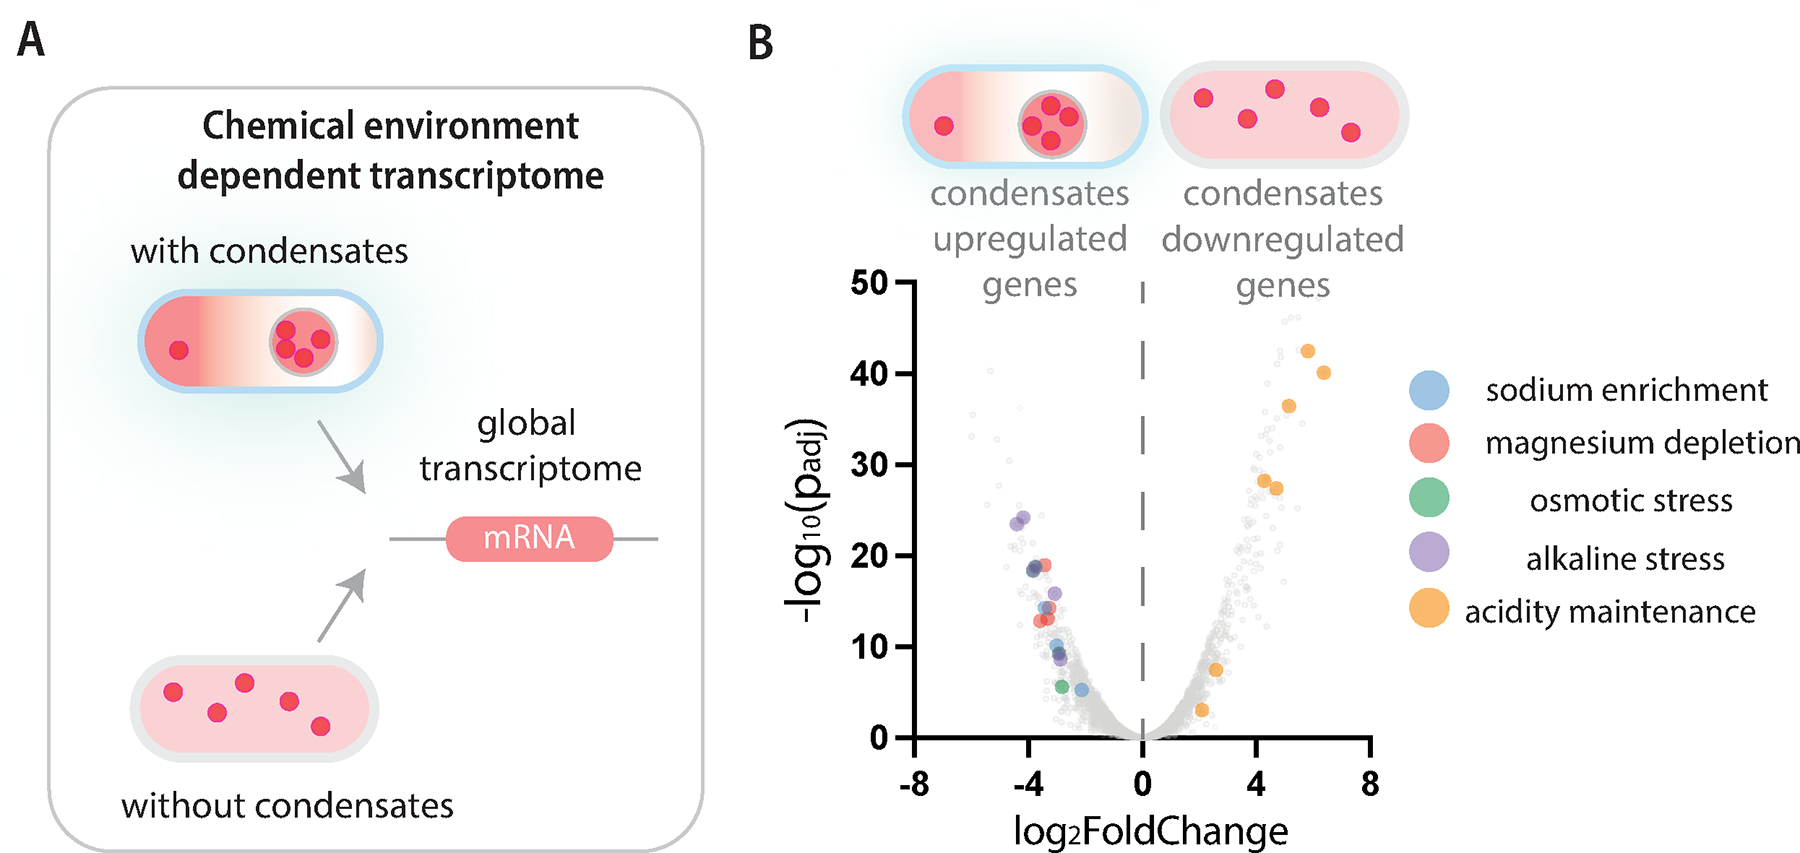
A, Cells with or without RLP condensates were subjected to RNA-sequencing analysis to evaluate differential gene expression profiles between samples.
B, Volcano plot (fold change of mRNA level between samples vs. adjusted p-value) shows the distribution of transcriptomes in cells with and without condensates. Statistically significant and featured transcripts are color coded based on the chemical features upregulating the downstream gene expression.
1557 genes were differentially expressed between cells with and cells without condensates with an adjusted P-value < 0.0499. (Figure 5B, see Table S2 for gene ID and count values). Of these, we assessed the expression profiles of genes that can be regulated by the changes of cellular chemical environment, including pathways regulated by ion-dependent transcription factors, osmotic stress and pH. Compared with cells without condensates, cells with condensates upregulated the expression of all genes in Mg++ transporter pathways (mgt, mgr, bor gene clusters ), which are known to be activated when Mg++ is limiting 92, as well as three of four genes under control of the Na+-dependent transcription factor NhaR 93,94. A set of genes involved in osmotic stress response (e.g., rrrD, psp, ybd, bet, aqp gene clusters and stress response sigma factor rpoE) 95–98 were also upregulated in cells with condensates. These altered gene expression profiles align with the selective enrichment of Na+ and depletion of Mg++ in the cytoplasm upon condensate formation (Figure 1). In addition, several genes involved in pH homeostasis, such as alkaline stress genes and acidity maintenance genes (e.g., slp, asr, glsA, ybaT, Adi clusters) 99 were also differentially expressed between cells with condensates and cells without condensates.
These data highlight two critical points. First, our targeted analysis of gene expression profiles aligns with the observed environmental effects of condensate formation, such as the intracellular ion distribution. Second, these data suggest that the function of condensates goes well beyond the specific set of biomolecules that participate in condensate formation, as shown by the finding that condensates can mediate global changes in gene expression profiles within the cell.
Discussion
The generation of ion gradients by associative polymers that undergo phase separation has been studied using liquid-state theory-based simulations of the complex coacervation of asymmetric polyelectrolyte mixtures 8,19. The asymmetry in charge contents caused by the asymmetric partitioning of macromolecules between the dilute and the dense phases needs to be neutralized by ions to realize the electrochemical potential equilibrium 33. However, the extent to which electrochemical equilibria in living cells can be modulated by condensates, and how that affects cellular physiology, is unclear. Our study provides direct evidence of how the phase separation of associative biomacromolecules can establish an ion gradient within cells. We demonstrate that the ion gradient drastically affects the electrochemical equilibria of a cell by modulating: 1) intracellular ion homeostasis, as seen by the pH/ion concentration difference between the cytoplasm and condensates; and 2) the membrane potential, by inducing hyperpolarization of the cell membrane.
Are these features of condensates likely to generally hold true across diverse condensates? We speculate that this is likely based on the conserved molecular interactions that drive phase separation of diverse condensate-forming IDPs and high net charge nature of typical components that participate in condensate formation, such as nucleic acids and highly charged IDPs 100–103. From the perspective of biomacromolecules that undergo phase transitions, such as IDPs and nucleic acids 100,104, a key difference before and after phase transition is the switch of the interactions from biomolecule-solvent to biomolecule-biomolecule. Before they undergo a phase transition, biomacromolecules are solvated by water molecules with exposed charged residues that are screened by counterions. After phase transition, the biomacromolecules percolate with each other, thereby releasing counterions and water molecules. Due to the limited flexibility of the backbone of IDPs and nucleic acids 9,105, a complete screening of charged residues through intra- and inter-molecular interactions is unlikely. Therefore, the requirement of charge neutrality within a phase requires that additional ions would enter the condensate from the cytoplasm to screen the excess charge. This generates an asymmetry in the ion distribution between phases. Furthermore, this asymmetry in ion distribution can also be triggered by interactions that do not involve charge-based electrostatic interactions. For example, the distinct solvent environment in the dense phase as a result of a change in the abundance of water content or micropolarity 106,107 can direct the partial solvation of ions, which in turn can create a distinct ion environment in the dense phase, thereby promoting the formation of an ion gradient. Hence, all these confounding factors suggest that biomolecular condensates are an asymmetric mixture of components, which suggests a possibly generalizable feature of condensates in mediating cellular electrochemical equilibria and establishing an electrochemical gradient within a cell. This aspect further emphasizes that understanding the environmental sensing feature of IDPs 108–111 and the physicochemical consequences of condensate formation 7,14,72,112 would shed light on the mechanism of intracellular physicochemical homeostasis.
Intracellular ion homeostasis is critical to cellular physiology 78,92,113, as the precise control of ion concentrations and their spatial distribution is the foundation of biochemical activities within a cell 114, including transcription 115, translation 116, antibiotic resistance 60. Our results show that condensate formation can regulate spatial distribution of specific ions within a cell, which provides a mechanism to regulate cellular electrochemical equilibria that is orthogonal and complementary to ion channels. This effect should go beyond ions to charged small molecules that are involved in the establishment of the electric potential gradient between phases. Since the chemical environment of cells is regulated by both ions and small molecules serving as osmolytes (e.g., glutamate)117, studying how these molecules collectively define or are regulated by the electrochemical potential shift induced by condensation can provide new insights into regulation of intracellular physicochemical homeostasis112,118–122.
The diffusion length scale of ions is much longer than macromolecules 15. As such, the chemical effect exerted by condensates can dictate long-range cellular control, as evidenced by the change in the interactions of cells with their environment. Specifically, the intracellular ion gradient established by condensates is rebalanced with the extracellular environment, which leads to a change of the membrane potential 59,60,123. In turn, these changes affect intracellular gene expression on a global scale and the response of cells to environmental perturbations (Fig. 4). This effect is similar to osmosis-dependent gene expression121,124. Considering the prevalence of voltage-gated ions channels (e.g., voltage-gated calcium channels) 123,125, further studying the dynamic response of the ion channel under a new electrochemical equilibria in different timescales can generate a new understanding of the downstream impacts of condensate-mediated shift of cellular electrochemical equilibria. These results demonstrate that condensates can encode diverse cellular functions beyond the specific functions that are encoded in the biomolecules that form the condensates 119.
Another implication of our study is the role of the condensate formation in regulating the noise caused by stochastic gene expression. Gene expression—including that of IDPs that form the condensate—is stochastic at the single cell level. Though phase separation can reduce the concentration fluctuation of the phase separating component in the cytoplasm 21, the cell-cell variability in the total concentration of the IDP is manifested by a similar cell-cell variability in the volume fraction of the condensate. The cell-cell variability in the volume of the condensate then translates to similar cell-cell variability in the effect of the cytoplasmic ion environment in the cell and the extent of hyperpolarization of the cell membrane.
In summary, our finding uncovers a previously unknown biochemical function of condensates in modulating electrochemical equilibria in cells, and which in turn affects global cellular physiology. This function has a distinct effect in generating cellular noise, which further suggests that the cooperativity and signaling between different condensates and cellular components may be a critical—and as yet unstudied—phenomenon by which the interplay of different biomolecular condensates in cells controls cellular homeostasis. This work reveals a new level of the functional complexity of biomolecular condensates, and expands our understanding of their cellular functions beyond those encoded in the biomolecules that participate in condensate formation.
Limitations of the Study
Our strategy for studying the electrochemical functioning mechanism of condensates depends on the formation of condensates with a single component intrinsically disordered protein. Though we verified the generality of this finding with the native stress condensates in E. coli, further studies on exploring defined multi-component condensation systems will be useful to extract the underlying molecular driving forces for the phenomenon. The nature of this phenomenon depends on the asymmetric partitioning and exclusion of ions. Our study only explores this phenomenon from the aspects of cellular environments and functional consequences. Further studies on defining these basic solvent properties in a condensate-specific manner will expand our understanding on the fundamental electrochemical features of condensates.
STAR METHODS
RESOURCE AVAILABILITY
Lead contact
Further information and requests for resources and reagents should be directed to and will be fulfilled by the lead contact, Lingchong You (you@duke.edu)
Materials availability
Plasmids generated in this study are available upon request to Yifan Dai (dyifan@wustl.edu) without restrictions.
Data and code availability
Raw data generated from this study have been deposited at the Dai Lab Github repository: https://github.com/Dailabwustl/Condensate-electrochemical-potential-of-cell, and are publicly available via zenodo DOI:10.5281/zenodo.12769620.
All original code has been deposited at the You Lab Github repository: https://github.com/youlab/Condensate-induced-Noise, and are publicaly available via zenodo DOI:10.5281/zenodo.12745177
Any additional information required to reanalyze the data reported in this paper is available from the lead contact upon request.
EXPERIMENTAL MODEL AND STUDY PARTICIPANT DETAILS
Three strains of Escherichia Coli were used in this study. DH5α cells (New England Biolabs (NEB), C2987H) were used for experiments involving plasmid cloning. BL21 (DE3) cells (New England Biolabs, C2527H) were used for expression of IDPs for the formation of condensates. MG1655 cells (The Coli Genetic Stock Center at Yale University, CGSC#6300) were used for evaluation of the effects of native stress-induced condensates. DH5α cells were grown in 2 × YT (2x Yeast Extract Tryptone) medium (Millipore Sigma, Y2377) at 37°C in an orbital shaker incubator at 220 RPM. For cloning purpose, DH5α cell culture was supplemented with kanamycin (45 μg/mL) (Goldbio, K-120–5) for pET backbones or chloramphenicol (15 μg /mL) (Sigma-Aldrich, C0378) for pBad backbones. BL21(DE3) cells were grown either in 2 × YT or M9 minimum medium (Millipore Sigma, M6030) with different antibiotics (based on the plasmids carried by the cells) as described in the main text at 37°C in an orbital shaker incubator at 220 RPM. MG1655 cells were grown in 2 × YT medium without antibiotics at 37°C in an orbital shaker incubator at 220 RPM before conducting the stress-based experiments.
METHOD DETAILS
Cloning of plasmid constructs
Detailed information about plasmids used in this study can be found in the key resources table provided as an addendum to this manuscript. For cloning of IDPs onto the expression backbone pET24+, IDP sequences were codon optimized through Codon Optimization Tool (Integrated DNA Technologies (IDT)) and ordered as a gBlock fragment (IDT) for Gibson assembly. Gibson assembly was conducted using NEBuilder HiFi DNA Assembly Master Mix (NEB) through incubating the gene fragment with the plasmid backbone at 50°C for 15 min24. The assembled plasmids were transformed into DH5α cells (NEB) based on manufacturer protocol and placed onto the 2 × YT agar plate (containing 45 μg/mL kanamycin). The plate was incubated overnight at 37°C. Single colonies were picked and inoculated in 2 × YT medium containing 45 μg/mL kanamycin. The cultures were grown overnight, and the amplified plasmid was prepared using QIAprep Spin Miniprep Kit (QIAGEN). The cloned constructs were sent for verification by Sanger Sequencing and Full plasmid sequencing with Genewiz (Azenta Life Sciences).
Key resources table.
| REAGENT or RESOURCE | SOURCE | IDENTIFIER |
|---|---|---|
| Antibodies | ||
| Bacterial and virus strains | ||
| BL21 (DE3) E. Coli cells | New England Biolabs | Cat#C2527H |
| MG1655 E. Coli cells | Coli Stock Genome Center (CGSC) | Cat#CGSC6300 |
| DH5a strain E. coli cells | New England Biolabs | Cat#C2987H |
| Biological samples | ||
| Chemicals, peptides, and recombinant proteins | ||
| RLPWT: resilin like polypeptide (20 repeats of the RLPWT monomer) | This paper- Source plasmid- pYD1 | N/A |
| ELPV40: elastin-like polypeptide (40 repeats of the ELPV monomer) | This paper- Source plasmid- pYD2 | N/A |
| SNARF™-4F 5-(and-6)-Carboxylic Acid, Acetoxymethyl Ester, Acetate - Special Packaging | Invitrogen | Cat#S23921 |
| Thioflavin T | Thermo Scientific | Cat#211761000 |
| 1,6-Hexanediol | Sigma-Aldrich | Cat#240117 |
| Di-4-ANEPPS | Invitrogen | Cat#D1199 |
| DiSBAC2(3) (Bis-(1,3-Diethylthiobarbituric Acid)Trimethine Oxonol) | Invitrogen | Cat#B413 |
| Critical commercial assays | ||
| Protein Synthesis Assay Kit (Red) | Abcam | Cat#ab235634 |
| Deposited data | ||
| Raw and analyzed data | This paper | DOI:10.5281/zenodo.12769620 |
| Simulation data | This paper | DOI:10.5281/zenodo.12745177 |
| Experimental models: Cell lines | ||
| Experimental models: Organisms/strains | ||
| BL21 (DE3) E. Coli cells | New England Biolabs | Cat#C2527H |
| MG1655 E. Coli cells | Coli Stock Genome Center (CGSC) | Cat#CGSC6300 |
| DH5a strain E. coli cells | New England Biolabs | Cat#C2987H |
| Oligonucleotides | ||
| Recombinant DNA | ||
| pET24_RLPWT | Dzuricky et al.23 | YD1 |
| pET24_ELPV40 | Simon et al.29 | YD2 |
| pET24_FUS LC | This paper | YD3 |
| pET24_DDX4 IDP | This paper | YD4 |
| pET24_hnRNP A1 LCD | This paper | YD5 |
| pBad_pHluorin (ratiometric pHluorin2) | Modified based on Linders et al.28 | Addgene180227 |
| pET24_RLPWT-sfGFP | Dzuricky et al.23 | YD6 |
| pET24_RLPWT-mEGFP | Dai et al.24 | YD7 |
| Software and algorithms | ||
| Fiji | NIH | https://imagej.net/software/fiji/downloads |
| LAS X Life Science | Leica | https://www.leica-microsystems.com/products/microscope-software/p/leica-las-x-ls/downloads/ |
| Python (Anaconda 3.5.2) | Anaconda | https://anaconda.org/conda-forge/python/files?version=3.5.2 |
| BD FACSDiva Software | BD Bioscience | https://www.bdbiosciences.com/en-us/products/software/instrument-software/bd-facsdiva-software |
| FlowJo | BD Bioscience | https://www.flowjo.com/ |
| Prism | GraphPad | https://www.graphpad.com/ |
| Other | ||
Protein expression and purification
Expression.
BL21 (DE3) competent E. Coli was transformed with RLP genes (RLPWT) or ELP genes (ELPVPGVG-40) and the transformed cells were selected by plating with Kanamycin on a 2 × YT agar plate. A single colony was picked and grown in 2× YT medium containing 45μg/mL Kanamycin overnight at 37°C shaking at 220 RPM. 10 mL of overnight cell culture was back diluted into 1 L 2× YT liquid medium supplied with 45 μg/mL Kanamycin. For RLP expression, the 1 L culture was first grown at 37°C and shaking at 220 RPM. When the OD600 of cell culture reached 0.5, the 0.5 mM IPTG was added into the culture to induce the production of the protein. The cell culture was continuously incubated at 37°C and shaking at 220 RPM for additional 18 h before purification. For ELP, the 1 L culture was first grown at 37°C and shaking at 220 RPM. When the OD600 of cell culture reached 0.5, the 0.5 mM IPTG was added into the culture to induce the production of the protein. The 1 L culture was then incubated at 25 °C and shaking at 220 RPM for additional 24 h before purification.
Purification of RLP protein.
The purification of RLP protein utilizes the principle of upper critical solution temperature transition behaviors of RLP23. Each liter of the overnight cell culture was pelleted by centrifugation at 3,000 g for 20 min at 4 °C. Cell pellet was resuspended in 30 mL Resuspension buffer (50 mM Tris, pH 7.5) and lysed by sonication (3 min total time, each cycle with 10 sec on and 40 sec off, 75 % amplitude) in an ice bucket using Ultrasonic Homogenizer (Benchmark Scientific). The cell lysate was clarified by centrifugation at 20,000 g for 25 min at 4 °C using a floor-type high-speed centrifuge (Eppendorf), resulting in a soluble and an insoluble fraction. The insoluble pellet from each liter of bacterial culture was dissolved in 10 mL Urea buffer (50 mM Tris, 500 mM NaCl, 4 M Urea, pH 7.5) supplied with 250 units (1 μL) Benzonase Nuclease (Millipore) at room temperature for at least 1 h with rocking.
The sample was then pre-warmed to 40 °C for 30 min and centrifuged at 20,000 g for 25 min at 40 °C. The supernatant was collected and dialyzed into Resuspension buffer (50 mM Tris, pH 7.5). The dialysis buffer was changed two times over 3 h. Everything in the dialysis bag was then collected and centrifuged at 20,000 g for 25 min at 4 °C. The insoluble pellet was redissolved into Urea buffer (50 mM Tris, 500 mM NaCl, 4 M Urea, pH 7.5) at room temperature for at least 1 h with rocking. The sample was then warmed to 40 °C and centrifuged at 20,000 g for 25 min at 40 °C. The supernatant was collected, and its purity was determined on an SDS-PAGE gel (Bio-Rad, Any kD Mini-PROTEAN TGX Precast Protein Gels). Extra rounds of purification can be performed to achieve higher purity. The supernatant was then subjected to size-exclusion chromatography with HiLoad Superdex 75 pg columns (Cytiva) using AKTA Pure Protein Purification system (Cytiva). Peak fractions containing the RLP protein were pooled and the purity was examined with SDS-PAGE gel with a purity typically over 95%. The protein concentration was then adjusted through Amicon Ultra Centrifgual Filters (EMD Millipore) and then flashed frozen in liquid nitrogen and stored in − 80°C before using for experiments.
Purification of ELP protein.
The purification of ELP protein utilizes the principle of lower critical solution temperature transition behaviors of ELP130. Each liter of the ELP overnight cell culture was pelleted by centrifugation at 2,000 g for 20 min at 4 °C. Each pellet from 1 L cell culture was resuspended in 35 mL 1×PBS and lysed by sonication (3 min total time, each cycle with 10 sec on and 40 sec off, 75 % amplitude) in an ice bucket using Ultrasonic Homogenizer (Benchmark Scientific). The cell lysate was clarified by centrifugation at 20,000 g for 25 min at 4 °C using a floor-type high-speed centrifuge (Eppendorf), resulting in a soluble and an insoluble fraction. The supernatant, which contains the non-phase separated ELP protein, was collected in a new tube. The ELP phase transition was induced by adjusting the NaCl concentration to be 1 M and heating in a 40 °C water bath for 20 min. The ELP solution should become turbid and the ELP was pelleted by centrifugation at 20,000 g for 25 min at 40 °C. The insoluble ELP pellet was physically disrupted and dissolved in fresh 1×PBS at 4 °C for at least 3 h with rocking. The dissolved ELP was centrifuged at 20,000 g for 25 min at 4 °C and the supernatant was collected. This supernatant was maintained at 4 °C before using. This completed a full round of ELP purification. Protein purity was determined by an SDS-PAGE gel (Bio-Rad, Any kD Mini-PROTEAN TGX Precast Protein Gels). In total, at least two rounds of purification were performed to achieve desired purity. The supernatant was then subjected to size-exclusion chromatography with HiLoad Superdex 75 pg columns (Cytiva) using AKTA Pure Protein Purification system (Cytiva). Peak fractions containing the ELP protein were pooled and the purity was examined with SDS-PAGE gel with a purity typically over 95%. The purified ELP was dialyzed into milli-Q water overnight at 4 °C. The dialysis water was changed three to five times. The dialyzed sample was then frozen at −80 °C for 1 h and lyophilized for three days to remove all water. The lyophilized dry powder was stored at −80 °C before usage. The dry powder was weighted and dissolved into 1 x PBS at a desired concentration at 4 °C before using for experiments.
Preparation of cells with or without condensates
E. Coli BL21 (DE3) (NEB) was transformed with plasmids containing genes encoding RLPWT or ELPVPGVG-40 or FUS LC or hnRNP A1 LCD or DDX4 IDP. The transformed cells were plated on a kanamycin selection plate and grown overnight. Three separate colonies were picked and cultured in 5 mL of 2x YT medium with 45 mg mL−1 kanamycin and 1% glucose to repress basal protein expression and cultured at 37 °C (shaking at 225 rpm). After 16–18 h, the cells were diluted at a ratio of 1:100 into 2 × YT medium with 45 μg/mL kanamycin and cultured for an additional 1.5 h at 37 °C. The OD600 of cells were then adjusted to 0.2 and the cells were separated into two groups as cells with condensates and without condensates. To make cells containing condensates, the culture was induced with 0.5 mM or 0.1 mM IPTG. For cells without condensates, no inducer was added, allowing background expression under the T7 promoter23,24, which mediates the basal expression of IDP without forming condensates. This time point was set as 0. At different time points, the cells were pelleted and washed with HBSS buffer (ThermoFisher) and the OD600 was adjusted to 0.1 and pelleted again for further sample processing before imaging. For dissolving cells with condensates, after cells were pelleted and resuspended into HBSS buffer, 10% 1,6-hexanediol was added into the solution for 15 min before subjecting to different assays.
To prepare samples for RNA-seq, for both induced and non-induced cells, we cultured the cells for 2 h at 37 °C after separating the sample groups. We verified the cellular phenotypes with or without condensates through phase contrast confocal microscopy. 1.5 mL of cell culture was pelleted for each sample to collect sufficient cells for RNA-seq processing. The cell pellets were flash frozen by liquid nitrogen and shipped out to RNA-seq at Azenta Life Sciences, in which services, including RNA extraction, rRNA depletion, 20M reads per sample, ERCC spike-in, standard RNA-Seq analysis, were performed.
To form stress-induced condensates, MG1655 was cultured in 3 mL of 2x YT medium overnight. Overnight cultures were diluted at a ratio of 1:100 into 2 × YT medium. For the cells without condensates, the cells were cultured for 3 h for characterization. For the formation of heat stress induced condensates, cells were cultured for additional 3 h and subjected to heat shock at 50°C for 30 min on a benchtop dry bath incubator. For the formation of prolonged culture induced condensates, overnight culture was incubated for additional 5 h at 37°C without shaking. After different processing methods, cells were pelleted and resuspended into HBSS buffer for further characterizations.
Confocal imaging for measuring pH
Two orthogonal methods have been used for pH measurements using chemical dye and genetically encoded fluorescent protein. SNARF™−4F 5-(and-6)-Carboxylic Acid, Acetoxymethyl Ester, Acetate (C-SNARF4-AM, ThermoFisher) was used as the dye for pH measurement based on established protocols7,131. C-SNARF-4-AM was first dissolved in DMSO with a final concentration of 2 mM as the stock solution. The stock solution was then dissolved into HBSS buffer at desired conditions with a final concentration of 10 μM as dyeing solution. The pelleted cells were resuspended in the dyeing solution and incubated at 37 °C for 30 min and resuspended into HBSS buffer at desired conditions before imaging. For better quality of images without visible background, the cells were pelleted after incubation and resuspended into HBSS buffer without dye for imaging. To save time for quantification of intracellular pH of single cells induced at different periods, the cells were not further washed to ensure the accuracy of incubation time between experiments. The solution containing cells was put on an uncoated 35 mm Dish with No. 1.5 Coverslip with 14 mm glass (MATTEK) for imaging analysis. LEICA TCS SP8 (Leica) was used for imaging. White light laser (WLL) was used with an excitation wavelength set at 488 nm with 70 % power and 2 % laser line intensity. Hybrid detectors (HYD) were set at two different ranges for ratiometric imaging with one detector at 540–600 nm and the other at 610–660 nm. The 40x/1.25–0.75-NA oil immersion objective was used to calibrate the location and 100x/1.40 oil immersion object was used to acquire the images for single cell analysis. The acquired images were first processed in LAS X Life Science Microscope software (Leica) and quantified by ImageJ (NIH) based on the ratio between the intensity of these two channels.
Intracellular pH was also examined with a genetically encoded ratiometric pH sensor, pHluorin27. Cells was transformed with one plasmid (pBad-pHluorin) encoding the pHluorin and another plasmid encoding the RLP. Prior to induce the formation of condensates as described in the previous section, 1 h after back dilution, cells were first induced with 0.02% arabinose to mediate the expression of the pHluorin protein. Then, after 30 min, cells were induced or not induced with 0.5 mM IPTG for the formation of RLP condensates. After 1.5 h of incubation, cells were pelleted and resuspened into HBSS buffer. The resuspended cells were put on an uncoated 35 mm Dish with No. 1.5 Coverslip with 7 mm glass (MATTEK) for confocal imaging. LEICA STELLARIS 8 (Leica) was used for imaging. 100x/1.40 oil immersion object was used to acquire the images for single cell analysis. Sequential imaging with two channels was set with the different excitation wavelength and the same detector range. For the first channel, solid state 405 nm laser was used with a 10% laser line intensity and HYD detector was set at 505–560 nm. For the second channel, White light laser (WLL) was set at 475 nm with a 10% laser line intensity and the same HYD detector was set at 505–560 nm. The detector was set at the same gain for ratiometric measurements. The acquired images were first processed in LAS X Life Science Microscope software (Leica) and quantified by ImageJ (NIH) using Image Calculator based on the ratio between the emission intensity of these two channels.
Confocal imaging for measuring membrane potential
Di-4-ANEPPS (ThermoFisher) dye was used to measure membrane potential. Di-4-ANEPPS was first dissolved in DMSO with a final concentration of 1 mM as the stock solution. An imaging solution based on HBSS buffer containing 1 μM of Di-4-ANEPPS was used to resuspend the cells. The cells were then incubated at room temperature for 30 min before washing the cells with HBSS and then transferred onto an uncoated 35 mm Dish with No. 1.5 Coverslip with 14 mm glass (MATTEK) for imaging. LEICA TCS SP8 (Leica) was used for imaging. White light laser (WLL) was used with an excitation wavelength set at 498 nm with 70 % power and 10 % laser line intensity. Hybrid detector (HYD) was set at 550 nm to 680 nm. 100x/1.40 oil immersion object was used to acquire the images for single cell analysis. ImageJ was used to quantify the intensity signal at the cellular membrane.
Flow cytometry for membrane potential analysis
ThT (Thioflavin T) (Millipore Sigma) or DiSBAC2(3) (Bis-(1,3-Diethylthiobarbituric Acid)Trimethine Oxonol) (ThermoFisher, B413) was used as an indicator to measure the uptake of small molecule upon membrane hyperpolarization as a strategy to compare the change of membrane potential59,132. Cells with or without condensates treated with or without different chemical clamps were incubated with 10 μM ThT or 5 μM DiSBAC2(3) at 37°C for 30 min. Cells were filtered through a 35 micron nylon filter immediately before recording the samples.
BD FACSCanto-II Cytometer or BD LSRFortessa™ X-20 Benchtop Flow Cytometer with a 405 nm laser or a 488 nm laser was used to evaluate the ThT or the DiSBAC2(3) signal of the samples. Cells without incubating with the Nernst potential dyes were used as negative controls. BD FACSDiva software was used for both data acquisition and analysis. 10,000 events were recorded for sample analysis. All events were plotted on an FSC-A vs SSC-A bivariate pseudocolor dot plot to exclude debris and to gate on healthy cells (P1 gate). Doublet discrimination was performed hierarchically on P1 population by first plotting SSC-W vs SSC-H followed by FSC-W vs FSC-H. Single cells were then analyzed for fluorescence level by plotting fluorescence area signal (log scale) against SSC-A (linear scale). Negative control was utilized to set the threshold for gating the fluorescence population. Histogram of fluorescence intensity versus normalized counts of the cells was plotted to compare the distribution of fluorescence signal at the population level.
ICP-MS analysis of the cytoplasm solution
2 L of cells were cultured in order to obtain enough materials and volume for experiments. The following method demonstrated the culture process of 1 L cell culture. 12 mL of cells containing the plasmid of interest was cultured overnight in 2 × YT containing 45 μg/mL kanamycin and 1 % glucose. Cell culture was then diluted into 1 L of 2 × YT containing 45 μg/mL kanamycin and cultured for 3 h at 37 °C and shaking at 150 rpm. For cells containing the RLP construct, cell culture was then induced with 0.5 mM IPTG and cultured for another 6 h at 37 °C. For cells containing the ELP construct, cell culture was then induced with 0.5 mM IPTG and cultured for another 9 h at 30 °C. Cell pellets were collected by centrifuging cultures at 3,500g for 10 min at 4 °C and 2 L of cells were resuspended in 5 mL of cell lysis buffer (50 mM Tris pH 7.5), which typically resulted a total volume around 7.2 mL. Resuspended cells were lysed by 2 min of sonication (10 s of sonication followed by 40 s of rest) at an intensity of 75% in an ice bucket. This solution is the disrupted cell lysate for further processing.
For cells transformed with RLP construct, which undergoes phase transition through UCST phase behavior23, the disrupted cell lysate was centrifuged at 22 °C at 20,000 g for 20 min to achieve separation of phases. For the sample at condition with condensates, the supernatant of the centrifuged solution was directly subjected to further processing. For the sample at condition without condensates, the solution with debris and condensates was put into water bath for 1 h at 37 °C to dissolve the condensates. The dissolution of the dense phase could be observed by eyes as shown by us previously23. The supernatant was then extracted for further processing. The extracted supernatant for both samples was subjected to treatments with 1.6 U mL−1 proteinase K (NEB) and 500 U mL−1 Benzonase nuclease for 30 min at 37 °C before ICP-MS analysis.
For cells transformed with ELP construct, which undergoes phase transition through LCST phase behavior130,133, the disrupted cell lysate was centrifuged at 40 °C at 25,000 g for 20 min to achieve separation of phases. For the sample at condition with condensates, the supernatant of the centrifuged solution was immediately removed after centrifuge and subjected to further processing. For the sample at condition without condensates, the solution with debris and condensates was put into 4 °C to dissolve the condensates for additional 6 h. Comparing with RLP condensates, for ELP condensates, it was difficult to observe the dissolution process by eyes because the ELP dense phase can be mixed with other cellular debris. To establish the analysis procedure, we evaluated the dissolution process by preparing multiple ELP samples and incubating the same condition prepared ELP samples at room temperature and at 4 °C. We then removed the supernatant and compared the weight of the pellet of different samples to confirm the transition process happened. The supernatant was then extracted for further processing. The extracted supernatant for both samples was subjected to treatments with 1.6 U mL−1 proteinase K (NEB) and 500 U mL−1 Benzonase nuclease for 30 min at 37 °C before ICP-MS analysis.
An aliquot of the supernatant solution was diluted into a 2% nitric acid (v/v) and 0.5% hydrochloric acid (v/v) solution prepared with 18.2 MΩ water and trace metal grade acids. The matrix was spiked with 72Ge and 89Y internal standards. The samples were measured for sodium, potassium, magnesium and calcium in a collision cell mode under He gas on an Agilent 7900 ICP-MS. The instrument was calibrated with a multi-element matrix (Spex Certiprep 2A) and a second source standard was used to verify the calibration curve (CRM-TMDW-A, High Purity Standards). The data was processed based on the dilution ratio used during the process of sample processing.
ICP-MS analysis of the in vitro condensate solution
For preparing RLP condensate solution, the purified RLP protein in stock buffer was concentrated to 150 μM with a volume of the total sample of 5 mL. For preparing ELP condensate solution, the purified ELP protein in stock buffer was concentrated to 500 μM with a volume of the total sample of 5 mL. Both samples were then dialyzed into 50 mM Tris, 150 mM NaCl, 3 mM MgCl2, 0.1 mM CaCl2, 30 mM KCl at pH 7.5 for 5 h at room temperature. The dialysis buffer was changed every 1 h of dialysis. At around 1.5 h, a clear change of turbidity of the solution was observed. After dialysis, the whole solution was moved from the dialysis tube into a 30 mL high-speed centrifuge tube (Thermo Scientific). The condensate solution was centrifuged at 25,000 g to separate the dilute and the dense phases. The use of the specific type of tube and the high volume of the protein solution is necessary to achieve spatially separated dilute and dense phases, which would allow separate analysis of the ion contents in the dilute and the dense phases. The supernatant of the centrifuged solution was immediately removed after centrifuge. The dense phase of the centrifuged solution was moved using a positive-displacement pipette134. Both the dilute and the dense phases were processed with a 1% nitric acid (v/v) solution prepared with 18.2 MΩ water and trace metal grade acids. The volume of the dilution was used as the conversion factor to calculate the dilute and the dense phase ion concentrations. The samples were then subjected to ICP-MS measurements in a collision cell mode under He gas on an NexION 2000 ICP-MS (PerkinElmer). An individual source standard containing sodium, potassium, calcium and magnesium was used to establish the calibration curve and verify the measurements stability between trails. The data was processed based on the dilution ratio used during the process of sample processing.
Protein synthesis assay
Overnight culture of BL21 (DE3) carrying the pET24-RLP plasmid or the pET24 backbone was prepared as described in the previous section for experiments. Experimental cultures were prepared by diluting the overnight cultures 100x into 3 mL M9 medium containing 45 mg/L kanamycin. M9 medium was prepared by mixing M9 salts with 0.1 mM MgSO4, 0.4% w/v glucose, 0.2% Casamino acids. Cells were induced with IPTG at a final concentration of 0.5 mM when OD600 at 0.2. After 2 h of induction, cells were harvested and prepared for Protein Synthesis Assay Kit (Red) (Abcam, ab235634). All the reagents from the Protein Synthesis Assay kit was prepared freshly and aliquoted for storage. Initially, 200 μL culture media of the cells were replaced by 200 μL 1X protein label media with 100x diluted Cycloheximide. Cells were then incubated at 37°C for 2 h and washed by PBS to terminate the reaction. Next, 100 μL Fixative Solution I was used to resuspend the cells followed by 15 min incubation at room temperature. After washing by 200 μL Wash Buffer, 100 μL Permeabilization Buffer was used to resuspend the cells followed by 10 min incubation at room temperature. Finally, cells were stained by 200 μL 1X Reaction cocktail. After 30 minutes incubation, samples were transferred to a black 384-well plate with clear bottom and the fluorescence was measured with the SPARK Multimode Microplate Reade (Tecan). The fluorescence quantification results (mean±sd, n) are shown below: cells with an empty plasmid backbone (11166±904.675, n=3), cells without condensates (16578±1555.137, n=3) and cells with condensates (8433±1261.036, n=3). The fluorescence of cells with condensates is statistically significantly (p<0.05, paired t-test) less than the fluorescence generated from cells without condensates and cells with an empty plasmid backbone.
Mathematical model for simulating noise
Simulation of stochastic gene expression 53 is modeled using Gillespie algorithm135. Constitutive transcription and translation processes are considered as following:
Here mRNA is synthesized with the rate of , and degrades with time scale of . Protein is synthesized with the rate of , and degrades with the timescale of and denotes the number of mRNAs and proteins.
Since gene expression operates on the timescale of hours, and protein diffusion on the timescale from milliseconds to seconds136, the gene expression system is coupled with phase separation by assuming equilibrium phase diagram generated from Flory-Huggins theory55. The dilute and dense phase volume fractions, and the condensate volume are determined by thermodynamic equilibrium and mass conservation at every time step of the stochastic simulations. The free energy of a two-polymer-one-solvent mixture is defined as:
The first polymer has volume fraction of , with length of persistence lengths, the second polymer has volume fraction of , with length of persistence lengths. , and represents the interaction strengths between two monomers. In the case of two component mixture (one polymer and one solvent), . In the case of three component mixture (two polymers and one solvent), we assume polymer 1 as the driver for phase separation, and to avoid multi-phsae scenario, we assume polymer 2 cannot form condensation by itself and set . The detailed parameters are listed below.
The parameters for stochastic simulations of noisy gene expression and phase separation.
| Standard deviation of the Gamma distribution of RNA transcription rate | 0.1 | Interaction energy between two monomers of polymer 1 | 2.3 | ||
| Translation rate of protein from mRNA | 0.005 s−1 | Interaction energy between one monomer of polymer 1 and one monomer of polymer 2 | 0.8 | ||
| mRNA degradation time scale | 100 s | Interaction energy between two monomers of polymer 2 | 0 | ||
| Protein degradation time scale | 3.6 × 10³ s | ν/Vtot | Volume of a monomer in the unit of the entire cell size | 2 × 10⁻⁵ | |
| Lengths of Polymer (protein) 1 | 5 | Volume fraction of polymer 2 | 0 for single-polymer condensate 0.1 for two-polymer condensate |
||
| Lengths of Polymer (protein) 2 | 4 |
Based on the free energy, we can obtain the phase diagram of condensate formation (see phase diagram below). We assume the phase separation process as quasi-equilibrium; thus the dilute and dense phases are determined by chemical equilibrium of both solutes and solvent, and mass conservation at every time step of the stochastic simulations55. The thermodynamic equilibrium of the system containing different phases (denoted by ) follows:
Extrinsic (cell-to-cell variability) and intrinsic noises (stochastic processes of mRNA and protein synthesis and degradation) are included to evaluate the noise reduction of the condensate-forming protein. To account for extrinsic noise, the constitutive mRNA transcription rate is assumed to follow Gamma distribution21 with specified mean and standard deviation of transcription. The noise of a molecule (or condensate volume) is defined as the coefficient of variance (CV) of its final state across independent stochastic simulations . Here CV is calculated across 100 simulations, three replicates of 100 simulations are performed.

Phase diagram of condensate formation.
The dark curve corresponds to the binodal points. Gray lines are the tie lines linking a pair of binodal points. The steel blue ellipse is the noise ellipse that reflects the distribution of protein 1 and 2 concentrations. When phase separation takes place, the bulk concentration of protein 1 and 2 (in the noise ellipse) will be projected onto a pair of binodal points, reducing the range of variation.
Quantification and statistical analysis
Comparative statistics of cellular properties, including intracellular pH, membrane potential and cellular fitness, were performed by extracting p-values using 2-tailed unpaired t-test using Prism GraphPad. Significant difference was defined with p-values < 0.05. Exact p-values for individual experiments are indicated in the figure and the figure legends. Exact value and type of n, the precision measures and the statistical parameters are indicated in the figure legends.
Supplementary Material
Figure S1. Phase separation can establish a pH gradient between the cytoplasm and the condensate and regulate cytoplasmic pH, related to Figure 1.
A) Representative ratiomeric image of a distinct pH between the dilute and the dense phases (RLP condensates). Right panel shows the quantification of the C-SNARF-4 signal gradient across the cell.
B) Comparison of cytoplasmic pH based on C-SNARF-4 signal for cells without and with condensates. N = 3 independent experiments with over 30 cells quantified per experiment. The box center line represents the medium and whiskers suggest min to max. Two-tailed t-test for statistical analysis.
C) Evaluations of the capability of condensates to modulate cytoplasmic pH under different extracellular pH conditions. N = 4 independent experiments with over 20 cells quantified per experiment. Data are represented as mean ± SD.
D) Lightning images (Leica Stellaris 8) of a distinct pH between the dilute and the dense phases (RLP condensates) quantified by genetically encoded pHluorin protein 27,28. pHluorin protein was encoded in a Pbad plasmid and co-expressed with plasmid encoding RLP. Right panel shows the quantification of the ratiometric pHluorin signal gradient from the cytoplasm to the condensate. Data are represented as mean ± SD.
E) Representative images of cells containing pHluorin before and after RLP condensate formation. Left panel shows the comparison of cytoplasmic pH based on pHluorin signal for cells without and with condensates. N = 3 independent experiments with over 10 cells quantified per experiment. Two-tailed t-test for statistical analysis.
F) Comparison of cytoplasmic pH based on C-SNARF-4 signal for cells without and with ELP condensates. For condensate formation, cells containing a plasmid encoding ELP ([VPGVG]40) was induced with 0.1 mM IPTG. After 2 h of induction, cytoplasmic pH and condensate pH were quantified with C-SNARF-4 assay. N = 3 independent experiments with over 25 individual cells. The box center line represents the medium and whiskers suggest min to max. Two-tailed t-test for statistical analysis. ns means non-significance.
Figure S2. Inductively coupled plasma mass spectrometry (ICP-MS) analysis of the dense phase and dilute phase ion concentration for in vitro reconstitution of RLP and ELP condensates and analysis of the effects of ELP phase transition on the cytoplasmic ion concentration from cellular lysates, related to Figure 1.
A) In vitro reconstitution assay for direct measurements of ion concentrations in both the dilute and the dense phases of condensates.
B) ICP-MS measurements of ion concentration distribution in both the dilute and the dense phases of RLP condensates. Two-tailed t-test for statistical analysis. *, P<0.05; ns means non-significance.Data are represented as mean ± SD.
C) Cytoplasmic ion concentration of sodium, potassium, magnesium and calcium ions at the conditions with or without ELP condensates (see Methods for temperature dependent phase transition for the preparation of two different cell lysates with or without condensates). Two-tailed t-test for statistical analysis. *, P<0.05; ns means non-significance. Data are represented as mean ± SD.
D) ICP-MS measurements of ion concentration distribution in both the dilute and the dense phases of ELP condensates. Two-tailed t-test for statistical analysis. ****, P<0.0001; ***, P<0.0005; ns means non-significance. In the measurements of ion concentration for ELP condensates, for potassium and calcium ions, their distributions agree with the cytoplasmic measurements; however, for sodium and magnesium ions, even though the effects on cytoplasmic ion distribution are not significant, the distribution of these ions in purified ELP system is noticeably different. This suggests that the complex cytoplasmic components might participate in ELP condensation, which agrees with previous measurements126 on the diverse RNA components in ELP condensate in E. Coli. Data are represented as mean ± SD.
Figure S3. Condensate dependent cellular noise, related to Figure 2.
A) Overexpression of RLP after forming condensates results in the increase of condensate volume fraction.
B) Cytoplasmic protein and condensate volume noise in two-component phase separation system. When multi-component condensate is formed, the noise of the dilute phase protein concentration is suppressed but does not go to zero due to the non-fixed binodal points of multi-component condensates. Thus, fluctuations in the bulk concentration of polymer 1 and 2 result in the fluctuations in dilute phase protein concentration. Regardless, large fluctuation in condensate volume still exists. Data are represented as mean ± SD.
C) Dense phase pH is not strongly correlated with the volume fraction of the condensates.
D) Evaluation of the cellular protein concentration fluctuations before and after condensate formation. Quantification of cytoplasmic RLP-mEGFP protein concentration before and after phase separation. Cells containing gene encoding RLP-mEGFP were induced with 0.05 mM IPTG. Samples without condensates were imaged after 45 min of induction. Samples with condensates were imaged after 90 min of induction. Cytoplasmic protein concentration was quantified based on previous published works24,127.Comparison of the coefficient of variance of cytoplasmic protein concentration based on cells with and without condensates. N = 75 individual cell. This observation confirms that the fluctuation in the cellular pH is not caused by a fluctuation in RLP protein concentration in the cytoplasm.
Figure S4. Understanding the ion source of membrane potential hyperpolarization through chemical clamp assay to depolarize the membrane potential, related to Figure 3.
A) The use of chemical clamp approach to evaluate the ion source of membrane potential hyperpolarization through supplementing specific type of ion source into the extracellular buffer128.
B) Evaluation of the types of ions that can depolarize the membrane potential of cells containing RLP condensates.
C) Evaluation of the capability of ELP condensates on modulating membrane potential and the types of ions that can depolarize the membrane potential of cells containing ELP condensates.
Figure S5. Condensate-dependent modulation of membrane potential, related to Figure 3.
A) Cells containing genes encoding RLP or RLP-sfGFP were induced with 0.1 mM IPTG for 1.5 h before processing with ANEPPS assay. N = 25 individual cell. sfGFP imparts an additional 6 negative charges onto the polypeptides, thereby modulating the membrane potential. The box center line represents the medium and whiskers suggest min to max. Two-tailed t-test for statistical analysis.
B) Evaluation of the generality of this behavior using condensate forming native IDPs including FUS LC and IDP of DDX4. Cells containing genes encoding FUS LC or DDX4-IDP were induced or not induced with 0.5 mM IPTG for 1 h before processing with the ThT assay. For 1,6-hexanediol treatment, the cells containing condensates were incubated with 10% 1,6-hexanediol for 15 min before processing with the ThT assay. The formation of the condensates leads to a shift of membrane potential, while the dissolution of the condensates leads to the restoration of the membrane potential to a level similar to cells without condensates. Samples were characterized through confocal microscopy to evaluate whether the condensates were formed upon expression or dissolved upon the treatment of 1,6-hexanediol.
C) Evaluation of the overexpression of A1 LCD, which did not form condensates in E. Coli under the same amount of expression time as for the tests of FUS LC and IDP of DDX4, on the shift of membrane potential. The overexpression of A1 LCD did not mediate a shift of membrane potential, excluding the possibility of overexpression on mediating the shift of membrane potential. Samples were characterized through confocal microscopy to evaluate whether the condensates were formed upon expression.
Figure S6. The electrochemical effects and the fitness consequence by the formation of native stress condensates in MG1655, related to Figure 1, 3, 4.
A) C-SNARF-4 assay for evaluation of stress condensates formed by prolonged culture of MG1655 cells. An apparent pH gradient was observed between condensates and the cytosol.
B) Evaluation of the effects of different types of stress condensates on the cytoplasmic pH of the cells. The formation of stress condensates shifted the cytoplasmic pH to a more acidic condition, which aligns with a previous report on the effect of stress-induced aggresomes on mediating a more acidic cytoplasmic environment129. The box center line represents the medium and whiskers suggest min to max. Two-tailed t-test for statistical analysis with ****, p<0.0001.
C) ANEPPS assay for evaluation of the shift of membrane potential due to the formation of stress condensates formed by prolonged culture or heat stress of MG1655 cells. A significant hyperpolarization of membrane potential was observed for cells with stressed condensates compared to cells without condensates. The box center line represents the medium and whiskers suggest min to max. Two-tailed t-test for statistical analysis with ****, p<0.0001.
D) ThT assay for evaluation of the shifts of membrane potential due to the formation or the dissolution of stress-induced condensates. The addition of 1,6-hexanodiel results in the decrease number of observable stress-induced condensates and a substantial decrease of ThT signal. These observations suggest a strong correlation between condensate formation and the shift of membrane potential.
E) Evaluation of cellular growth of cells with or without heat stress-induced condensates in M9 minimum medium with 2 μg/mL ampicillin or with 0.5 μg/mL gentamicin. Data are represented as mean ± SD.
Table S2. Summary of the significant DEGs and their categories, related to Figure 5.
Highlights.
Condensate formation regulates cytoplasmic ion distribution.
Condensate formation modulates membrane potential.
Condensate-dependent electrochemical effects affect cellular physiology.
ACKNOWLEDGMENTS
We thank the Duke Light Microscopy Core facility for experimental support. This work was supported by the Air Force Office of Scientific Research (FA9550-20-1-0241) to L.Y. and A.C. and by the NIH (R35-GM127042) to A.C. We appreciate discussions with and comments from Rohit V. Pappu in the Department of Biomedical Engineering at Washington University in St. Louis, Clifford Brangwynne in the Department of Chemical and Biological Engineering at Princeton University, and Amy Gladfelter and Christine Roden in the Department of Cell Biology at Duke University.
Footnotes
DECLARATION OF INTERESTS
The authors declare no competing interests.
Publisher's Disclaimer: This is a PDF file of an unedited manuscript that has been accepted for publication. As a service to our customers we are providing this early version of the manuscript. The manuscript will undergo copyediting, typesetting, and review of the resulting proof before it is published in its final form. Please note that during the production process errors may be discovered which could affect the content, and all legal disclaimers that apply to the journal pertain.
References
- 1.Banani SF, Lee HO, Hyman AA, and Rosen MK (2017). Biomolecular condensates: organizers of cellular biochemistry. Nature Reviews Molecular Cell Biology 18, 285–298. 10.1038/nrm.2017.7. [DOI] [PMC free article] [PubMed] [Google Scholar]
- 2.Alberti S, and Hyman AA (2021). Biomolecular condensates at the nexus of cellular stress, protein aggregation disease and ageing. Nature Reviews Molecular Cell Biology 22, 196–213. 10.1038/s41580-020-00326-6. [DOI] [PubMed] [Google Scholar]
- 3.Mittag T, and Pappu RV (2022). A conceptual framework for understanding phase separation and addressing open questions and challenges. Molecular Cell. [DOI] [PMC free article] [PubMed] [Google Scholar]
- 4.Bremer A, Farag M, Borcherds WM, Peran I, Martin EW, Pappu RV, and Mittag T (2022). Deciphering how naturally occurring sequence features impact the phase behaviours of disordered prion-like domains. Nature Chemistry 14, 196–207. 10.1038/s41557-021-00840-w. [DOI] [PMC free article] [PubMed] [Google Scholar]
- 5.Wei M-T, Elbaum-Garfinkle S, Holehouse AS, Chen CC-H, Feric M, Arnold CB, Priestley RD, Pappu RV, and Brangwynne CP (2017). Phase behaviour of disordered proteins underlying low density and high permeability of liquid organelles. Nature Chemistry 9, 1118–1125. 10.1038/nchem.2803. [DOI] [PMC free article] [PubMed] [Google Scholar]
- 6.Wang J, Choi J-M, Holehouse AS, Lee HO, Zhang X, Jahnel M, Maharana S, Lemaitre R, Pozniakovsky A, Drechsel D, et al. (2018). A Molecular Grammar Governing the Driving Forces for Phase Separation of Prion-like RNA Binding Proteins. Cell 174, 688–699.e616. 10.1016/j.cell.2018.06.006. [DOI] [PMC free article] [PubMed] [Google Scholar]
- 7.Dai Y, Chamberlayne CF, Messina MS, Chang CJ, Zare RN, You L, and Chilkoti A (2023). Interface of biomolecular condensates modulates redox reactions. Chem 9, 1594–1609. 10.1016/j.chempr.2023.04.001. [DOI] [PMC free article] [PubMed] [Google Scholar]
- 8.Zhang P, Alsaifi NM, Wu J, and Wang Z-G (2018). Polyelectrolyte complex coacervation: Effects of concentration asymmetry. The Journal of Chemical Physics 149. 10.1063/1.5028524. [DOI] [PubMed] [Google Scholar]
- 9.Zhang P, and Wang Z-G (2021). Interfacial Structure and Tension of Polyelectrolyte Complex Coacervates. Macromolecules 54, 10994–11007. 10.1021/acs.macromol.1c01809. [DOI] [Google Scholar]
- 10.Chen S, and Wang Z-G (2022). Driving force and pathway in polyelectrolyte complex coacervation. Proceedings of the National Academy of Sciences 119, e2209975119. doi: 10.1073/pnas.2209975119. [DOI] [PMC free article] [PubMed] [Google Scholar]
- 11.Cakmak FP, Choi S, Meyer MO, Bevilacqua PC, and Keating CD (2020). Prebiotically-relevant low polyion multivalency can improve functionality of membraneless compartments. Nature Communications 11, 5949. 10.1038/s41467-020-19775-w. [DOI] [PMC free article] [PubMed] [Google Scholar]
- 12.Welsh TJ, Krainer G, Espinosa JR, Joseph JA, Sridhar A, Jahnel M, Arter WE, Saar KL, Alberti S, Collepardo-Guevara R, and Knowles TPJ (2022). Surface Electrostatics Govern the Emulsion Stability of Biomolecular Condensates. Nano Letters 22, 612–621. 10.1021/acs.nanolett.1c03138. [DOI] [PubMed] [Google Scholar]
- 13.Martin RM, Ter-Avetisyan G, Herce HD, Ludwig AK, Lättig-Tünnemann G, and Cardoso MC (2015). Principles of protein targeting to the nucleolus. Nucleus 6, 314–325. 10.1080/19491034.2015.1079680. [DOI] [PMC free article] [PubMed] [Google Scholar]
- 14.King MR, Ruff KM, Lin AZ, Pant A, Farag M, Lalmansingh JM, Wu T, Fossat MJ, Ouyang W, Lew MD, et al. (2024). Macromolecular condensation organizes nucleolar sub-phases to set up a pH gradient. Cell 187, 1889–1906.e1824. 10.1016/j.cell.2024.02.029. [DOI] [PMC free article] [PubMed] [Google Scholar]
- 15.Milo R, and Phillips R (2015). Cell biology by the numbers (Garland Science; ). [Google Scholar]
- 16.Harold FM (1977). ION CURRENTS AND PHYSIOLOGICAL FUNCTIONS IN MICROORGANISMS. Annual Review of Microbiology 31, 181–203. 10.1146/annurev.mi.31.100177.001145. [DOI] [PubMed] [Google Scholar]
- 17.Murphy Michael P. (2008). How mitochondria produce reactive oxygen species. Biochemical Journal 417, 1–13. 10.1042/bj20081386. [DOI] [PMC free article] [PubMed] [Google Scholar]
- 18.Alberts B (2017). Molecular biology of the cell (WW Norton & Company; ). [Google Scholar]
- 19.Zhang P, Alsaifi NM, Wu J, and Wang Z-G (2016). Salting-Out and Salting-In of Polyelectrolyte Solutions: A Liquid-State Theory Study. Macromolecules 49, 9720–9730. 10.1021/acs.macromol.6b02160. [DOI] [Google Scholar]
- 20.Chen S, and Wang Z-G (2023). Charge Asymmetry Suppresses Coarsening Dynamics in Polyelectrolyte Complex Coacervation. arXiv preprint arXiv:2308.16334. [DOI] [PubMed] [Google Scholar]
- 21.Klosin A, Oltsch F, Harmon T, Honigmann A, Jülicher F, Hyman AA, and Zechner C (2020). Phase separation provides a mechanism to reduce noise in cells. Science 367, 464–468. 10.1126/science.aav6691. [DOI] [PubMed] [Google Scholar]
- 22.Dai Y, You L, and Chilkoti A (2023). Engineering synthetic biomolecular condensates. Nature Reviews Bioengineering. 10.1038/s44222-023-00052-6. [DOI] [PMC free article] [PubMed] [Google Scholar]
- 23.Dzuricky M, Rogers BA, Shahid A, Cremer PS, and Chilkoti A (2020). De novo engineering of intracellular condensates using artificial disordered proteins. Nature Chemistry 12, 814–825. 10.1038/s41557-020-0511-7. [DOI] [PMC free article] [PubMed] [Google Scholar]
- 24.Dai Y, Farag M, Lee D, Zeng X, Kim K, Son H. i., Guo X, Su J, Peterson N, Mohammed J, et al. (2023). Programmable synthetic biomolecular condensates for cellular control. Nature Chemical Biology 19, 518–528. 10.1038/s41589-022-01252-8. [DOI] [PMC free article] [PubMed] [Google Scholar]
- 25.Murakami T, Qamar S, Lin Julie Q., Schierle Gabriele S.K., Rees E, Miyashita A, Costa Ana R., Dodd Roger B., Chan Fiona T.S., Michel Claire H., et al. (2015). ALS/FTD Mutation-Induced Phase Transition of FUS Liquid Droplets and Reversible Hydrogels into Irreversible Hydrogels Impairs RNP Granule Function. Neuron 88, 678–690. 10.1016/j.neuron.2015.10.030. [DOI] [PMC free article] [PubMed] [Google Scholar]
- 26.Hunter RC, and Beveridge TJ (2005). Application of a pH-Sensitive Fluoroprobe (C-SNARF-4) for pH Microenvironment Analysis in <i>Pseudomonas aeruginosa</i> Biofilms. Applied and Environmental Microbiology 71, 2501–2510. doi: 10.1128/AEM.71.5.2501-2510.2005. [DOI] [PMC free article] [PubMed] [Google Scholar]
- 27.Mahon MJ (2011). pHluorin2: an enhanced, ratiometric, pH-sensitive green florescent protein. Advances in bioscience and biotechnology (Print) 2, 132. [DOI] [PMC free article] [PubMed] [Google Scholar]
- 28.Linders PTA, Ioannidis M, ter Beest M, and van den Bogaart G (2022). Fluorescence Lifetime Imaging of pH along the Secretory Pathway. ACS Chemical Biology 17, 240–251. 10.1021/acschembio.1c00907. [DOI] [PMC free article] [PubMed] [Google Scholar]
- 29.Simon JR, Eghtesadi SA, Dzuricky M, You L, and Chilkoti A (2019). Engineered ribonucleoprotein granules inhibit translation in protocells. Molecular cell 75, 66–75. e65. [DOI] [PMC free article] [PubMed] [Google Scholar]
- 30.Atkins P, Atkins PW, and de Paula J (2014). Atkins’ physical chemistry (Oxford university press; ). [Google Scholar]
- 31.Sperelakis N (2012). Cell physiology source book: essentials of membrane biophysics (Elsevier; ). [Google Scholar]
- 32.Reymond F, Steyaert G, Carrupt P-A, Testa B, and Girault H (1996). Ionic Partition Diagrams: A Potential–pH Representation. Journal of the American Chemical Society 118, 11951–11957. 10.1021/ja962187t. [DOI] [PubMed] [Google Scholar]
- 33.Atkins P, and De Paula J (2006). Physical chemistry (Macmillan; ). [Google Scholar]
- 34.Chollakup R, Smitthipong W, Eisenbach CD, and Tirrell M (2010). Phase Behavior and Coacervation of Aqueous Poly(acrylic acid)–Poly(allylamine) Solutions. Macromolecules 43, 2518–2528. 10.1021/ma902144k. [DOI] [Google Scholar]
- 35.Li L, Srivastava S, Andreev M, Marciel AB, de Pablo JJ, and Tirrell MV (2018). Phase Behavior and Salt Partitioning in Polyelectrolyte Complex Coacervates. Macromolecules 51, 2988–2995. 10.1021/acs.macromol.8b00238. [DOI] [Google Scholar]
- 36.Zhang P, Shen K, Alsaifi NM, and Wang Z-G (2018). Salt partitioning in complex coacervation of symmetric polyelectrolytes. Macromolecules 51, 5586–5593. [Google Scholar]
- 37.Olesik JW (1991). Elemental analysis using icp-oes and icp/ms. Analytical Chemistry 63, 12A–21A. [Google Scholar]
- 38.Jiang C, and Hsu-Kim H (2014). Direct in situ measurement of dissolved zinc in the presence of zinc oxide nanoparticles using anodic stripping voltammetry. Environmental Science: Processes & Impacts 16, 2536–2544. [DOI] [PubMed] [Google Scholar]
- 39.Hedtfeld M, Dammers A, Koerner C, and Musacchio A A validation strategy to assess the role of phase separation as a determinant of macromolecular localization. Molecular Cell. 10.1016/j.molcel.2024.03.022. [DOI] [PubMed] [Google Scholar]
- 40.Shimamoto T, Inaba K, Thelen P, Ishikawa T, Goldberg EB, Tsuda M, and Tsuchiya T (1994). The NhaB Na+/H+ Antiporter Is Essential for Intracellular pH Regulation under Alkaline Conditions in Escherichia coli1. The Journal of Biochemistry 116, 285–290. 10.1093/oxfordjournals.jbchem.a124521. [DOI] [PubMed] [Google Scholar]
- 41.Kroll R, and Booth I (1983). The relationship between intracellular pH, the pH gradient and potassium transport in Escherichia coli. Biochemical Journal 216, 709–716. [DOI] [PMC free article] [PubMed] [Google Scholar]
- 42.Sun W, Pertzev A, and Nicholson AW (2005). Catalytic mechanism of Escherichia coli ribonuclease III: kinetic and inhibitor evidence for the involvement of two magnesium ions in RNA phosphodiester hydrolysis. Nucleic acids research 33, 807–815. [DOI] [PMC free article] [PubMed] [Google Scholar]
- 43.Gesteland RF (1966). Unfolding of Escherichia coli ribosomes by removal of magnesium. Journal of molecular biology 18, 356–IN314. [DOI] [PubMed] [Google Scholar]
- 44.Martinac B, Buechner M, Delcour AH, Adler J, and Kung C (1987). Pressure-sensitive ion channel in Escherichia coli. Proceedings of the National Academy of Sciences 84, 2297–2301. [DOI] [PMC free article] [PubMed] [Google Scholar]
- 45.Wadsworth GM, Zahurancik WJ, Zeng X, Pullara P, Lai LB, Sidharthan V, Pappu RV, Gopalan V, and Banerjee PR (2023). RNAs undergo phase transitions with lower critical solution temperatures. Nature Chemistry 15, 1693–1704. [DOI] [PMC free article] [PubMed] [Google Scholar]
- 46.Gromelski S, and Brezesinski G (2006). DNA condensation and interaction with zwitterionic phospholipids mediated by divalent cations. Langmuir 22, 6293–6301. [DOI] [PubMed] [Google Scholar]
- 47.Bastos-González D, Pérez-Fuentes L, Drummond C, and Faraudo J (2016). Ions at interfaces: the central role of hydration and hydrophobicity. Current Opinion in Colloid & Interface Science 23, 19–28. 10.1016/j.cocis.2016.05.010. [DOI] [Google Scholar]
- 48.Szatmári D, Sárkány P, Kocsis B, Nagy T, Miseta A, Barkó S, Longauer B, Robinson RC, and Nyitrai M (2020). Intracellular ion concentrations and cation-dependent remodelling of bacterial MreB assemblies. Scientific Reports 10, 12002. 10.1038/s41598-020-68960-w. [DOI] [PMC free article] [PubMed] [Google Scholar]
- 49.Choi J-M, Holehouse AS, and Pappu RV (2020). Physical Principles Underlying the Complex Biology of Intracellular Phase Transitions. Annual Review of Biophysics 49, 107–133. 10.1146/annurev-biophys-121219-081629. [DOI] [PMC free article] [PubMed] [Google Scholar]
- 50.Alberti S, Gladfelter A, and Mittag T (2019). Considerations and Challenges in Studying Liquid-Liquid Phase Separation and Biomolecular Condensates. Cell 176, 419–434. 10.1016/j.cell.2018.12.035. [DOI] [PMC free article] [PubMed] [Google Scholar]
- 51.Riback JA, Zhu L, Ferrolino MC, Tolbert M, Mitrea DM, Sanders DW, Wei M-T, Kriwacki RW, and Brangwynne CP (2020). Composition-dependent thermodynamics of intracellular phase separation. Nature 581, 209–214. 10.1038/s41586-020-2256-2. [DOI] [PMC free article] [PubMed] [Google Scholar]
- 52.Kærn M, Elston TC, Blake WJ, and Collins JJ (2005). Stochasticity in gene expression: from theories to phenotypes. Nature Reviews Genetics 6, 451–464. 10.1038/nrg1615. [DOI] [PubMed] [Google Scholar]
- 53.Paulsson J (2005). Models of stochastic gene expression. Physics of life reviews 2, 157–175. [Google Scholar]
- 54.Riback JA, and Brangwynne CP (2020). Can phase separation buffer cellular noise? Science 367, 364–365. doi: 10.1126/science.aba0446. [DOI] [PubMed] [Google Scholar]
- 55.Deviri D, and Safran SA (2021). Physical theory of biological noise buffering by multicomponent phase separation. Proceedings of the National Academy of Sciences 118, e2100099118. 10.1073/pnas.2100099118. [DOI] [PMC free article] [PubMed] [Google Scholar]
- 56.Jentsch TJ (2016). VRACs and other ion channels and transporters in the regulation of cell volume and beyond. Nature Reviews Molecular Cell Biology 17, 293–307. 10.1038/nrm.2016.29. [DOI] [PubMed] [Google Scholar]
- 57.Hong G, Fu T-M, Qiao M, Viveros RD, Yang X, Zhou T, Lee JM, Park H-G, Sanes JR, and Lieber CM (2018). A method for single-neuron chronic recording from the retina in awake mice. Science 360, 1447–1451. 10.1126/science.aas9160. [DOI] [PMC free article] [PubMed] [Google Scholar]
- 58.Gadsby DC (2009). Ion channels versus ion pumps: the principal difference, in principle. Nature reviews Molecular cell biology 10, 344–352. [DOI] [PMC free article] [PubMed] [Google Scholar]
- 59.Prindle A, Liu J, Asally M, Ly S, Garcia-Ojalvo J, and Süel GM (2015). Ion channels enable electrical communication in bacterial communities. Nature 527, 59–63. 10.1038/nature15709. [DOI] [PMC free article] [PubMed] [Google Scholar]
- 60.Lee D.-y.D., Galera-Laporta L, Bialecka-Fornal M, Moon EC, Shen Z, Briggs SP, Garcia-Ojalvo J, and Süel GM (2019). Magnesium Flux Modulates Ribosomes to Increase Bacterial Survival. Cell 177, 352–360.e313. 10.1016/j.cell.2019.01.042. [DOI] [PMC free article] [PubMed] [Google Scholar]
- 61.Galera-Laporta L, Comerci CJ, Garcia-Ojalvo J, and Süel GM (2021). IonoBiology: The functional dynamics of the intracellular metallome, with lessons from bacteria. Cell Systems 12, 497–508. 10.1016/j.cels.2021.04.011. [DOI] [PMC free article] [PubMed] [Google Scholar]
- 62.Kikuchi K, Galera-Laporta L, Weatherwax C, Lam JY, Moon EC, Theodorakis EA, Garcia-Ojalvo J, and Süel GM (2022). Electrochemical potential enables dormant spores to integrate environmental signals. Science 378, 43–49. doi: 10.1126/science.abl7484. [DOI] [PMC free article] [PubMed] [Google Scholar]
- 63.Jin L, Millard AC, Wuskell JP, Dong X, Wu D, Clark HA, and Loew LM (2006). Characterization and Application of a New Optical Probe for Membrane Lipid Domains. Biophysical Journal 90, 2563–2575. 10.1529/biophysj.105.072884. [DOI] [PMC free article] [PubMed] [Google Scholar]
- 64.Benarroch JM, and Asally M (2020). The Microbiologist’s Guide to Membrane Potential Dynamics. Trends in Microbiology 28, 304–314. 10.1016/j.tim.2019.12.008. [DOI] [PubMed] [Google Scholar]
- 65.Pirbadian S, Chavez MS, and El-Naggar MY (2020). Spatiotemporal mapping of bacterial membrane potential responses to extracellular electron transfer. Proceedings of the National Academy of Sciences 117, 20171–20179. [DOI] [PMC free article] [PubMed] [Google Scholar]
- 66.Humphries J, Xiong L, Liu J, Prindle A, Yuan F, Arjes HA, Tsimring L, and Süel GM (2017). Species-Independent Attraction to Biofilms through Electrical Signaling. Cell 168, 200–209.e212. 10.1016/j.cell.2016.12.014. [DOI] [PMC free article] [PubMed] [Google Scholar]
- 67.Ladouceur A-M, Parmar BS, Biedzinski S, Wall J, Tope SG, Cohn D, Kim A, Soubry N, Reyes-Lamothe R, and Weber SC (2020). Clusters of bacterial RNA polymerase are biomolecular condensates that assemble through liquid–liquid phase separation. Proceedings of the National Academy of Sciences 117, 18540–18549. doi: 10.1073/pnas.2005019117. [DOI] [PMC free article] [PubMed] [Google Scholar]
- 68.Adams DS, and Levin M (2012). Measuring resting membrane potential using the fluorescent voltage reporters DiBAC4 (3) and CC2-DMPE. Cold Spring Harbor Protocols 2012, pdb. prot067702. [DOI] [PMC free article] [PubMed] [Google Scholar]
- 69.Epps DE, Wolfe ML, and Groppi V (1994). Characterization of the steady-state and dynamic fluorescence properties of the potential-sensitive dye bis-(1, 3-dibutylbarbituric acid) trimethine oxonol (Dibac4 (3)) in model systems and cells. Chemistry and physics of lipids 69, 137–150. [DOI] [PubMed] [Google Scholar]
- 70.López-Amorós R, Castel S, Comas-Riu J, and Vives-Rego J (1997). Assessment of E. coli and Salmonella viability and starvation by confocal laser microscopy and flow cytometry using rhodamine 123, DiBAC4 (3), propidium iodide, and CTC. Cytometry: The Journal of the International Society for Analytical Cytology 29, 298–305. [DOI] [PubMed] [Google Scholar]
- 71.Käfer F, Liu F, Stahlschmidt U, Jérôme V, Freitag R, Karg M, and Agarwal S (2015). LCST and UCST in One: Double Thermoresponsive Behavior of Block Copolymers of Poly(ethylene glycol) and Poly(acrylamide-co-acrylonitrile). Langmuir 31, 8940–8946. 10.1021/acs.langmuir.5b02006. [DOI] [PubMed] [Google Scholar]
- 72.Watson JL, Seinkmane E, Styles CT, Mihut A, Krüger LK, McNally KE, Planelles-Herrero VJ, Dudek M, McCall PM, Barbiero S, et al. (2023). Macromolecular condensation buffers intracellular water potential. Nature 623, 842–852. 10.1038/s41586-023-06626-z. [DOI] [PMC free article] [PubMed] [Google Scholar]
- 73.Romero-Perez PS, Dorone Y, Flores E, Sukenik S, and Boeynaems S (2023). When Phased without Water: Biophysics of Cellular Desiccation, from Biomolecules to Condensates. Chemical Reviews 123, 9010–9035. 10.1021/acs.chemrev.2c00659. [DOI] [PMC free article] [PubMed] [Google Scholar]
- 74.Adair GS (1928). A theory of partial osmotic pressures and membrane equilibria, with special reference to the application of Dalton’s law to haemoglobin solutions in the presence of salts. Proceedings of the Royal Society of London. Series A, Containing Papers of a Mathematical and Physical Character 120, 573–603. [Google Scholar]
- 75.Wilbrandt W (1937). THE EFFECT OF ORGANIC IONS ON THE MEMBRANE POTENTIAL OF NERVES. Journal of General Physiology 20, 519–541. 10.1085/jgp.20.4.519. [DOI] [PMC free article] [PubMed] [Google Scholar]
- 76.Patel A, Lee Hyun O., Jawerth L, Maharana S, Jahnel M, Hein Marco Y., Stoynov S, Mahamid J, Saha S, Franzmann Titus M., et al. (2015). A Liquid-to-Solid Phase Transition of the ALS Protein FUS Accelerated by Disease Mutation. Cell 162, 1066–1077. 10.1016/j.cell.2015.07.047. [DOI] [PubMed] [Google Scholar]
- 77.Nott TJ, Petsalaki E, Farber P, Jervis D, Fussner E, Plochowietz A, Craggs TD, Bazett-Jones DP, Pawson T, and Forman-Kay JD (2015). Phase transition of a disordered nuage protein generates environmentally responsive membraneless organelles. Molecular cell 57, 936–947. [DOI] [PMC free article] [PubMed] [Google Scholar]
- 78.Hurdle JG, O’neill AJ, Chopra I, and Lee RE (2011). Targeting bacterial membrane function: an underexploited mechanism for treating persistent infections. Nature Reviews Microbiology 9, 62–75. [DOI] [PMC free article] [PubMed] [Google Scholar]
- 79.Morth JP, Pedersen BP, Buch-Pedersen MJ, Andersen JP, Vilsen B, Palmgren MG, and Nissen P (2011). A structural overview of the plasma membrane Na+, K+-ATPase and H+-ATPase ion pumps. Nature reviews Molecular cell biology 12, 60–70. [DOI] [PubMed] [Google Scholar]
- 80.Emiliani V, Entcheva E, Hedrich R, Hegemann P, Konrad KR, Lüscher C, Mahn M, Pan Z-H, Sims RR, Vierock J, and Yizhar O (2022). Optogenetics for light control of biological systems. Nature Reviews Methods Primers 2, 55. 10.1038/s43586-022-00136-4. [DOI] [PMC free article] [PubMed] [Google Scholar]
- 81.Lasker K, Boeynaems S, Lam V, Scholl D, Stainton E, Briner A, Jacquemyn M, Daelemans D, Deniz A, Villa E, et al. (2022). The material properties of a bacterial-derived biomolecular condensate tune biological function in natural and synthetic systems. Nature Communications 13, 5643. 10.1038/s41467-022-33221-z. [DOI] [PMC free article] [PubMed] [Google Scholar]
- 82.Franzmann TM, Jahnel M, Pozniakovsky A, Mahamid J, Holehouse AS, Nüske E, Richter D, Baumeister W, Grill SW, Pappu RV, et al. (2018). Phase separation of a yeast prion protein promotes cellular fitness. Science 359, eaao5654. 10.1126/science.aao5654. [DOI] [PubMed] [Google Scholar]
- 83.Jin X, Lee J-E, Schaefer C, Luo X, Wollman AJM, Payne-Dwyer AL, Tian T, Zhang X, Chen X, Li Y, et al. (2021). Membraneless organelles formed by liquid-liquid phase separation increase bacterial fitness. Science Advances 7, eabh2929. doi: 10.1126/sciadv.abh2929. [DOI] [PMC free article] [PubMed] [Google Scholar]
- 84.Zitomer RS, and Flaks JG (1972). Magnesium dependence and equilibrium of the Escherichia coli ribosomal subunit association. Journal of Molecular Biology 71, 263–279. 10.1016/0022-2836(72)90350-6. [DOI] [PubMed] [Google Scholar]
- 85.Dai X, Zhu M, Warren M, Balakrishnan R, Patsalo V, Okano H, Williamson JR, Fredrick K, Wang Y-P, and Hwa T (2016). Reduction of translating ribosomes enables Escherichia coli to maintain elongation rates during slow growth. Nature Microbiology 2, 16231. 10.1038/nmicrobiol.2016.231. [DOI] [PMC free article] [PubMed] [Google Scholar]
- 86.Matamouros S, Gensch T, Cerff M, Sachs CC, Abdollahzadeh I, Hendriks J, Horst L, Tenhaef N, Tenhaef J, Noack S, et al. (2023). Growth-rate dependency of ribosome abundance and translation elongation rate in Corynebacterium glutamicum differs from that in Escherichia coli. Nature Communications 14, 5611. 10.1038/s41467-023-41176-y. [DOI] [PMC free article] [PubMed] [Google Scholar]
- 87.Hidalgo San Jose L, and Signer RAJ (2019). Cell-type-specific quantification of protein synthesis in vivo. Nature Protocols 14, 441–460. 10.1038/s41596-018-0100-z. [DOI] [PMC free article] [PubMed] [Google Scholar]
- 88.Pu Y, Li Y, Jin X, Tian T, Ma Q, Zhao Z, Lin S. y., Chen Z, Li B, Yao G, et al. (2019). ATP-Dependent Dynamic Protein Aggregation Regulates Bacterial Dormancy Depth Critical for Antibiotic Tolerance. Molecular Cell 73, 143–156.e144. 10.1016/j.molcel.2018.10.022. [DOI] [PubMed] [Google Scholar]
- 89.Saurabh S, Chong TN, Bayas C, Dahlberg PD, Cartwright HN, Moerner W, and Shapiro L (2022). ATP-responsive biomolecular condensates tune bacterial kinase signaling. Science advances 8, eabm6570. [DOI] [PMC free article] [PubMed] [Google Scholar]
- 90.Khodaparast L, Khodaparast L, Gallardo R, Louros NN, Michiels E, Ramakrishnan R, Ramakers M, Claes F, Young L, Shahrooei M, et al. (2018). Aggregating sequences that occur in many proteins constitute weak spots of bacterial proteostasis. Nature Communications 9, 866. 10.1038/s41467-018-03131-0. [DOI] [PMC free article] [PubMed] [Google Scholar]
- 91.Nelson DL, Lehninger AL, and Cox MM (2008). Lehninger principles of biochemistry (Macmillan; ). [Google Scholar]
- 92.Groisman EA, Hollands K, Kriner MA, Lee E-J, Park S-Y, and Pontes MH (2013). Bacterial Mg2+ Homeostasis, Transport, and Virulence. Annual Review of Genetics 47, 625–646. 10.1146/annurev-genet-051313-051025. [DOI] [PMC free article] [PubMed] [Google Scholar]
- 93.Toesca I, Perard C, Bouvier J, Gutierrez C, and Conter A (2001). The transcriptional activator NhaR is responsible for the osmotic induction of osmCp1, a promoter of the stress-inducible gene osmC in Escherichia coli. Microbiology 147, 2795–2803. 10.1099/00221287-147-10-2795. [DOI] [PubMed] [Google Scholar]
- 94.Almeida LB, B., Bahrudeen M, M.N., Chauhan V, Dash S, Kandavalli V, Häkkinen A, Lloyd-Price J, Cristina SD, P., Baptista ISC, Gupta A, et al. (2022). The transcription factor network of E. coli steers global responses to shifts in RNAP concentration. Nucleic Acids Research 50, 6801–6819. 10.1093/nar/gkac540. [DOI] [PMC free article] [PubMed] [Google Scholar]
- 95.Gunasekera TS, Csonka LN, and Paliy O (2008). Genome-Wide Transcriptional Responses of <i>Escherichia coli</i> K-12 to Continuous Osmotic and Heat Stresses. Journal of Bacteriology 190, 3712–3720. doi: 10.1128/jb.01990-07. [DOI] [PMC free article] [PubMed] [Google Scholar]
- 96.Calamita G (2000). The Escherichia coli aquaporin-Z water channel: MicroReview. Molecular microbiology 37, 254–262. [DOI] [PubMed] [Google Scholar]
- 97.McMeechan A, Roberts M, Cogan TA, Jørgensen F, Stevenson A, Lewis C, Rowley G, and Humphrey TJ (2007). Role of the alternative sigma factors σ E and σ S in survival of Salmonella enterica serovar Typhimurium during starvation, refrigeration and osmotic shock. Microbiology 153, 263–269. [DOI] [PubMed] [Google Scholar]
- 98.Whatmore AM, Chudek JA, and Reed RH (1990). The effects of osmotic upshock on the intracellular solute pools of Bacillus subtilis. Microbiology 136, 2527–2535. [DOI] [PubMed] [Google Scholar]
- 99.Padan E, Bibi E, Ito M, and Krulwich TA (2005). Alkaline pH homeostasis in bacteria: new insights. Biochimica et biophysica acta (BBA)-biomembranes 1717, 67–88. [DOI] [PMC free article] [PubMed] [Google Scholar]
- 100.Roden C, and Gladfelter AS (2021). RNA contributions to the form and function of biomolecular condensates. Nature Reviews Molecular Cell Biology 22, 183–195. 10.1038/s41580-020-0264-6. [DOI] [PMC free article] [PubMed] [Google Scholar]
- 101.Galvanetto N, Ivanović MT, Chowdhury A, Sottini A, Nüesch MF, Nettels D, Best RB, and Schuler B (2023). Extreme dynamics in a biomolecular condensate. Nature 619, 876–883. 10.1038/s41586-023-06329-5. [DOI] [PMC free article] [PubMed] [Google Scholar]
- 102.Heidarsson PO, Mercadante D, Sottini A, Nettels D, Borgia MB, Borgia A, Kilic S, Fierz B, Best RB, and Schuler B (2022). Release of linker histone from the nucleosome driven by polyelectrolyte competition with a disordered protein. Nature Chemistry 14, 224–231. 10.1038/s41557-021-00839-3. [DOI] [PMC free article] [PubMed] [Google Scholar]
- 103.Chowdhury A, Borgia A, Ghosh S, Sottini A, Mitra S, Eapen RS, Borgia MB, Yang T, Galvanetto N, Ivanović MT, et al. (2023). Driving forces of the complex formation between highly charged disordered proteins. Proceedings of the National Academy of Sciences 120, e2304036120. doi: 10.1073/pnas.2304036120. [DOI] [PMC free article] [PubMed] [Google Scholar]
- 104.van der Lee R, Buljan M, Lang B, Weatheritt RJ, Daughdrill GW, Dunker AK, Fuxreiter M, Gough J, Gsponer J, Jones DT, et al. (2014). Classification of Intrinsically Disordered Regions and Proteins. Chemical Reviews 114, 6589–6631. 10.1021/cr400525m. [DOI] [PMC free article] [PubMed] [Google Scholar]
- 105.Rawat N, and Biswas P (2011). Shape, flexibility and packing of proteins and nucleic acids in complexes. Physical Chemistry Chemical Physics 13, 9632–9643. 10.1039/C1CP00027F. [DOI] [PubMed] [Google Scholar]
- 106.Ye S, Latham AP, Tang Y, Hsiung C-H, Chen J, Luo F, Liu Y, Zhang B, and Zhang X (2023). Micropolarity governs the structural organization of biomolecular condensates. bioRxiv, 2023.2003.2030.534881. 10.1101/2023.03.30.534881. [DOI] [PMC free article] [PubMed] [Google Scholar]
- 107.Murthy AC, Dignon GL, Kan Y, Zerze GH, Parekh SH, Mittal J, and Fawzi NL (2019). Molecular interactions underlying liquid–liquid phase separation of the FUS low-complexity domain. Nature Structural & Molecular Biology 26, 637–648. 10.1038/s41594-019-0250-x. [DOI] [PMC free article] [PubMed] [Google Scholar]
- 108.Boyd-Shiwarski CR, Shiwarski DJ, Griffiths SE, Beacham RT, Norrell L, Morrison DE, Wang J, Mann J, Tennant W, Anderson EN, et al. (2022). WNK kinases sense molecular crowding and rescue cell volume via phase separation. Cell 185, 4488–4506.e4420. 10.1016/j.cell.2022.09.042. [DOI] [PMC free article] [PubMed] [Google Scholar]
- 109.Holehouse AS, and Kragelund BB (2024). The molecular basis for cellular function of intrinsically disordered protein regions. Nature Reviews Molecular Cell Biology 25, 187–211. 10.1038/s41580-023-00673-0. [DOI] [PMC free article] [PubMed] [Google Scholar]
- 110.Moses D, Ginell GM, Holehouse AS, and Sukenik S (2023). Intrinsically disordered regions are poised to act as sensors of cellular chemistry. Trends in biochemical sciences. [DOI] [PMC free article] [PubMed] [Google Scholar]
- 111.Zhang M, Zhu C, Duan Y, Liu T, Liu H, Su C, and Lu Y (2022). The intrinsically disordered region from PP2C phosphatases functions as a conserved CO2 sensor. Nature cell biology 24, 1029–1037. [DOI] [PubMed] [Google Scholar]
- 112.Delarue M, Brittingham GP, Pfeffer S, Surovtsev I, Pinglay S, Kennedy K, Schaffer M, Gutierrez J, Sang D, and Poterewicz G (2018). mTORC1 controls phase separation and the biophysical properties of the cytoplasm by tuning crowding. Cell 174, 338–349. e320. [DOI] [PMC free article] [PubMed] [Google Scholar]
- 113.Li S, and Sheng Z-H (2022). Energy matters: presynaptic metabolism and the maintenance of synaptic transmission. Nature Reviews Neuroscience 23, 4–22. [DOI] [PubMed] [Google Scholar]
- 114.Holm RH, Kennepohl P, and Solomon EI (1996). Structural and Functional Aspects of Metal Sites in Biology. Chemical Reviews 96, 2239–2314. 10.1021/cr9500390. [DOI] [PubMed] [Google Scholar]
- 115.Sainsbury S, Niesser J, and Cramer P (2013). Structure and function of the initially transcribing RNA polymerase II–TFIIB complex. Nature 493, 437–440. [DOI] [PubMed] [Google Scholar]
- 116.Rozov A, Khusainov I, El Omari K, Duman R, Mykhaylyk V, Yusupov M, Westhof E, Wagner A, and Yusupova G (2019). Importance of potassium ions for ribosome structure and function revealed by long-wavelength X-ray diffraction. Nature Communications 10, 2519. 10.1038/s41467-019-10409-4. [DOI] [PMC free article] [PubMed] [Google Scholar]
- 117.Gauthier MJ, Flatau GN, Rudulier DL, Clément RL, and Combarro MPC (1991). Intracellular accumulation of potassium and glutamate specifically enhances survival of Escherichia coli in seawater. Applied and Environmental Microbiology 57, 272–276. doi: 10.1128/aem.57.1.272-276.1991. [DOI] [PMC free article] [PubMed] [Google Scholar]
- 118.Poolman B (2023). Physicochemical homeostasis in bacteria. FEMS Microbiology Reviews 47. 10.1093/femsre/fuad033. [DOI] [PMC free article] [PubMed] [Google Scholar]
- 119.Xiang Y, Surovtsev IV, Chang Y, Govers SK, Parry BR, Liu J, and Jacobs-Wagner C (2021). Interconnecting solvent quality, transcription, and chromosome folding in Escherichia coli. Cell 184, 3626–3642.e3614. 10.1016/j.cell.2021.05.037. [DOI] [PubMed] [Google Scholar]
- 120.Jacobs-Wagner C (2024). Through the looking glass: An adventure into the metastable world of the bacterial cytoplasm. Cell 187, 228–234. 10.1016/j.cell.2023.11.034. [DOI] [PubMed] [Google Scholar]
- 121.Wood JM (2006). Osmosensing by Bacteria. Science’s STKE 2006, pe43–pe43. doi: 10.1126/stke.3572006pe43. [DOI] [PubMed] [Google Scholar]
- 122.Parry Bradley R., Surovtsev Ivan V., Cabeen Matthew T., O’Hern Corey S., Dufresne Eric R., and Jacobs-Wagner C (2014). The Bacterial Cytoplasm Has Glass-like Properties and Is Fluidized by Metabolic Activity. Cell 156, 183–194. 10.1016/j.cell.2013.11.028. [DOI] [PMC free article] [PubMed] [Google Scholar]
- 123.Kralj JM, Hochbaum DR, Douglass AD, and Cohen AE (2011). Electrical Spiking in <i>Escherichia coli</i> Probed with a Fluorescent Voltage-Indicating Protein. Science 333, 345–348. doi: 10.1126/science.1204763. [DOI] [PubMed] [Google Scholar]
- 124.Burg MB, Kwon ED, and KÜltz D (1997). Regulation of gene expression by hypertonicity. Annual Review of Physiology 59, 437–455. [DOI] [PubMed] [Google Scholar]
- 125.Bruni GN, Weekley RA, Dodd BJ, and Kralj JM (2017). Voltage-gated calcium flux mediates Escherichia coli mechanosensation. Proceedings of the National Academy of Sciences 114, 9445–9450. [DOI] [PMC free article] [PubMed] [Google Scholar]
- 126.Eghtasadi S, Shapiro D, Deshpande S, Min J, Fiflis D, Rohm D, Dai Y, Asokan A, Gersbach C, and Chilkoti A (2022). Synthetic ribonucleoprotein granules regulate translation of a target mRNA in living cells.
- 127.Chong S, Dugast-Darzacq C, Liu Z, Dong P, Dailey GM, Cattoglio C, Heckert A, Banala S, Lavis L, Darzacq X, and Tjian R (2018). Imaging dynamic and selective low-complexity domain interactions that control gene transcription. Science 361, eaar2555. 10.1126/science.aar2555. [DOI] [PMC free article] [PubMed] [Google Scholar]
- 128.Yang C-Y, Bialecka-Fornal M, Weatherwax C, Larkin JW, Prindle A, Liu J, Garcia-Ojalvo J, and Süel GM (2020). Encoding membrane-potential-based memory within a microbial community. Cell systems 10, 417–423. e413. [DOI] [PMC free article] [PubMed] [Google Scholar]
- 129.Pu Y, Li Y, Jin X, Tian T, Ma Q, Zhao Z, Lin S. y., Chen Z, Li B, and Yao G (2019). ATP-dependent dynamic protein aggregation regulates bacterial dormancy depth critical for antibiotic tolerance. Molecular cell 73, 143–156. e144. [DOI] [PubMed] [Google Scholar]
- 130.Quiroz FG, and Chilkoti A (2015). Sequence heuristics to encode phase behaviour in intrinsically disordered protein polymers. Nature Materials 14, 1164–1171. 10.1038/nmat4418. [DOI] [PMC free article] [PubMed] [Google Scholar]
- 131.Hunter RC, and Beveridge TJ (2005). Application of a pH-sensitive fluoroprobe (C-SNARF-4) for pH microenvironment analysis in Pseudomonas aeruginosa biofilms. Applied and environmental microbiology 71, 2501–2510. [DOI] [PMC free article] [PubMed] [Google Scholar]
- 132.Wolff C, Fuks B, and Chatelain P (2003). Comparative study of membrane potential-sensitive fluorescent probes and their use in ion channel screening assays. Journal of Biomolecular Screening 8, 533–543. [DOI] [PubMed] [Google Scholar]
- 133.Garcia Quiroz F, Li NK, Roberts S, Weber P, Dzuricky M, Weitzhandler I, Yingling YG, and Chilkoti A (2019). Intrinsically disordered proteins access a range of hysteretic phase separation behaviors. Science Advances 5, eaax5177. 10.1126/sciadv.aax5177. [DOI] [PMC free article] [PubMed] [Google Scholar]
- 134.Milkovic NM, and Mittag T (2020). Determination of protein phase diagrams by centrifugation. In Intrinsically Disordered Proteins, (Springer; ), pp. 685–702. [DOI] [PubMed] [Google Scholar]
- 135.Gillespie DT (1977). Exact stochastic simulation of coupled chemical reactions. The Journal of Physical Chemistry 81, 2340–2361. 10.1021/j100540a008. [DOI] [Google Scholar]
- 136.Milo R, & Phillips R. (2015). Cell Biology by the Numbers (1st ed.) (Garland Science; ). 10.1201/9780429258770. [DOI] [Google Scholar]
Associated Data
This section collects any data citations, data availability statements, or supplementary materials included in this article.
Supplementary Materials
Figure S1. Phase separation can establish a pH gradient between the cytoplasm and the condensate and regulate cytoplasmic pH, related to Figure 1.
A) Representative ratiomeric image of a distinct pH between the dilute and the dense phases (RLP condensates). Right panel shows the quantification of the C-SNARF-4 signal gradient across the cell.
B) Comparison of cytoplasmic pH based on C-SNARF-4 signal for cells without and with condensates. N = 3 independent experiments with over 30 cells quantified per experiment. The box center line represents the medium and whiskers suggest min to max. Two-tailed t-test for statistical analysis.
C) Evaluations of the capability of condensates to modulate cytoplasmic pH under different extracellular pH conditions. N = 4 independent experiments with over 20 cells quantified per experiment. Data are represented as mean ± SD.
D) Lightning images (Leica Stellaris 8) of a distinct pH between the dilute and the dense phases (RLP condensates) quantified by genetically encoded pHluorin protein 27,28. pHluorin protein was encoded in a Pbad plasmid and co-expressed with plasmid encoding RLP. Right panel shows the quantification of the ratiometric pHluorin signal gradient from the cytoplasm to the condensate. Data are represented as mean ± SD.
E) Representative images of cells containing pHluorin before and after RLP condensate formation. Left panel shows the comparison of cytoplasmic pH based on pHluorin signal for cells without and with condensates. N = 3 independent experiments with over 10 cells quantified per experiment. Two-tailed t-test for statistical analysis.
F) Comparison of cytoplasmic pH based on C-SNARF-4 signal for cells without and with ELP condensates. For condensate formation, cells containing a plasmid encoding ELP ([VPGVG]40) was induced with 0.1 mM IPTG. After 2 h of induction, cytoplasmic pH and condensate pH were quantified with C-SNARF-4 assay. N = 3 independent experiments with over 25 individual cells. The box center line represents the medium and whiskers suggest min to max. Two-tailed t-test for statistical analysis. ns means non-significance.
Figure S2. Inductively coupled plasma mass spectrometry (ICP-MS) analysis of the dense phase and dilute phase ion concentration for in vitro reconstitution of RLP and ELP condensates and analysis of the effects of ELP phase transition on the cytoplasmic ion concentration from cellular lysates, related to Figure 1.
A) In vitro reconstitution assay for direct measurements of ion concentrations in both the dilute and the dense phases of condensates.
B) ICP-MS measurements of ion concentration distribution in both the dilute and the dense phases of RLP condensates. Two-tailed t-test for statistical analysis. *, P<0.05; ns means non-significance.Data are represented as mean ± SD.
C) Cytoplasmic ion concentration of sodium, potassium, magnesium and calcium ions at the conditions with or without ELP condensates (see Methods for temperature dependent phase transition for the preparation of two different cell lysates with or without condensates). Two-tailed t-test for statistical analysis. *, P<0.05; ns means non-significance. Data are represented as mean ± SD.
D) ICP-MS measurements of ion concentration distribution in both the dilute and the dense phases of ELP condensates. Two-tailed t-test for statistical analysis. ****, P<0.0001; ***, P<0.0005; ns means non-significance. In the measurements of ion concentration for ELP condensates, for potassium and calcium ions, their distributions agree with the cytoplasmic measurements; however, for sodium and magnesium ions, even though the effects on cytoplasmic ion distribution are not significant, the distribution of these ions in purified ELP system is noticeably different. This suggests that the complex cytoplasmic components might participate in ELP condensation, which agrees with previous measurements126 on the diverse RNA components in ELP condensate in E. Coli. Data are represented as mean ± SD.
Figure S3. Condensate dependent cellular noise, related to Figure 2.
A) Overexpression of RLP after forming condensates results in the increase of condensate volume fraction.
B) Cytoplasmic protein and condensate volume noise in two-component phase separation system. When multi-component condensate is formed, the noise of the dilute phase protein concentration is suppressed but does not go to zero due to the non-fixed binodal points of multi-component condensates. Thus, fluctuations in the bulk concentration of polymer 1 and 2 result in the fluctuations in dilute phase protein concentration. Regardless, large fluctuation in condensate volume still exists. Data are represented as mean ± SD.
C) Dense phase pH is not strongly correlated with the volume fraction of the condensates.
D) Evaluation of the cellular protein concentration fluctuations before and after condensate formation. Quantification of cytoplasmic RLP-mEGFP protein concentration before and after phase separation. Cells containing gene encoding RLP-mEGFP were induced with 0.05 mM IPTG. Samples without condensates were imaged after 45 min of induction. Samples with condensates were imaged after 90 min of induction. Cytoplasmic protein concentration was quantified based on previous published works24,127.Comparison of the coefficient of variance of cytoplasmic protein concentration based on cells with and without condensates. N = 75 individual cell. This observation confirms that the fluctuation in the cellular pH is not caused by a fluctuation in RLP protein concentration in the cytoplasm.
Figure S4. Understanding the ion source of membrane potential hyperpolarization through chemical clamp assay to depolarize the membrane potential, related to Figure 3.
A) The use of chemical clamp approach to evaluate the ion source of membrane potential hyperpolarization through supplementing specific type of ion source into the extracellular buffer128.
B) Evaluation of the types of ions that can depolarize the membrane potential of cells containing RLP condensates.
C) Evaluation of the capability of ELP condensates on modulating membrane potential and the types of ions that can depolarize the membrane potential of cells containing ELP condensates.
Figure S5. Condensate-dependent modulation of membrane potential, related to Figure 3.
A) Cells containing genes encoding RLP or RLP-sfGFP were induced with 0.1 mM IPTG for 1.5 h before processing with ANEPPS assay. N = 25 individual cell. sfGFP imparts an additional 6 negative charges onto the polypeptides, thereby modulating the membrane potential. The box center line represents the medium and whiskers suggest min to max. Two-tailed t-test for statistical analysis.
B) Evaluation of the generality of this behavior using condensate forming native IDPs including FUS LC and IDP of DDX4. Cells containing genes encoding FUS LC or DDX4-IDP were induced or not induced with 0.5 mM IPTG for 1 h before processing with the ThT assay. For 1,6-hexanediol treatment, the cells containing condensates were incubated with 10% 1,6-hexanediol for 15 min before processing with the ThT assay. The formation of the condensates leads to a shift of membrane potential, while the dissolution of the condensates leads to the restoration of the membrane potential to a level similar to cells without condensates. Samples were characterized through confocal microscopy to evaluate whether the condensates were formed upon expression or dissolved upon the treatment of 1,6-hexanediol.
C) Evaluation of the overexpression of A1 LCD, which did not form condensates in E. Coli under the same amount of expression time as for the tests of FUS LC and IDP of DDX4, on the shift of membrane potential. The overexpression of A1 LCD did not mediate a shift of membrane potential, excluding the possibility of overexpression on mediating the shift of membrane potential. Samples were characterized through confocal microscopy to evaluate whether the condensates were formed upon expression.
Figure S6. The electrochemical effects and the fitness consequence by the formation of native stress condensates in MG1655, related to Figure 1, 3, 4.
A) C-SNARF-4 assay for evaluation of stress condensates formed by prolonged culture of MG1655 cells. An apparent pH gradient was observed between condensates and the cytosol.
B) Evaluation of the effects of different types of stress condensates on the cytoplasmic pH of the cells. The formation of stress condensates shifted the cytoplasmic pH to a more acidic condition, which aligns with a previous report on the effect of stress-induced aggresomes on mediating a more acidic cytoplasmic environment129. The box center line represents the medium and whiskers suggest min to max. Two-tailed t-test for statistical analysis with ****, p<0.0001.
C) ANEPPS assay for evaluation of the shift of membrane potential due to the formation of stress condensates formed by prolonged culture or heat stress of MG1655 cells. A significant hyperpolarization of membrane potential was observed for cells with stressed condensates compared to cells without condensates. The box center line represents the medium and whiskers suggest min to max. Two-tailed t-test for statistical analysis with ****, p<0.0001.
D) ThT assay for evaluation of the shifts of membrane potential due to the formation or the dissolution of stress-induced condensates. The addition of 1,6-hexanodiel results in the decrease number of observable stress-induced condensates and a substantial decrease of ThT signal. These observations suggest a strong correlation between condensate formation and the shift of membrane potential.
E) Evaluation of cellular growth of cells with or without heat stress-induced condensates in M9 minimum medium with 2 μg/mL ampicillin or with 0.5 μg/mL gentamicin. Data are represented as mean ± SD.
Table S2. Summary of the significant DEGs and their categories, related to Figure 5.
Data Availability Statement
Raw data generated from this study have been deposited at the Dai Lab Github repository: https://github.com/Dailabwustl/Condensate-electrochemical-potential-of-cell, and are publicly available via zenodo DOI:10.5281/zenodo.12769620.
All original code has been deposited at the You Lab Github repository: https://github.com/youlab/Condensate-induced-Noise, and are publicaly available via zenodo DOI:10.5281/zenodo.12745177
Any additional information required to reanalyze the data reported in this paper is available from the lead contact upon request.