

Summary
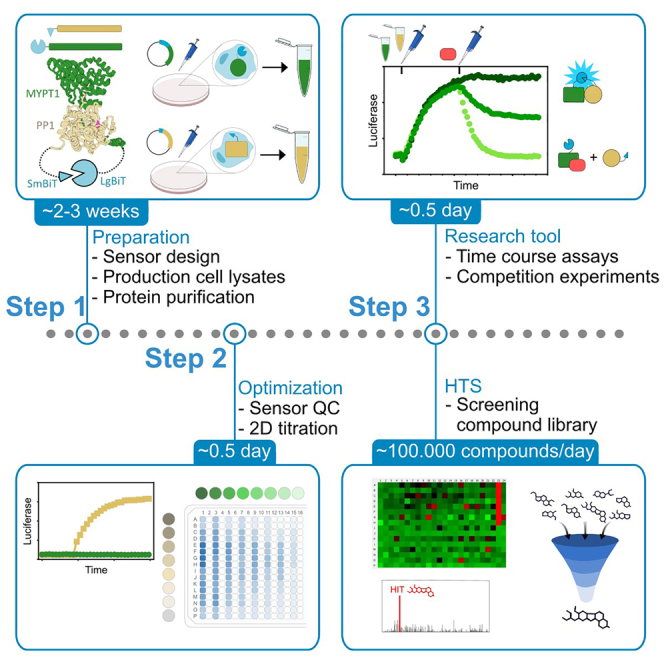
Here, we present a lysate-based split-luciferase assay for examining protein-protein interactions (PPIs) in HEK293T cell lysates, exemplified by interactions between subunits of protein phosphatase PP1. We describe steps for storing and re-using lysates, sensor design, assay setup/optimization, and high-throughput screening of compound libraries. We then detail procedures for applying the assay as a research tool to characterize the dynamics of PPIs, which we illustrate with specific examples.
For complete details on the use and execution of this protocol, please refer to Claes and Bollen.1
Subject areas: Cell Biology, Molecular/Chemical Probes, Protein Biochemistry
Graphical abstract
Highlights
-
•
Guidelines for designing and validating split-luciferase sensors
-
•
Procedure for assay optimization by 2D titration of lysates
-
•
Instructions for high-throughput screening of compound libraries
-
•
Time-course competition assays to monitor protein interaction dynamics
Publisher’s note: Undertaking any experimental protocol requires adherence to local institutional guidelines for laboratory safety and ethics.
Here, we present a lysate-based split-luciferase assay for examining protein-protein interactions (PPIs) in HEK293T cell lysates, exemplified by interactions between subunits of protein phosphatase PP1. We describe steps for storing and re-using lysates, sensor design, assay setup/optimization, and high-throughput screening of compound libraries. We then detail procedures for applying the assay as a research tool to characterize the dynamics of PPIs, which we illustrate with specific examples.
Before you begin
The protocol below describes the specific steps for setting up a lysate-based NanoBiT split-luciferase assay,2 taking the interaction between the beta isoform of protein phosphatase 1 (PP1β) and the Myosin Phosphatase Targeting subunit 1 (MYPT1) as an example. We detail the process of assay development, including the design and production of the sensor components, the testing of assay performance, and assay optimization by cross-titrating lysates in the presence of untagged competitor protein. Additionally, we describe how to apply this assay for high-throughput screening (HTS) of compound libraries and how to use it as a research tool. This assay can be readily adapted for various PPIs, as we successfully implemented this assay for over 20 different phosphatase-subunit interactions, of which 6 have been subjected to HTS.
Sensor design
Timing: 2 weeks
In the following section we show how to design split-luciferase constructs as well as a construct for an untagged competitor protein. This untagged competitor protein directly competes for binding to the PPI interface and, when added in excess, results in the dissociation of the PPI and a loss of luciferase signal. This validates that a sensor is reversible and correctly reports on the PPI that is being studied, which is a prerequisite for time-course competition assays and HTS.
-
1.
Design and clone the necessary mammalian expression vectors for producing the split-luciferase constructs in HEK293T cells. Fuse the LgBiT and SmBiT fragments to your proteins of interest (POI) in such a manner that the fragments efficiently self-complement into active luciferase upon interaction of the two POIs.
Note: The location of tags can be determined rationally for PPIs that are well-characterized, for example using an experimentally determined structure. Tags can be fused N- or C-terminally to your POI or, alternatively, the tag can be inserted in an unstructured region that is close to the interaction site of the partner protein. In our sensors, inserted SmBiT is flanked by 5-residue flexible linkers (such as GGGGS). Alternatively, sensors can be designed empirically as described in the NanoBiT manual (see: https://www.promega.com/-/media/files/resources/protocols/technical-manuals/101/nanobit-protein-protein-interaction-system-protocol.pdf).
Note: For our SmBiT-PP1:LgBiT-MYPT1 sensor, we fused FLAG-LgBiT and FLAG-SmBiT tags to the N-termini of PP1β and MYPT1, respectively, separated by 15-residue flexible linkers (such as 3XGGGGS).
Note: We use Gibson Assembly cloning technology for plasmid construction by following the manufacturer’s protocols.
Note: In this protocol we use a MYPT1 sequence that is truncated after its PP1-binding domain (encompassing residues 1–314). It is also mutated at one of its PP1-contacting sites (35KVKF38 → 35KAKA38) to make it more sensitive to competition at the remaining contact sites. For further details on the rationale behind this approach, see figure 4 and accompanying text in our previous manuscript.1
Optional: Consider the inclusion of affinity tags (Strep-tag, FLAG-tag, …) that can be used for orthogonal assays (immunoprecipitation) and detection by immunoblotting. Avoid the use of fluorescent tags.
CRITICAL: Ensure high expression levels by using vectors with a strong promoter, such as CMV, rather than the weak promoters present in NanoBiT plasmids from Promega, which are intended for assays in living cells but often result in insufficient concentrations of sensor when cells are lysed.
-
2.
Design and clone a bacterial expression vector for purifying untagged competitor protein. By fusing an affinity-purification tag to one of the POIs.
Note: We tagged MYPT1 N-terminally with a polyhistidine tag followed by a 15-residue flexible linker.
Transfection and expression of sensor proteins in HEK293T cells
-
3.
Propagate HEK293T cells in T175 flasks as described in the Animal Cell Culture Guide of the ATCC (https://www.atcc.org/resources/culture-guides/animal-cell-culture-guide).
-
4.Express sensor proteins in HEK293T cells.
-
a.For each split-luciferase construct, combine 16 μg of plasmid DNA with 1,600 μL of jetPRIME buffer and 32 μL jetPRIME reagent.
-
b.Collect HEK293T cells from a confluent T175 flask and distribute them over four 150-mm dishes.Note: This corresponds to approximately 12 million cells per 150-mm dish.
-
c.Add complete cell culture medium until a final volume of 20 mL per 150-mm dish.
-
d.Immediately after seeding cells, transfect two plates for each sensor construct by adding 800 μL of jetPRIME transfection mix per plate. Mix contents and move dishes to an incubator.
-
e.After 24 h, aspirate the medium and add 20 mL of fresh medium. Transfer the dishes back to the incubator for an additional 24 h (total protein expression time is 48 h).
-
a.
Preparation of assay lysates
-
5.Harvest the transfected cells using a method of choice (e.g., scraping the cells), and collect cells from each dish in a separate falcon tube. Maintain this on ice throughout the following steps.
-
a.Pellet cells by centrifugation (100 × g for 4 min at 4°C).
-
b.Remove the supernatant and resuspend cells in 1 mL PBS.
-
c.Transfer cells to a microcentrifuge tube and pellet cells again by centrifugation (100 × g for 4 min at 4°C).
-
a.
Pause point: Cell pellets can be stored at −80°C for several months with minimal loss of split-luciferase complementation activity.
-
6.
Remove the supernatant and determine the approximate volume of each cell pellet by weighing it (density of mammalian cells = 1.05–1.1 g/mL).
-
7.
Resuspend (frozen) cell pellet in 10 cell-pellet volumes of cold assay buffer (4°C), supplemented with 1 mM DTT, 0.3 mM PMSF and 0.3 mM benzamidine.
Note: For example, a typical cell pellet weighs ± 0.15 g and should be resuspended in 1.5 mL of assay buffer.
-
8.Lyse cells by performing one freeze-thaw cycle.
-
a.Snap-freeze the resuspended cells by submersing the microcentrifuge tube in liquid nitrogen for 1 min.
-
b.Thaw tubes by transferring them to a box filled with water at 22°C. Proceed immediately to the following step when lysates are thawed.
-
a.
-
9.
Clear lysates by centrifugation at >20,000 × g for 5 min at 4°C.
Note: Centrifugation at lower speed results in lysates that are slightly turbid, which is not desired as it may result in a high background signal.
-
10.
Transfer the cleared lysates to a new tube. Lysates that contain the same sensor construct can be pooled.
-
11.
For each sensor construct, mix 10 μL of lysate with 10 μL of Laemmli sample buffer and use SDS-PAGE followed by immunoblotting to confirm that the sensor constructs have the expected molecular weight.
-
12.
Transfer ± 500 μL aliquots of the cleared lysates to non-binding tubes (LoBind) and store at −80°C for up to 6 months.
Purification of competitor protein(s)
-
13.
Transform competent BL21(DE3) E. coli cells with plasmid encoding the HIS-tagged competitor protein(s) (designed in step 2) on LB agar plates, supplemented with 100 μg/mL ampicillin.
-
14.
Grow colonies at 37°C for 16–24 h, or until colonies can clearly be distinguished by eye (radius ∼1 mm).
-
15.
Inoculate a single colony into 500 mL of LB medium, supplemented with 100 μg/mL ampicillin, and grow at 37°C while shaking (160 rpm).
-
16.
Induce expression with 1 mM IPTG when OD600 is between 0.8 and 1.0.
-
17.
Incubate cultures for 16 h at 18°C while shaking (160 rpm).
-
18.
Pellet cells by centrifugation at 5000 × g for 20 min and discard supernatant.
-
19.
Resuspend cells in 20 cell pellet volumes of bacterial lysis buffer.
-
20.
Snap-freeze the resuspended cells by submersion in liquid nitrogen for 1 min. Thaw in a beaker filled with water (∼22°C).
-
21.
Clear lysates by centrifugation at >20,000 × g for 20 min at 4°C.
-
22.
Add the lysate to Pur Ni-NTA Resin (Thermo Scientific) and incubate and elute as described in the associated User Guide (https://assets.thermofisher.com/TFS-Assets/LSG/manuals/MAN0011700_HisPur_NiNTA_Resin_UG.pdf).
-
23.
Transfer the eluted protein to a dialysis membrane with correct MW-cutoff.
Note: Use a MW-cutoff that is 2–3 times smaller than the molecular weight of the protein to ensure efficient retention.
-
24.
Perform buffer exchange by placing the dialysis membrane for 1 h at 4°C in a 1 L solution of dialysis buffer (50 mM Tris at pH 8.0, 500 mM NaCl, 1 mM DTT).
Note: The volume of dialysis buffer should be at least 100 times the volume of the protein solution. Typically we use 1 L.
-
25.
Transfer the dialysis membrane to 1 L of fresh dialysis buffer and incubate 16–18 h at 4°C.
-
26.
Place each dialysis membrane for 30 min in a bag or container with a volume of pure glycerol that is 10 times the volume of the eluate. Place on rotator to continuously mix contents.
Note: This should result in a final glycerol concentration of 70–80%. If the viscosity is too high for accurate pipetting, add a small volume of water (∼30% of the glycerol-dialyzed prep volume).
Note: Glycerol stabilizes the protein during freeze-thawing. In addition, dialysis in pure glycerol extracts water from the sample and increases the protein concentration by a factor of 5 or more. This step is useful if the concentration of the purified protein is too low for performing competition assays. As a rule of thumb, the final concentration of the prep should be >100× that of the EC50 (or dissociation constant kD).
-
27.
Remove the prep from the dialysis bag and store in a non-binding tube.
-
28.
Take a 10 mL aliquot of the dialysis buffer, which can serve as vehicle control for the purified protein, for example when used as a competitor in time-course competition assays (see protocol steps 14–23).
-
29.
Analyze protein preps using SDS-PAGE followed by Coomassie Blue staining to confirm that purified proteins have the expected molecular weight. Also determine the approximate concentration by comparison to a BSA standard.
-
30.
Store aliquots of the purified protein prep in non-binding tubes, flash-freeze in liquid nitrogen and store at −80°C.
Key resources table
| REAGENT or RESOURCE | SOURCE | IDENTIFIER |
|---|---|---|
| Bacterial and virus strains | ||
| E. coli DH5α | Made in-house | NA |
| E. coli BL21Gold | Made in-house | NA |
| Chemicals, peptides, and recombinant proteins | ||
| Furimazine | Promega | N1110 |
| Tris | Thermo Fisher Scientific | Cat#15855348 |
| Sodium chloride | Acros Organics | Cat#S/3160/60 |
| Glycerol | Acros Organics | Cat#158920010 |
| Saponin bark extract | VWR | Cat#A18820.14 |
| Dithiothreitol | Thermo Fisher Scientific | Cat#BP172-25 |
| EDTA | Chem-lab Analytical | Cat#CL00.0503.0500 |
| Benzamidine | Acros Organics | Cat#105240050 |
| PMSF | VWR-Avantor | Cat#A0999.0005 |
| Tween 20 | VWR-Avantor | Cat#ICNA11TWEEN201 |
| Triton X-100 | VWR-Avantor | Cat#786-514 |
| Leupeptin hemisulfate | Sanbio | Cat#14026-10 |
| Synthetic C terminus of human PP1β (residues 298–327) | GenScript | NA |
| Lysozyme | Merck | Cat#62971 |
| HisPur Ni-NTA Resin | VWR-Avantor | Cat#88222 |
| Benzonase Nuclease | VWR-Avantor | Cat#70664 |
| Critical commercial assays | ||
| NanoBiT PPI Starter Systems | Promega | N2014 |
| Experimental models: Cell lines | ||
| HEK293T | ATCC | CRL-11268 293T/17 |
| Oligonucleotides | ||
| Primers and gblocks for constructing split-luciferase sensors, see Table S2 in our previous manuscript1 | Integrated DNA technologies | N/A |
| Software and algorithms | ||
| Prism | GraphPad software | https://www.graphpad.com/ |
| Microsoft Excel | Microsoft | http://microsoft.com/en-us/microsoft-365/excel |
| Recombinant DNA | ||
| pET16b-MYPT1(1–314) | Claes et al.1 | Addgene ID 224893 |
| pEGFP-C1-LgBiT-MYPT1(1–314)(KAKA)-Flag | Claes et al.1 | Addgene ID 224894 |
| pEGFP-C1-Flag-SmBiT-PP1b | Claes et al.1 | Addgene ID 224895 |
| Equipment | ||
| Spark multimode reader | Tecan | N/A |
| LuminoSkan Ascent | Thermo Fisher Scientific | N/A |
| Centrifuge | Eppendorf | 5424R |
| 96-well plate, F-bottom, white, non-binding | Greiner | 655904 |
| 384-well plate, F-bottom, white, non-binding | Greiner | 781904 |
| Non-binding tubes | Eppendorf | 0030108442 |
| T175 flask | Sarstedt | 83.3912.002 |
| 150-mm dish | Greiner | 639160 |
Materials and equipment
All dispensing steps in this protocol can be performed accurately with a multichannel pipette (e.g., Gilson PIPETMAN P8 1–20 μL). For large-scale HTS we use robotic equipment, both acoustic and traditional air-displacement dispensers are compatible with the assay. Plates can be measured on any plate reader equipped to monitor luminescence. We use a Spark multimode reader (Tecan) or a LuminoSkan Ascent (Thermo Fisher Scientific).
10× stock of assay buffer
| Reagent | Final concentration | Amount for 1 L |
|---|---|---|
| Tris, pH 7.4 (@25°C) | 500 mM | 60.57 g |
| TWEEN 20 | 0.05% (v/v) | 5 mL |
| NaCl | 1.5 M | 87.66 g |
| EDTA | 5 mM | 1.86 g |
| Saponin | 0.1% | 1 g |
| Leupeptin | 50 μg/mL | 50 mg |
| HCl | to pH 7.4 (@25°C) | As needed |
| ddH2O | N/A | Up to 1 L |
Alternatives: 50 mM HEPES at pH 7.4 can also be used as a buffer system.
Storage Conditions: Aliquot 5 mL into 50 mL tubes and store at −20°C.
Working solution of assay buffer
| Reagent | Final concentration | Amount for 50 mL |
|---|---|---|
| 10× stock of assay buffer | 1× | 5 mL |
| Glycerol | 10% | 5 mL |
| 100 mM stock of PMSF/Benzamidine | 0.3 mM | 150 μL |
| 1 M stock of DTT | 1 mM | 50 μL |
| ddH2O | N/A | Up to 50 mL |
Storage Conditions: The buffer is discarded at the end of the day due to the instability of PMSF/Benzamidine and DTT. If desired, the working solution can be stored at −20°C, but DTT should be added again before use, and PMSF/Benzamidine only if the buffer will be used for cell lysis.
Alternatives: 0.3 mM TCEP can be used instead of DTT.
10× stock of bacterial lysis buffer
| Reagent | Final concentration | Amount for 1 L |
|---|---|---|
| Tris, pH 7.4 at 25°C | 500 mM | 60.57 g |
| Triton-X 100 | 1% (v/v) | 10 mL |
| NaCl | 5 M | 300 g |
| EDTA | 5 mM | 1.86 g |
| LPPP | 50 μg/mL | 50 mg |
| Lysozyme | 5 mg/mL | 5 g |
| Benzonase | 3 U/mL | 3 kU |
| MgCl2 | 20 mM | 2 g |
| HCl | to pH 7.4 at 25°C | As needed |
| ddH2O | N/A | Up to 1 L |
Storage Conditions: Aliquot 4 mL into 50 mL tubes and store at −20°C.
Note: One aliquot is sufficient for lysing bacteria from 1L of culture.
Working solution of bacterial lysis buffer
| Reagent | Final concentration | Amount for 40 mL |
|---|---|---|
| 10× stock of bacterial lysis buffer | 1× | 4 mL |
| 100 mM stock of PMSF/Benz | 0.3 mM | 116 μL |
| 1 M stock of DTT | 1 mM | 40 μL |
| ddH2O | N/A | 36 mL |
Step-by-step method details
In this section we describe the steps for testing the performance of the sensor and for optimizing the sensitivity of the assay using a 2D titration matrix. We also describe two major practical applications of the assay, being high-throughput screening of compound libraries for the discovery of PPI modulators, and its use as a research tool by performing time-course competition assays.
Note: Perform all luminescence readings at the default settings for luminescence measurements of the plater reader (full-spectrum luminescence). If signals are very low, PMT voltage can be increased.
Initial sensor test
-
1.
Supplement 50 μL LgBiT-MYPT1 lysate with 50 μM furimazine.
Note: The furimazine stock solution from Promega (Nano-Glo) is supplied at 2.5 mM, dissolved in ethanol.
-
2.
Dispense 10 μL of LgBiT-MYPT1 lysate (
 ) into four wells of a 384-well plate (step 1 of Figure 1).
Note: Arrange wells in duplicates and leave an empty well in-between to avoid signal bleed-through.
-
3.
Perform a kinetic reading for 1 or 2 min to determine the background signal coming from LgBiT.
-
4.
Dispense 10 μL SmBiT-PP1β construct (
 , signal) or 10 μL assay buffer (
 , background condition, B) in duplicate wells (step 2 of Figure 1). Mix contents by pipetting up and down.
 -
5.
Read the plate kinetically (i.e., continuously at fixed time intervals) until the plateau is reached.
Note: The association and dissociation behavior of most proteins follows exponential decay kinetics, where the rate of change is high at first and slowly decreases afterwards. Most sensors have an association and dissociation phase duration ranging from 2 – 60 min. Sensors that display seemingly ‘instant’ kinetics where the plateau is reached in 10–20 seconds or less are often driven by non-specific ‘sticky’ interactions and should be considered non-functional, see problem 2. After sensor activity has maximized, the signal will slowly decay (t1/2 = 45–60 min), even when sensor activity remains constant. If the decay at the top plateau is more rapid than this, see problem 3.
Figure 1.

Testing the performance of a sensor
Plate-maps illustrating the workflow for testing sensor performance. The steps of dispensing LgBiT-MYPT1 () and SmBiT-PP1β () lysate or buffer () are indicated, and the luciferase signal of a corresponding time-course experiment, showing the association of the SmBiT-PP1β:LgBiT-MYPT1 sensor. The signal and background levels are indicated.
Determination of optimal dilutions by 2D titration
In this section, a 2D titration is performed to determine a lysate dilution factor that has high signal-to-background (S/B) and is maximally sensitive to modulation. Using undiluted lysates is often suboptimal for detecting modulation by purified competitor proteins or small molecules, as one of the sensor components may be present in a molar excess. In addition, in undiluted lysates the concentration of competitor that is available for binding is reduced due to binding with endogenous proteins.
-
6.
Prepare a 2-fold dilution series of SmBiT-PP1β lysate (
 ) and LgBiT-MYPT1 lysate (
 ) in a non-binding 96-well plate (step 1 Figure 2). Supplement all LgBiT-MYPT1 dilutions with 50 μM furimazine. Prepare 200 μL per well.
 -
7.Perform a 2D-titration matrix.
-
a.Using non-binding tips, transfer 10 μL of the SmBiT-PP1β dilution series into alternating columns of a 384-well plate, in duplicate (step 2 Figure 2).
-
b.In the perpendicular direction, add 10 μL of the LgBiT-MYPT1 dilution series (step 3 Figure 2). Mix the contents of each well after each dispensing step. Work from high to low dilutions of SmBiT-PP1β lysate (i.e., from the bottom to the top of the plate) to avoid the need to take new tips at each step.
-
a.
-
8.
Measure bioluminescence kinetically at 3-min intervals until the signal has maximized in all conditions.
-
9.
Convert duplicate values to averages, then calculate the S/B for each condition by dividing the signal conditions from each column with the corresponding background (see S and B annotation in step 3 Figure 2).
-
10.
For each condition, spike 1 well with 2 μL of a positive control modulator (
 ) and 1 well with 2 μL of buffer () (step 4 Figure 2). Avoid taking new tips by dispensing in columns and working from high dilutions of LgBiT-MYPT1 to low dilutions (e.g., right to left). Start by adding buffer to all conditions and then add the positive control.
Note: The final concentration of the positive control depends on its affinity or potency in the assay. We recommend applying the positive control at its EC30 or EC50 (or at the Kd). If this information is not available and cannot be determined, apply competitor at 10 μM.
-
11.
Measure bioluminescence kinetically at 3-min intervals until the plateau has been reached in all conditions.
-
12.
Calculate the extent of modulation of the sensor for each condition to determine the lysate dilutions that are most sensitive to modulation. For details on the calculations, see quantification and statistical analysis.
Figure 2.

Optimizing assay sensitivity by 2D matrix titration of lysates
Plate-maps illustrating the positions for making the dilution series of SmBiT-PP1β () and LgBiT-MYPT1 () lysates in a 96-well plate (Step 1) and for dispensing the dilution series as a 2D matrix in a 384-well plate (Step 2 + 3). Note that the signal and corresponding background wells are marked for the calculation of signal-to-background (S/B) values. The lower left panel shows an example result with the average S/B for each condition plotted and colored to produce a heat-map that indicates the conditions with highest (dark blue) S/B values. In Step 4 a plate map indicates the positions for spiking with a positive competitor () and negative control () and the lower right panel shows the % modulation by the positive control with respect to the negative control. The yellow and green squares indicate the optimal working dilutions for the corresponding assay (HTS or time course competition assay).
Time-course competition assays
This section details the steps for investigating a PPI by performing time-course competition assays to monitor the response of a sensor to modulators with well-characterized binding mechanisms. This type of assay is a powerful tool for gaining insight into the binding mechanism of the PPI under investigation. It also visualizes the dynamic interplay between two proteins in a manner that is straightforward to interpret.
-
13.
Thaw aliquots of LgBiT-MYPT1 and SmBiT-PP1β lysate by placing the tubes in water at 22°C. Once thawed, centrifuge for 2 min at 20,000 × g to remove insoluble debris. Transfer lysate to a clean non-binding tube.
-
14.
Prepare 100 μL of LgBiT-MYPT1 and 100 μL of SmbiT-PP1β lysates in assay buffer at their optimal dilutions, as determined in the 2D titration (i.e., 1:64 and 1:16, respectively).
-
15.
Supplement the diluted LgBiT-MYPT1 lysate with 50 μM furimazine.
-
16.
Dispense duplicates of 10 μL diluted LgBiT-MYPT1 lysate in alternating wells of the first column (2 wells per condition) (step 1 Figure 3).
-
17.
Perform a short kinetic reading to determine the background signal (e.g., 10-s intervals for 1 min).
-
18.
Dispense 10 μL of SmBiT-PP1β lysate (
) in each well and mix (step 2 Figure 3). -
19.
Perform a kinetic reading until the association of the sensor reaches a plateau.
Note: Start this reading as quickly as possible and at the shortest possible time interval to capture the rapid rise in signal during the initial part of the association phase.
-
20.
Spike assay wells with 2 μL of competitor(s) and vehicle control. In this example, we dispensed 1 mM (100 μM final) of a peptide that encompasses the C-terminus of PP1β (residues 298–330) (
 ) or a small molecule PPI modulator (18R1K7, ),1 both having an IC50 of 20–30 μM. We dispensed assay buffer with 3.3% DMSO as vehicle control () (step 3 Figure 3).
 -
21.
Perform a kinetic reading until the competitor-induced dissociation reaches a plateau.
Note: Start this reading as quickly as possible and at the shortest possible time interval to capture the rapid decrease in signal during the initial part of the dissociation phase.
-
22.
Convert luminescence values to sensor activity (%) as described under quantification and statistical analysis.
Optional: To accurately account for assay interference, run the assay in parallel against a suitable counter-screening sensor, such as a LgBiT-SmBiT fusion (see Figure 2 of our previous manuscript1).
Note: See the Expected outcomes section for examples of other applications of the assay as a research tool.
Note: If the competitor of interest does not elicit a response, see problem 5.
Note: If sudden unexpected spikes or drops in the luciferase signal are observed when something is added to the assay or the plate is manipulated, see problem 6.
Figure 3.

Protocol steps for performing a time-course competition assay
Plate-maps illustrating the workflow for performing a time-course competition assay, dispensing LgBiT-MYPT1 () lysate (Step 1) and SmBiT-PP1β () lysate (Step 2), and the subsequent competition (Step 3) with 100 μM C-terminus of PP1β (residues 298–330) () or 100 μM 18R1K7 (), alongside the vehicle control (). The lower panel shows the corresponding luciferase signal over time.
High-throughput screening of compound libraries
The protocol below describes the steps for a manual screening of one 384-well plate filled with compounds (320 wells) and appropriate controls (64 wells), using an assay volume of 100 μL per well.
-
23.Prepare screening plate and lysate screening mix
-
a.Dispense 1 μL of compound stock solution (
 ) (3 mM), positive control (), or vehicle (
 ) in a non-binding 384-well plate (Figure 4).
 -
b.Thaw aliquots of LgBiT-MYPT1 and SmBiT-PP1β lysate in water at 22°C. Once thawed, centrifuge for 2 min at 20,000 × g to remove insoluble debris.
-
c.Prepare 20 mL LgBiT-MYPT1 and 20 mL of SmBiT-PP1β lysate in assay buffer at their optimal dilutions as determined in the 2D titration (e.g., 1:16 and 1:8, respectively).
-
d.Supplement LgBiT-MYPT1 lysate with 50 μM furimazine.
-
a.
-
24.Mix and measure.
-
a.Dispense 50 μL LgBiT-MYPT1 lysate in all wells. Rinse tips in plain assay buffer between dispensing steps to avoid carry-over of compound between wells.
-
b.Dispense and mix 50 μL SmBiT-PP1β lysate in all wells. Rinse tips in plain assay buffer between dispensing steps to avoid carry-over of compound between wells.
-
c.Read plate at the desired end-point. Typically, this is the time that is required for reaching a plateau after addition of positive control competitor in a time-course assay.
-
a.
-
25.
Repeat the screen (steps 13 and 14) against an unrelated sensor.
-
26.
Use the data from both screens to calculate and subtract assay interference, as illustrated in figure S5 of our original manuscript describing the technique.1 The calculations for data correction and determining the percentage of modulation by compounds are described under quantification and statistical analysis. If there are no remaining hits, see problem 7.
Note: The feasibility of an HTS campaign can be tested with a pilot screen of one or a few plates.
Note: It is standard practice to determine the assay performance when setting up a HTS.13 In case of low assay performance (Z’<0.6), see problem 8.
Note: In addition to ‘traditional’ compound libraries, we have successfully used the assay to screen other types of compounds, including natural products and low-Mw compound ‘fragments’ (non-covalent at 0.5–1 mM final, covalent at 50 μM final and assay performed without DTT).
Note: Because the final concentration of DMSO in the assay should not exceed 1%, the total assay volume can only be lowered when the volume of the compound-dispensing step can be reduced, for example by using robotic dispensing. We have successfully screened large compound libraries (∼500K) in 4 μL of assay volume by dispensing 40 nL of compound using acoustic dispensing equipment (1536-well plates).
Figure 4.

Plate layout of a 384-well plate for high-throughput screening of compound libraries
Plate-map illustrating the positions of compounds, positive controls and negative controls.
Expected outcomes
The initial design phase of a sensor is a trial-and-error process that regularly involves several rounds of sensor design to achieve a sensor with good performance. When the assay is optimized by 2D-matrix titration, the raw signal should be highest for undiluted lysates (upper-left), while the maxima of the S/B and the sensitivity to modulation are usually in a condition where at least one lysate is diluted (See Figure 2). For high-throughput screening, an assay performance (Z′) of 0.6–0.9 can be expected if the sensor has adequate activity (S/B > 20).13
Luciferase-based assays are particularly prone to assay interference, which is almost always inhibitory in nature. If it is not mitigated, the initial hit rate of an inhibitory screen can be as high as 5%, and the vast majority (95–99%) of these hits are false-positive. We established an effective approach to mitigate assay interference that involves running the assay in parallel against two unrelated targets, which then serve as counterscreen for each other (Figure 5). We also developed a constitutively active LgBiT-SmBiT fusion construct that selectively reports on assay interference, and is useful when performing time-course competition assays with modulators that exhibit significant assay interference (see figure 2 of our previous manuscript1).
Figure 5.

Assay interference from compounds during high-throughput screening
Photo (left) of a screening plate with blue squares indicating wells that contain a colored compound, and the corresponding activity profile two unrelated sensors tested on the same set of compounds (middle and right). Yellow squares indicate the same set of wells, which contain a colored compound and generate a false-positive result.
A summary of the results from our completed screens is given in Table 1. The confirmed hit rates are low but are in line with other PPI screens that are based on established technologies, such as AlphaScreen and TR-FRET (see figure S5F of our previous manuscript1). Presumably, the low hit rates in PPI-targeted screens stems from the physical properties of PPI interfaces, which have a low propensity for binding to small molecules (i.e., ligandability). The ligandability of a target can be estimated computationally beforehand using in silico methods, such as P2Rank (https://prankweb.cz/). Our preliminary data indicate that the computed ligandability of a target by P2Rank correlates with the probability of finding hits (Table 1). In silico ligandability assessment can therefore be considered when selecting future screening targets.
Table 1.
Summary of screening results using the method described in this protocol
| PP1/PP2A target | Type of modulator | Compounds tested | Confirmed hits (hit rate) | Computed ligandability (P2Rank) |
|---|---|---|---|---|
| PP1:MYPT1-Ank | inhibition | 1,500 | 1 (0.07%) | 8.8 |
| PP1:Inhibitor-2 | inhibition | 1,500 | 0 (NA) | 3.2 |
| B56 (PP2A):LSPI-SliM | inhibition | 65,000 | 2 (0.003%) | 2.4 |
| PP1:SDS22 | inhibition | 65,000 | 0 (NA) | 0 |
| PP2A:B56 | stimulation | 500,000 | 3 (0.0006%) | 1.6 |
The assay is also useful as a research tool (see time-course competition assays) for investigating if, how, and under which conditions two proteins interact with each other. This relies on the use of modulators that bind to one of the sensor proteins in a specific manner that is well-characterized. A list of modulators that we routinely use for time-course competition assays involving PP1 and PP2A holoenzymes is provided in Table 2 (see our previous manuscripts1,4,14 for assays with these modulators). We illustrate some examples of research tool applications further below.
Table 2.
Modulators of interactions between PP1/PP2A subunits that can be used for time-course competition assays
| Type | Name of WT and of non-binding control (if applicable) | Primary use |
|---|---|---|
| Purified recombinant protein | NIPP1-WT (residues 143–224) NIPP1-200RATA203(residues 143–224) | Highly potent PP1 binder that blocks the RVxF and ϕϕ docking sites on PP1. Also has a helical motif that binds near the hydrophobic substrate-binding groove, but is unlikely to compete with other RIPPOs because it uniquely occurs in NIPP1.3 |
| SDS22 SDS22 (E192A, E300A) | Atypical RIPPO that can stabilize/destabilize the binding of specific RIPPOs to PP1 by forming trimeric complexes.4 | |
| PPP1R2/Inhibitor-2 (R2) (13GAAA16,43KSAKA47,147AAAA150) | Blocks the SILK-docking site of PP1 and, using its IDoHA helix, also blocks the active site together with the acidic and hydrophobic substrate-binding grooves of PP1.5 Weakly interferes with the RVxF binding site because of its non-canonical RVxF-motif (KSQKW). | |
| GTP (M-)RAS GDP (M-)RAS | Can stabilize PP1:SHOC2 assembly by forming trimeric complexes in a GTP-dependent manner.6 Binds near the hydrophobic substrate-binding groove. | |
| B56 B56 (E239R) | Blocks the binding site of B-subunits (B55, B56, R3C, STRN3-4) on the PP2A-core dimer. | |
| LPRSSTLPTIHEEEELSLC1X/2X/3X/4XLPRSSTAPTAHEEEELSLC1X/2X/3X/4X | Blocks the LSPI-docking site on PP2A regulatory subunit B56 (all isoforms).7 | |
| MYPT1-(1–314) MYPT1-(1–314)-35KAKA38 | Region of MYPT1 that specifically binds the β isoform of PP1 and sequesters its C-terminal tail.8 Also competes at the RVxF-binding site and at the MyPhONE-docking site, located near the hydrophobic substrate binding groove and overlapping with the binding site of GTP-MRAS. This truncated version of MYPT1 is highly soluble and purifies with high yield. | |
| Monoclonal antibodies | Various epitopes: PP1-termini, (phosphorylated) RVxF motifs, RIPPOs, … | |
| Peptides | SILK SAAA | Blocks the SILK binding site of PP1 |
| CNSRVTFS CNSRATAS | Blocks the RVxF-binding site of PP1 (kD ∼4 μM) | |
| PP1β C-tail peptide | Blocks interactions mediated by the C-tail of PP1 | |
| Compounds | Microcystin-LR | Potent inhibitor (IC50 ∼ 10-nM) of PPP-type phosphatase activity. Blocks the active site and hydrophobic-substrate binding groove.9 Effect occurs slowly due to covalent mechanism involving a cysteine of the β12-β13 loop. |
| Calyculin A | Potent inhibitor (IC50 ∼ 10-9 M) of PPP-type phosphatase activity. Blocks the active site and the hydrophobic- and acidic substrate-binding grooves.10 Acts rapidly and reversibly both in cells and in lysates. | |
| Norcantharidin | Moderately potent (IC50 ∼ 10- μM) inhibitor of PPP-type phosphatase activity that blocks the active site partially,11 preventing access of substrates but not the binding of regulatory subunits, such as R2. Acts rapidly and reversibly and is cell permeable. | |
| Mn2+ | Can readily occupy vacant positions of catalytic metals in the active site of PPPs. | |
| Other | Various kinases | Phosphorylate interaction sites on PPP catalytic or regulatory subunits to stimulate or inhibit specific interactions.12 |
Note: Addition of a kinase to phosphorylate POI1/POI2 should be accompanied by addition of MgATP. We recommend a final concentration of 2 mM Mg and 1 mM ATP. It might also be useful to include phosphatase inhibitors in the assay because many phosphatases are active in HEK293T lysates and these can rapidly reverse protein phosphorylation. We recommend NaF (50 mM), norcantharidin (100 μM) and microcystin-LR (10 μM). Due to its large size, microcystin should not be used with sensors that involve interactions with the active site region as it might sterically hinder the interaction.
The assay shown in Figure 6 illustrates the association between LgBiT-PP1 and PPP1R2(R2)/Inhibitor-2-SmBiT, and the response to addition of competitor, being either purified R2 without split-luciferase tag ( Purified R2), purified NIPP1-(143–225) (
 CD), microcystin-LR (
 MC), or a combination of the latter two (
 MC + CD). Addition of vehicle (
 vehicle) was used as a control and has no effect. These results indicate that the PP1:R2 complex is highly dynamic, and that interference with either the RVxF binding site () or the active site + hydrophobic substrate-binding groove is tolerated (), while simultaneous interference at both sites completely destabilizes the complex (). Sensor activities were normalized to the time-point before addition of competitor (t = 20 min).
Figure 6.

Characterization of the binding behavior of the PP1:PPP1R2 complex
Time-course competition assay with a LgBit-PP1:R2-SmBiT sensor. All competitors were applied at 10 μM. CD: NIPP1 central domain (residues 143–224); MC: microcystin.
The assay in Figure 7 shows the gradual association of LgBiT-PP1 with SDS22-SmBiT in lysates. Addition of excess (10 μM) purified SDS22 without a split-luciferase tag () (t = 5 min) halts complex formation but does not reverse it, indicating that PP1:SDS22 complex formation is (largely) irreversible. The competitors NIPP1 CD () and microcystin-LR (, MC) bind PP1-docking sites that are distinct from the PP1:SDS22 interface, yet are able to decrease the rate of association, suggesting that additional factors might be involved in PP1:SDS22 complex formation (auxiliary proteins, conformational changes, …). These results are in line with recent findings that PP1:SDS22 association is also affected by a third component, Inhibitor-3, which directly binds to both PP1 and SDS22, resulting in the formation of a trimeric complex that is extremely stable and requires ATPase activity for disassembly.14
Figure 7.

Characterization of the binding behavior of the PP1:SDS22 complex
Time-course competition assay with a LgBit-PP1:SDS22-SmBiT sensor. All competitors were applied at 10 μM. CD: NIPP1 central domain (residues 143–224); MC: microcystin.
The assay in Figure 8 shows the association between SmBiT-PP1β and LgBiT-SHOC2, which can be stimulated in a concentration-dependent manner by addition (black arrow, t = 20 min) of purified GTP-MRAS, simulating a key event in the activation of the MAPK signaling cascade.
Figure 8.

Measurement of the stimulation of PP1:SHOC2 complex formation by different concentrations of the modulator GTP-MRAS
Quantification and statistical analysis
For any type of assay, raw data (x) can be processed by normalizing each measurement to the average of the negative control (NC) condition:
For time-course assays, sensor activity is normalized to the signal measured directly before addition of competitor. For high-throughput screening assays, sensor activity is normalized to the non-binding control or vehicle condition. For inhibitory high-throughput screens, raw data can be converted to inhibition expressed as a percentage of maximal inhibition:
For high-throughput screens that look for activation of a sensor, values are expressed as the percentage gain in sensor activity over the negative control condition:
Correcting for assay interference is done by subtracting the normalized modulation (inhibition or activation) values of two sensors from each other:
This correction is based on the assumption that the extent of assay interference is the same for two unrelated sensors, which is usually the case. For an example of this assay interference correction method, we refer to figure S5 of our previous manuscript.1
Calculation of assay performance (Z′) for evaluating the suitability of a HTS assay is done according to Zhang et al.13 Formula terms: average of positive control (μp), average of negative control (μn), standard deviation of positive control (σp), standard deviation of negative control (σn).
Limitations
These assays are semi-quantitative, and allow only relative comparison between different conditions, rather than absolute. Furthermore, the assay is very susceptible to assay interference from various sources (compound spectral interference, buffer conditions, … ) and this needs to be taken into account before data can be interpreted correctly. The initial step of sensor design is an essential prerequisite for performing the assay, but may take significant time and effort before a functional sensor is generated. Finally, any hits that result from HTS need to be rigorously validated by independent orthogonal assays.
Troubleshooting
Problem 1
Sensors with low S/B values (3 < S/B <10) can in theory still be used for assays, depending on what is the cause for low S/B, which can be either a low signal or a high background (initial sensor test, Step 5).
Potential solution
-
•
High background (B): This might be due to very high expression levels of the LgBiT-tagged sensor protein. In that case, dilution of the LgBiT lysate should improve the S/B (limited impact on signal because LgBiT-tagged partner is present in excess). Alternatively, some LgBiT fusion proteins have high residual LgBiT activity, which can be mitigated by including background measurement for the entire duration of the assay and subtracting this value at each time point from those of the sensor conditions. Confirm that there is no BSA present in the assay, as this also causes high background, even in the absence of LgBiT.
-
•Low signal (S): This means that there is not enough complementation between LgBiT and SmBiT, either because the POIs do not interact, or because the position of LgBiT/SmBiT tags in the formed sensor are too distant from each other, precluding efficient complementation. Distinguish between the two scenarios by checking sensor formation with an orthogonal method, such as IP from assay lysates (LgBiT + SmBiT mixture). If sensor proteins co-IP with each other, it means that the POIs can still bind but LgBiT/SmBiT tags are not able to efficiently complement, because they are too distant and/or conformationally restrained. This is commonly seen for sensors involving large proteins, especially when the interaction site of the partner protein is in the middle of the sequence, distant from the tagged N- or C-terminus. This problem can be mediated by repositioning LgBiT/SmBiT tags, through any of the following approaches:
-
○Exhaustive tagging of N- and C-termini with both SmBiT and LgBiT tags, as described in the NanoBiT manual (https://www.promega.com/-/media/files/resources/protocols/technical-manuals/101/nanobit-protein-protein-interaction-system-protocol.pdf).
-
○Insertion of SmBiT into an unstructured region that is closer to the LgBiT-tagged N-or C-terminus of the partner protein. If no information on the structure of the complex is available, then in silico modeling of the complex can provide key information, using for example AlphaFold 2 Multimer or AlphaFold 3.
-
○If insertion of SmBiT is not preferred, N- or C-terminal tags can be brought closer by truncating sequences that are not involved in the interaction.
-
○
If the co-IP shows that there is no association between the sensor proteins, check in the same co-IP whether the endogenous POI binding partner is present. If this is lost, then the selective interaction with the endogenous partner, but not with its tagged version in the sensor, suggests that the sensor interferes with the binding between the protein partners. This can be mitigated by adjusting LgBiT/SmBiT tag positions and/or adjusting the sequence of the POI that is used in the sensor, for example by truncating regions that are not involved in binding (or if this was already the case, using full-length proteins instead).
Problem 2
The binding between some proteins may reach an equilibrium very rapidly due to fast, yet specific binding between the partner proteins (reaching a plateau at ± 10–20 s). Such a sensor is perfectly useable. However, the association may also happen quasi-instantaneous, due to buffer effects or non-specific sticky interactions. Such a sensor does not report on the PPI being investigated and should therefore not be used (initial sensor test, Step 5).
Potential solution
To distinguish between these two scenarios, perform a kinetic assay in the following manner.
-
•
Dispense 10 μL LgBiT-POI1 supplemented with 50 μM furimazine in a single well.
-
•
Measure the signal for a period of 1 min at the shortest interval possible.
-
•
When the plate exits the microplate reader, leave it in the plateholder and dispense and mix SmBiT-POI2.
-
•
Immediately start a kinetic reading at the shortest interval possible (e.g., 1 s) for 1 min.
-
•
At equilibrium, test whether sensor formation is reversible by applying competitor in excess (>10× the EC50 or kD). Keep in mind that sensor dissociation can also be extremely rapid.
The sensor is non-functional if the time until equilibrium is on the order of 10 s or less and there is little response to addition of purified competitor protein. We typically redesign the sensor in a manner as described in problem 1. Alternatively, non-specific interactions can sometimes be mitigated by including low concentrations of additional detergent in the assay. For example, 0.005% of Triton-X 100 or NP-40 can be added to the assay buffer.
Problem 3
A slow decline in luciferase activity is normal. If the amount of active luciferase is constant, the signal half-life is ∼45–60 min. This property is present in all luciferases and is poorly understood. Under some circumstances, after reaching the plateau, the signal decreases more rapidly (Figure 9A) (initial sensor test, Step 5).
Figure 9.

Examples of troubleshooting data
(A) Example of decreasing luciferase activity over time, for an assay where the luciferase activity is too high (blue) and causes substrate depletion and for an assay with acceptable luciferase activity showing normal signal decay (purple, t1/2 = 45–60 min) (See problem 3). Both traces are standardized to 100% for comparison.
(B) Example illustrating how different purification preps of the same competitor can exhibit varying degrees of modulation of a sensor, the arrow indicates when the competitor was added (See problem 5).
(C) Example demonstrating the validation of competitor protein by testing the same protein preparation on a different sensor, the arrow indicates when the competitor was added. (See problem 5).
(D) Example illustrating that for some competitors it is beneficial to use full-length protein to effectively modulate a sensor. Here, His-R2 variants were used to dissociate a PP1:R2 sensor, only full length (FL) R2 could effectively dissociate the sensor, not the truncation mutants ΔN (R2-116-205) and ΔC (R2-1-123). The arrow indicates when the competitor was added. (See problem 5).
(E) Example showing that high concentrations (>100 μM) of competitor protein or peptide might be necessary for complete dissociation of a sensor (See problem 5).
(F) Example illustrating that preincubation with competitor protein before sensor formation can more effectively modulate a sensor compared to competition when the sensor is formed, the arrow indicates when the competitor was added (See problem 5).
(G) Example of assay interference, marked by sudden drops in luciferase signal following addition (arrows) of various components to the plate (See problem 6).
(H) Example demonstrating how temperature changes of the plate impact luciferase signal readout (See problem 6).
Potential solution
There can be various causes and possible solutions.
-
•
Depletion of substrate due to very high sensor activity. As a rule of thumb, sensor activity is too high if the bioluminescence can be seen with the naked eye in a (completely) dark room (at a time point that roughly corresponds to maximal sensor activity, as indicated by the kinetic experiment). Sensor activity can be reduced by diluting sensor components.
-
•
Depletion of DTT. Addition of 1 mM DTT to the assay should improve signal stability.
-
•
Loss of sensor protein by their adherence to plastics. Confirm that assay plates are truly of a non-binding nature. Thus far, we have found only Greiner non-binding plates to be consistently reliable. If these cannot be sourced, detergent may be added to the assay (Triton-X 100, NP-40) to reduce adherence of sensor protein to the plate.
-
•
NanoLuc is an oxygen-dependent luciferase. Under some conditions the availability of oxygen can be a limiting factor. For example, when deep-well plates are used with high assay volumes (100 μL), or when the plate is covered by a lid or sealed for long durations.
Problem 4
It is not clear which dilution to use from the 2D titration due to small differences between the conditions (determination of optimal dilutions by 2D titration, Step 12).
Potential solution
-
•
Apply competitor at the concentration of half-maximal effect (EC50).
-
•
Repeat using a different competitor with higher affinity (dissociation constant in nanomolar range).
-
•
If S/B is sufficiently high at the highest dilutions, start the titration with diluted instead of concentrated lysate, for example a 1:10 dilution.
-
•
Incubate the competitor for longer time points, up to 60 min. Some sensors dissociate very slowly. Distinguish competitor-induced reduction in sensor activity from natural decay of luminescence by comparison to a suitable negative control.
-
•
When completely formed (i.e., signal at the top plateau), some sensors gradually become insensitive to competition. In that case, try reducing the time between sensor formation and the addition of competitor (add when nearly all conditions are at the top plateau), or test whether pre-incubation of LgBiT- or SmBiT-tagged protein with competitor improves the effect of the competitor.
Problem 5
If the positive control competitor (e.g., purified untagged POI1/POI2) does not alter sensor activity to a greater extent than to the negative control, the competitor should not be used as a positive control (determination of optimal dilutions by 2D titration, Step 12).
Potential solution
The cause of this issue can be determined in a variety of ways.
-
•
Verify the quality of the purified competitor protein on Coomassie gel to confirm Mw and purity.
-
•
Test different protein preps or, if necessary, re-purify the protein if different protein preparations elicit a different response (Figure 9B).
-
•
Test the competitor protein against a different sensor that has been validated and, in theory, is also outcompeted by the competitor (Figure 9C). If this is not the case then the competitor is non-functional.
-
•
Confirm that binding of the sensor is reversible. This can be done by applying a different type of competitor (protein, small-molecule, antibody, peptides, …) or, less optimal, by mutating the sensor at essential PPI interface residues, which should result in lower sensor activity. It may also be necessary to include the full-length sequence of the competitor protein to achieve dissociation (Figure 9D).
-
•
Use an orthogonal assay such as Co-IP, to confirm that the sensor is dissociated by addition of competitor. For Co-IP’s, verify that the competitor is present in the IP.
-
•
Purify the other POI partner as competitor protein. We regularly observe large differences in the potency of partner POIs used as competitor. Often, only one of the unlabeled partners is able to completely dissociate the sensor when applied in a molar excess.
-
•
Apply higher concentrations of the competitor protein (peptides or small molecules up to 1 mM, proteins up to 100 μM). This should correspond to increased dissociation of the sensor complex compared to the control (Figure 9E).
-
•
Instead of adding the competitor when the split-luciferase sensor has reached the plateau, test whether pre-incubation of either POI1 or POI2 with competitor leads to a reduction in the amount of sensor that is formed (relevant to sensors that have very slow off-rates or bind quasi-irreversible). An example is shown in Figure 9F.
When the modulator of interest is a small-molecule, confirm that it is soluble at the applied concentration by visually inspecting a solution of the compound in a microcentrifuge tube. If the compound solution appears cloudy, it has likely precipitated. In this case the concentration of compound in the assay should be lowered. If there sufficient compound available, we suggest making a fresh solution at lower concentrations. If the availability of compound is limited, aggregates can be removed by centrifugation at high speeds. Keep in mind that in this case the effective stock concentration of competitor is reduced by an uncertain amount.
Problem 6
Sudden unexpected spikes or drops in the luciferase signal are observed after something was added to the assay or the plate has been manipulated (Figure 9G) (time-course competition assays, Step 22).
Potential solution
-
•
Buffer components (salt, pH) can affect the catalytic activity of the reconstituted luciferase (and of LgBiT), which is observed as sudden drops or jumps in signal when added to the assay. These buffer effects can be mitigated by reducing the amount of volume that is added, or by performing a buffer exchange of the modulator to assay buffer. Additionally, the assay interference from buffer effects can be mitigated by applying vehicle control (See quantification and statistical analysis).
-
•
Temperature difference between plate reader and bench (Figure 9H). In this case, a drop that slowly reverts to its normal trace is typically observed, which is due to cooling of the plate when competitor was added (low assay volumes = little heat capacity). If possible, equalize the temperature of the plate reader to 22°C. If this is not possible, increase the heat capacity by using a plate with deep/chimney wells and filling empty wells that surround the assay wells with buffer or water. Keep in mind that the initial heating of the plate will also be slower, and plates should be equilibrated for ∼10 min in the plate reader to equilibrate the temperature.
Problem 7
There are no remaining hits after assay interference subtraction (high-throughput screening of compound libraries, step 26).
Potential solution
The following steps can be considered:
-
•
Screen a larger and/or more diverse library. Consider increasing the concentration of compound. We typically go for 20–50 μM, because the concomitant increase in assay interference can effectively be eliminated using the counterscreening methods that are described in this protocol. We also have good experience with (covalent) fragment libraries, which should be screened at high concentrations (200–1000 μM) and, for covalent fragments, in the absence of DTT.
-
•
Re-evaluate the ligandability of the target PPI. Typical hit rates for ligandable PPIs are very low (e.g., 1:10.000 is a very high hit rate), at least compared to the ligandability of ‘traditional’ drug targets (enzymes/receptors/ion channels). To estimate the probability of finding hits against a particular target, we recommend computing ligandability in silico using P2Rank and comparing the scores to those from our previous screens (see Table 1 and associated text).
Problem 8
Low Z′ values are either due to insufficient assay window (difference between the positive and negative control values or to a high assay variability). See quantification and statistical analysis and high-throughput screening of compound libraries, step 26.
Potential solution
For improving the S/B, see problem 1. For reducing the variability, confirm that the used plates are truly of non-binding quality. Plates termed low- or medium-binding are not sufficient. Non-specific binding to plastics can be reduced by pre-blocking plates with plain HEK293T lysate coming from non-transfected cells. If this does not reduce variability then the accuracy of the dispensing method should be improved, check each step by dispensing a colored liquid and visually inspecting the plate for deviations or measuring light absorbance in a transparent plate. Increasing the assay volume can also reduce variability.
Resource availability
Lead contact
Mathieu Bollen (mathieu.bollen@kuleuven.be); Zander Claes (zander.claes@kuleuven.be or claes.zander@gmail.com).
Technical contact
Zander Claes (zander.claes@kuleuven.be or claes.zander@gmail.com).
Materials availability
This study did not generate new unique reagents.
Data and code availability
This study did not generate new datasets/codes.
Acknowledgments
This project was financially supported by the Research Foundation-Flanders (FWO grant G095119N), the KU Leuven Research Fund (BOF grant C14/20/101), and the Foundation Against Cancer (STK).
Author contributions
Z.C. developed the method, performed the experiments, and wrote the manuscript. S.L. wrote the manuscript and performed the experiments. M.B. supervised the project.
Declaration of interests
The authors declare no competing interests.
Contributor Information
Zander Claes, Email: claes.zander@gmail.com.
Mathieu Bollen, Email: mathieu.bollen@kuleuven.be.
References
- 1.Claes Z., Bollen M. A split-luciferase lysate-based approach to identify small-molecule modulators of phosphatase subunit interactions. Cell Chem. Biol. 2023;30:1666–1679.e6. doi: 10.1016/J.CHEMBIOL.2023.07.018. [DOI] [PubMed] [Google Scholar]
- 2.Dixon A.S., Schwinn M.K., Hall M.P., Zimmerman K., Otto P., Lubben T.H., Butler B.L., Binkowski B.F., MacHleidt T., Kirkland T.A., et al. NanoLuc Complementation Reporter Optimized for Accurate Measurement of Protein Interactions in Cells. ACS Chem. Biol. 2016;11:400–408. doi: 10.1021/ACSCHEMBIO.5B00753/ASSET/IMAGES/CB-2015-007533_M004.GIF. [DOI] [PubMed] [Google Scholar]
- 3.O’Connell N., Nichols S.R., Heroes E., Beullens M., Bollen M., Peti W., Page R. The molecular basis for substrate specificity of the nuclear NIPP1:PP1 holoenzyme. Structure. 2012;20:1746–1756. doi: 10.1016/J.STR.2012.08.003. [DOI] [PMC free article] [PubMed] [Google Scholar]
- 4.Wu D., Van der Hoeven G., Claes Z., Van Eynde A., Bollen M. DNA damage-induced allosteric activation of protein phosphatase PP1:NIPP1 through Src kinase-induced circularization of NIPP1. FEBS J. 2024;291:2615–2635. doi: 10.1111/FEBS.17064. [DOI] [PubMed] [Google Scholar]
- 5.Hurley T.D., Yang J., Zhang L., Goodwin K.D., Zou Q., Cortese M., Dunker A.K., DePaoli-Roach A.A. Structural basis for regulation of protein phosphatase 1 by inhibitor-2. J. Biol. Chem. 2007;282:28874–28883. doi: 10.1074/JBC.M703472200. [DOI] [PubMed] [Google Scholar]
- 6.Liau N.P.D., Johnson M.C., Izadi S., Gerosa L., Hammel M., Bruning J.M., Wendorff T.J., Phung W., Hymowitz S.G., Sudhamsu J. Structural basis for SHOC2 modulation of RAS signalling. Nature. 2022;609:400–407. doi: 10.1038/S41586-022-04838-3. [DOI] [PMC free article] [PubMed] [Google Scholar]
- 7.Hertz E.P.T., Kruse T., Davey N.E., López-Méndez B., Sigurðsson J.O., Montoya G., Olsen J.V., Nilsson J. A Conserved Motif Provides Binding Specificity to the PP2A-B56 Phosphatase. Mol. Cell. 2016;63:686–695. doi: 10.1016/J.MOLCEL.2016.06.024. [DOI] [PubMed] [Google Scholar]
- 8.Terrak M., Kerff F., Langsetmo K., Tao T., Dominguez R. Structural basis of protein phosphatase 1 regulation. Nature. 2004;429:780–784. doi: 10.1038/NATURE02582. [DOI] [PubMed] [Google Scholar]
- 9.Goldberg J., Huang H.B., Kwon Y.G., Greengard P., Nairn A.C., Kuriyan J. Three-dimensional structure of the catalytic subunit of protein serine/threonine phosphatase-1. Nature. 1995;376:745–753. doi: 10.1038/376745A0. [DOI] [PubMed] [Google Scholar]
- 10.Kita A., Matsunaga S., Takai A., Kataiwa H., Wakimoto T., Fusetani N., Isobe M., Miki K. Crystal structure of the complex between calyculin A and the catalytic subunit of protein phosphatase 1. Structure. 2002;10:715–724. doi: 10.1016/S0969-2126(02)00764-5. [DOI] [PubMed] [Google Scholar]
- 11.Bertini I., Calderone V., Fragai M., Luchinat C., Talluri E. Structural basis of serine/threonine phosphatase inhibition by the archetypal small molecules cantharidin and norcantharidin. J. Med. Chem. 2009;52:4838–4843. doi: 10.1021/JM900610K. [DOI] [PubMed] [Google Scholar]
- 12.Nasa I., Rusin S.F., Kettenbach A.N., Moorhead G.B. Aurora B opposes PP1 function in mitosis by phosphorylating the conserved PP1-binding RVxF motif in PP1 regulatory proteins. Sci. Signal. 2018;11 doi: 10.1126/scisignal.aai8669. [DOI] [PMC free article] [PubMed] [Google Scholar]
- 13.Zhang J.H., Chung T., Oldenburg K.R. A Simple Statistical Parameter for Use in Evaluation and Validation of High Throughput Screening Assays. J. Biomol. Screen. 1999;4:67–73. doi: 10.1177/108705719900400206. [DOI] [PubMed] [Google Scholar]
- 14.Cao X., Lake M., Van der Hoeven G., Claes Z., Del Pino García J., Lemaire S., Greiner E.C., Karamanou S., Van Eynde A., Kettenbach A.N., et al. SDS22 coordinates the assembly of holoenzymes from nascent protein phosphatase-1. Nat. Commun. 2024;15:5359. doi: 10.1038/s41467-024-49746-4. [DOI] [PMC free article] [PubMed] [Google Scholar]
Associated Data
This section collects any data citations, data availability statements, or supplementary materials included in this article.
Data Availability Statement
This study did not generate new datasets/codes.