

Summary
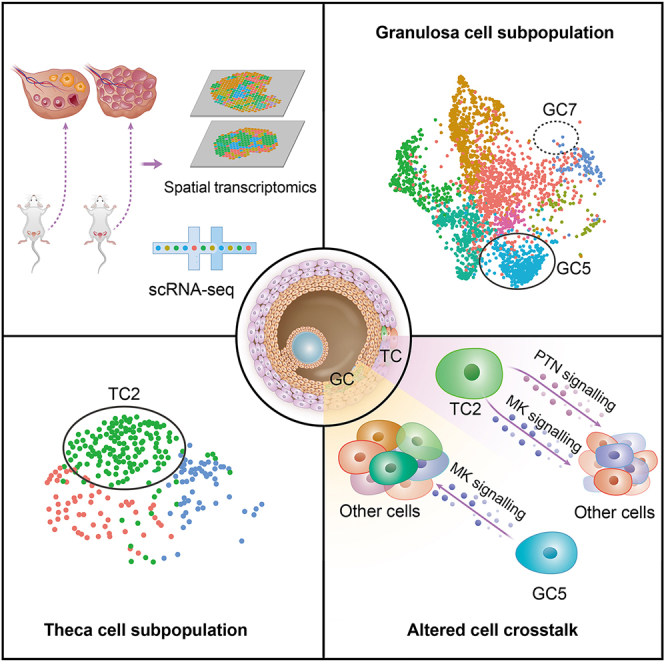
Elevated levels of androgen are risk factors for disrupted follicular maturation in the polycystic ovary syndrome (PCOS), a reproductive disease in women. As essential cell types for follicular maturation, granulosa and thecal cells respond to androgen, but their responses are unclear at the subpopulation level. Using single-cell RNA sequencing and spatial transcriptomics, we examined the subpopulation and function alterations in an androgen-induced PCOS-like mouse model. The results demonstrated that the granulosa cell subset 5 (GC5) was active in inflammation and the thecal cell subtype 2 (TC2) had an enhanced activity in lipid metabolism. The two subsets were expanded in population size and intercellular signaling pathways, such as Ptn-Ncl and Mdk-Ncl. The results reveal that androgen induced landscape and function shifts in the two cell types under the condition of impaired follicular maturation. The study characterizes the ovarian microenvironment in responses to androgen in PCOS mice.
Subject areas: Genetics, Female reproductive endocrinology, Transcriptomics
Graphical abstract
Highlights
-
•
Subset shifts occur in granulosa and thecal cells in androgen-treated ovarian
-
•
An inflammatory subset (GC5) was expanded in the granulosa cells
-
•
The size of a metabolic active subset (TC2) was increased in the thecal cells
-
•
The ligand-receptor interactions were intensified in Ptn-Ncl and Mdk-Ncl
Genetics; Female reproductive endocrinology; Transcriptomics
Introduction
Polycystic ovarian syndrome (PCOS) is a major disease in women with defects in reproductive function, which exhibits menstrual irregularities, infertility, and preterm birth. PCOS etiology is associated with obesity, insulin resistance, and hormone disorders.1,2 Dyslipidemia and cytokine disorders add complexity to the mechanism of clinical manifestation in PCOS.3,4,5,6 A lack of effective drug targets represents a bottle neck in the treatment of PCOS.7
The primary characteristics of PCOS include elevated androgen levels, persistent anovulation, and abnormal polycystic ovarian morphology. Hyperandrogenemia, a central aspect of PCOS, plays a pivotal role in its pathophysiology and is a focal point for research and therapeutic development.8 The ovary, a complex organ, masterfully coordinates crucial cellular interactions fundamental to follicular development and ovulation. Central to this are granulosa cells (GC) and thecal cells (TC), whose symbiosis is essential for hormonal balance, and critical for successful ovulation and fertility. GC, surrounding the oocyte, provides essential growth factors (including estrogen) and nutrients to oocytes in the environment. TC, situated in the outer layer of follicles, mainly provides androgens to GC in support of the biosynthesis of estrogens. Typically, androgens control gene expression by the activation of androgen receptors to influence cellular functions in follicles through cooperation with insulin and other growth factors.8,9,10,11,12 However, in PCOS, excess androgens disrupt the gene expression balance leading to malfunction in GC and TC for anovulation or irregular ovulation. Microenvironment disruption is considered a key factor in PCOS-related anovulatory infertility.13,14,15,16 However, the exact impact of androgen in GC and TC remains unclear, especially at the cell subset levels.
Recent advances in single-cell RNA sequencing (scRNA-seq) and spatial transcriptomics have profoundly enhanced our understanding of the cellular environment in ovarian at the physiological condition. scRNA-seq has brought insight into cell subtypes in ovarian to reveal the detail of cell diversity.17,18,19 Classified ovarian cell types have been reported with specific cell markers. Fst has been used as a marker for GC17,20 and Lhcgr is a marker for luteal cells.21 Cyp17a1 encodes the rate-limiting enzyme for androgen synthesis has been used as a marker for TC.17,22,23,24 Pdgfra is a marker for stroma cell (SC),20 while Flt1 and Rgs5 are widely used as markers for endothelial cell (EC)20,21,25 and perivascular cell (PVC),20,21 respectively. Cd52 has been used to define immune cells, including T cells and B cells, in the scRNA-seq study.21 Spatial transcriptomics further illuminates the distribution and interactions among these cell subtypes within ovarian.20 Despite these advancements, the subset alterations in response to excessive androgen remain absent in the field of PCOS.
In our previous research, we developed androgen-induced PCOS-like mice by the injection of Dehydroepiandrosterone (DHEA), which well replicates the key characteristics of the ovary in PCOS, such as cystic follicles, disrupted estrous cycles, and elevated serum androgen levels.25,26 Using single-cell and spatial transcriptomics, in conjunction with immunofluorescence and common molecular biology techniques, we examined subpopulations of GC and TC in the model. The study concentrated on the alterations in subpopulation size and cellular interactions. The results demonstrate that androgen significantly influenced the subset landscape leading to clear changes in subpopulation size and intercellular communication. The study reveals a complex network of cellular responses to androgen in the pathophysiological condition of PCOS.
Results
Ovarian cell populations revealed by single-cell RNA sequencing and spatial transcriptomics
scRNA-seq was conducted to elucidate single cell landscape within ovarian tissues to understand the androgen-induced changes in the follicular microenvironment (Figure 1A). In the study, 52,216 qualified single cells were obtained from the six ovarian samples after stringent quality control, and the data was subsequently annotated using a combination of the Seurat algorithm and insights gleaned as described in published studies.18,27,28 Analysis was concentrated on six predominant cell types: GC (including Luteal cells), TC (Thecal cells), Stroma Cells (SC), Perivascular Cells (PVC), Endothelial Cells (EC), and Immune Cells (IC) in the ovary (Figure 1B). In terms of population size, GC constituted more than half of the total cell counts at 55.68% by including Luteal cells; PVCs marked the least counts at 3.96%; TC accounted for 4.74% of the total cells (Figure 1C). In the PCOS group, the population size of GC decreased significantly, while the SC population increased markedly (Figure 1D). Specificity and consistency of cell type definition were determined by the top marker genes in each cell type as shown in violin plots and UMAP (Figures 1E and 1F). The top 5 enriched genes in each cell type are presented in the heatmap figure (Figure 1G). The top genes of GC include Inha, Bex4, Fst, Tnni3, and Serpine2, while the top genes in TC are Aldh1a1, Prxl2a, Mgarp, Dnajc15, and Cyp17a1 (Figure 1G). The function of each cell type was defined with the top 50 enriched genes of individual cell types using the Gene Ontology (GO) database (Figure 1H). The results are as follows: Estrogen biosynthesis activity was dominant in GC; Cholesterol metabolism in androgen and glucocorticoid biosynthesis was dominant in TC; Angiogenic and vasculogenic activities were dominant in EC; Muscle contraction was active in PVC; Inflammation and cytokine production were active in IC. The data provides a single-cell atlas of mouse ovary.
Figure 1.

Ovarian cell populations revealed by scRNA-seq and spatial transcriptomics
(A) Diagram illustrating the workflow for scRNA-seq of mouse ovarian tissues using the 10× genomics platform.
(B) UMAP visualization classifying ovarian cells into six distinct types: granulosa cells (GC), thecal cells (TC), stroma cells (SC), perivascular cells (PVC), endothelial cells (EC), and immune cells (IC).
(C) Proportional representation of GC, TC, SC, PVC, EC, and IC.
(D) Comparison of cell type proportions between control and PCOS groups.
(E) Violin plots demonstrating the expression profiles of markers defining each cell type.
(F) Feature plots displaying the distribution of specific cell type markers within the ovarian cell populations.
(G) Heatmap of the top 5 genes with the highest expression levels for each cell type.
(H) Gene ontology biological processes enrichment analysis for the top 50 differentially expressed genes in each cell type.
Immunofluorescence employing Fst and Cyp17a1 proteins was utilized to verify the presence of GC and TC in ovarian tissue sections, as illustrated in Figure 2A. Additionally, the distribution of GC and TC were examined in the ovarian tissue slide using spatial transcriptomics (Figure 2B). The gene expression profile at each data point (each dot) was obtained and used to map cell types at a given location in the slide. Each dot plotted in the spatial transcriptome gave the level of gene expression with color variations. The localizations of GC and TC were further affirmed by employing markers Fst and Cyp17a1, respectively (Figure 2C). Notably, the expression levels of Fst and Cyp17a1 were observed to be elevated in the PCOS group. Moreover, spatial transcriptomic sequencing of ovarian tissues revealed that ovaries from the PCOS group displayed cystic follicles and a marked reduction in size, highlighting the distinctive cellular and morphological changes characteristic of PCOS.
Figure 2.

Delineation of GC and TC populations in PCOS models through immunofluorescence and spatial transcriptomics
(A) Immunofluorescent validation of GC and TC markers, Fst and Cyp17a1, in ovarian tissue sections.
(B) Schematic representation of spatial transcriptomics applied to mouse ovarian tissues, employing the 10× Genomics platform.
(C) Visualization of Fst and Cyp17a1 expression in ovarian sections via spatial transcriptomics, indicating GC and TC distribution. Bar = 250 μm.
Genetic and metabolic shifts in granulosa cells and thecal cells
This research uncovers significant functional alterations in GC and TC in response to androgen, as indicated by the enrichment analysis of gene expression profiles using GO and KEGG databases. In GC, enrichment analysis with upregulated genes against the GO database revealed enhanced biological processes in the PCOS group, including the synthesis of nitrogen-containing compounds, the activity of ERK1 and ERK2 proteins, and the degradation of prostaglandins (Figure 3A). KEGG pathway analysis further illuminated a notable increase in inflammatory pathways and disruptions in hormonal signaling, with significant enhancements in cytokine-cytokine receptor interactions suggesting increased signaling communication (Figure 3B). Pathways such as IL-17, TGF-beta, and TNF were significantly upregulated, highlighting an intensified inflammatory response (Figure 3B). Importantly, pathways involved in ovarian steroidogenesis were markedly active, indicating alterations in steroid production primarily in granulosa cells, which are pertinent to the pathophysiology of PCOS.
Figure 3.

Genetic and metabolic alterations in GC and TC of PCOS ovaries
(A–D) GO enrichment analysis and KEGG pathway enrichment analyses for the top 50 differentially upregulated genes in GC and TC of PCOS versus control groups, respectively. BP, biological processes; CC, cellular components; MF, molecular functions.
(E and F) Comparative overview of metabolic shifts observed in GC and TC between control and PCOS groups, underscoring metabolic reprogramming.
For TC, GO enrichment analysis identified upregulation in cellular processes related to leptin response and epithelial-mesenchymal transition in the PCOS group, suggesting developmental and phenotypic alterations in these cells (Figure 3C). Increases in the gap junction profile and TGF-beta signaling pathways, along with pathways managing xenobiotic metabolism via cytochrome P450 as identified against the KEGG database, suggest an adaptive enhancement in intercellular communication and xenobiotic stress management (Figure 3D).
The study points to metabolic reprogramming in GC and TC in PCOS, as evidenced by the analysis of metabolic pathways against the scMetabolism database. In GC, there was an upregulation in pathways related to lipoic acid metabolism, glycosphingolipid biosynthesis, and oxidative phosphorylation in PCOS (Figure 3E), indicating a shift toward increased energy metabolism, antioxidative defense, and membrane component synthesis. This shift was accompanied by decreases in several metabolic pathways, including pyruvate metabolism, arginine, and lysine synthesis, and the metabolism of sulfur, nitrogen, and retinol. In TC, there was an increase in metabolic pathways crucial for cell survival and proliferation in PCOS, such as selenocompound metabolism and the pentose phosphate pathway, paired with reductions in the degradation of branched-chain amino acids, fatty acid and steroid biosynthesis, glutamine metabolism, and glycosaminoglycan degradation (Figure 3F). These findings suggest that the observed functional changes are linked to metabolic reprogramming in GC and TC following excessive androgen exposure.
Granulosa cells subtype alterations in polycystic ovary syndrome
The current study has identified nine distinct subsets (GC0-GC8) within the granulosa cell population, as demonstrated in UMAP clustering (Figure 4A). The top five marker genes characterizing each subset are illustrated in a heatmap (Figure 4C). Notably, significant compositional shifts were observed in the GC subpopulation of PCOS-like mice. The GC5 subset, in particular, was markedly expanded, increasing by 997.29% from an initial 1.46%–12.95% of the population. In contrast, the GC7 subset experienced the most significant reduction, completely disappearing from its original proportion of 6.73%–0% (Figures 4B and 4D).
Figure 4.

Comprehensive analysis of granulosa cell subpopulations and inflammatory changes in the PCOS Environment
(A) UMAP plot delineating distinct GC subpopulations.
(B) Changes in the proportions of GC subpopulations in PCOS compared to control.
(C) Heatmap illustrating the top 5 markers defining each GC subset.
(D) Visualization of GC subpopulations in the control group and PCOS group via distinct UMAP clusters.
(E and F) GO enrichment analysis and KEGG pathway enrichment analysis for the top 50 specific genes in GC5.
(G) IL-17 and TNF-α in the ovarian homogenate of the control group and PCOS mice (n = 9).
(H) Western blot detection for IL-17 and TNF-α protein levels in control and DHEA-treated GC (n = 3).
(I) qRT-PCR detection for Il17a and Tnf mRNA expression in control and DHEA-treated GC (n = 3). Data are represented as mean ± SD, ∗p < 0.05 by t-test.
An in-depth analysis of the 50 most specifically expressed genes in the GC5 subset was performed using the GO and KEGG databases to understand the functional dynamics and physiological roles of this group (Figures 4E and 4F). This analysis revealed that the GC5 subset likely represents a cell group with specialized roles in initiating inflammatory responses and modulating immune functions. GO analysis highlighted an increased involvement in immune system processes, such as neutrophil and granulocyte chemotaxis, indicating the GC5 subset’s critical role in immune cell recruitment and activation (Figure 4E). KEGG pathway analysis further delineated the signaling pathways prominently active in the GC5 subset, with the NF-κB signaling pathway being notably significant, aligning with its function in managing inflammation and immunity responses. The enhancement of IL-17 and TNF signaling pathways underscores the GC5 subset’s participation in pro-inflammatory signaling. Additionally, the enrichment of the TGF-beta signaling pathway suggests a regulatory role in cell growth and differentiation, potentially underscoring this subset’s functional significance (Figure 4F). ELISA assays were conducted to measure the key inflammatory indicators, such as IL-17 and TNF-α, which showed a significant increase in the PCOS group, supporting the inflammatory nature of the GC5 subset (Figure 4G). Complementary Western blot analysis (Figure 4H) and qRT-PCR assays (Figure 4I) confirmed the upregulation of these inflammatory markers at the protein and mRNA levels, respectively, in the PCOS group. These data suggest that the GC5 subset is more active in inflammation for its role in immune modulation and inflammatory response.
The marker Lhcgr, predominantly expressed in luteinized granulosa cells, was abundant in the GC7 subgroup although the expression was also observed in GC2 and GC4 (Figure 5A). The GC4 subgroup exhibited an increased expression of Cyp19a1, a gene essential for estrogen biosynthesis (Figure 5B), suggesting its role in estrogen production in the granulosa cell population. In terms of angiogenesis, the GC2 subgroup may play a role in its high expression of angiogenic genes (Figure 5C). The GC7 subgroup represented luteinized granulosa cells and decreased in population size in the PCOS group, which was consistent with impaired ovulation in PCOS. Spatial transcriptome data supported the spatial distribution of Lhcgr within ovarian tissue in both control and PCOS groups, revealing a significant reduction in the PCOS group (Figure 5D). The alteration in Lhcgr expression was confirmed by Western blot and qRT-PCR analysis (Figure 5E). Immunohistochemistry (IHC) further confirmed the specific localization of Lhcgr to luteinized granulosa cells (Figure 5F). Moreover, a comparison of UMAP visualizations between the groups revealed a pronounced decline in the GC2 subgroup within the PCOS group (Figure 5G), suggesting a potential disruption in ovarian blood vessel development in the PCOS model. The angiogenesis activity was examined in the GC2 subgroup by analyzing the expression of Vegfa, a key marker for vascular development. Both Western blot and qRT-PCR analysis demonstrated a significant reduction in Vegfa expression, indicating disrupted angiogenesis in the PCOS model (Figure 5H).
Figure 5.

Alterations in luteinization and angiogenesis-related GC subpopulations in PCOS
(A) Violin plots and feature plots displaying the expression of Lhcgr in GC subsets.
(B) Violin plots and feature plots displaying the expression of Cyp19a1 in GC subsets.
(C) GC2 was identified as the granulosa cell subset pivotal in regulating angiogenesis through Gene Set Enrichment Analysis. Cells are colored according to their area under the curve scores, which reflect the activity level of HALLMARK_ANGIOGENESIS gene sets.
(D) Visualization of Lhcgr expression in ovarian sections via spatial transcriptomics.
(E) qRT-PCR and western blot detection for Lhcgr expression level in control and DHEA-treated GC (n = 3).
(F) Immunohistochemistry validation of Lhcgr in ovarian tissue sections. Bar = 100 μm.
(G) Comparison of UMAP visualizations uncovered a pronounced decline in the GC2 subgroup within the PCOS group.
(H) qRT-PCR and Western blot detection for Vegfa expression level in control and DHEA-treated GC (n = 3). Data are represented as mean ± SD, ∗p < 0.05 by t-test.
Thecal cells subset alterations in polycystic ovary syndrome
The current study delineated three distinct subsets within the thecal cell population (Figure 6A), with the top five marker genes for each subset presented in a heatmap (Figure 6B). The TC subpopulation exhibited notable shifts in its composition within PCOS-like mice. Remarkably, the TC2 subset experienced a significant increase in PCOS, with its proportion soaring from 3.35% to 56.99%, suggesting its crucial involvement in the pathophysiology of PCOS (Figures 6C and 6D).
Figure 6.

TC subpopulation dynamics in response to PCOS
(A) UMAP visualization of TC subgroups TC1, TC2, and TC3.
(B) Heatmap of the top 5 expressed genes for each TC subgroup.
(C) Comparative analysis of TC subpopulation proportions between control and PCOS mice, showing a notable increase in TC2 within PCOS.
(D) Visualization of TC subpopulations in control and PCOS groups delineated by distinct UMAP clusters.
(E and F) GO enrichment analyses and KEGG pathway enrichment analysis of the top 50 specific genes in TC2.
(G and H) Western blot detection of SREBF1 and HMGCR proteins in the control and DHEA-treated TC (n = 3).
(I) qRT-PCR detection for Srebf1 and Hmgcr mRNA expression in control and DHEA-treated TC (n = 3). Data are represented as mean ± SD, ∗p < 0.05 by t-test.
To elucidate the functional dynamics of the TC2 subset, an analysis focusing on the top 50 genes specifically expressed in this population was performed. This analysis revealed pronounced activities in lipid transport and metabolism pathways, notably in long-chain fatty acid transport, indicating a metabolic reprogramming within the TC2 subset in the context of PCOS (Figure 6E). Further exploration through the KEGG pathway enrichment analysis uncovered modifications in various biological processes and pathways, including glutathione metabolism and the PPAR signaling pathway, highlighting the metabolic adjustments to androgen exposure in TC2 of the PCOS ovary (Figure 6F). The findings suggest that TC2 cells exhibit heightened activities in lipid metabolism and antioxidant defense, which are amplified by androgen in the PCOS-like model. Additionally, we conducted qRT-PCR and Western blot analysis on TC cells cultured in vitro for Srebf1 and Hmgcr response to DHEA. Upregulation of Srebf1 and Hmgcr was observed in the system, providing evidence for the increased activity in lipid metabolism in the TC2 subset of the PCOS model (Figures 6G–6I).
Alteration of cell crosstalk in polycystic ovary syndrome
Intercellular communication between GC and TC at the subpopulation level was thoroughly examined. The analysis revealed a significant intensification in both the frequency and strength of interactions, indicating a comprehensive reorganization of the cell communication network (Figure 7A). Notably, this data underscores a marked change in communication patterns in PCOS, with particular emphasis on the enhanced intercellular signaling between the TC2 and GC5 subpopulations, where TC2 cells predominantly drove the observed increase in communication (Figures 7B and 7C).
Figure 7.

Ovarian GC and TC crosstalk altered in PCOS
(A) Compared to the control group, the subpopulations of GC and TC in the PCOS group exhibit a significant increase in both the number and strength of inferred intercellular interactions.
(B and C) Altered cellular communication within GC and TC subpopulations in PCOS, notably an enhanced signaling network involving the TC2 and GC5 subpopulations.
(D) Ligand-receptor pair analysis between TC2 and other cell subgroups.
(E) Ligand-receptor pair analysis between GC5 and other cell subgroups.
(F and G) Heatmap visualization of PTN and MK signaling pathway.
(H) Violin plot of Ptn expression in TC2 subpopulation in scRNA-seq data.
(I) Violin plot of Mdk expression in GC5 subpopulation in scRNA-seq data.
(J) Ptn and Mdk levels on individually cultured TC and GC cells treated with DHEA (n = 12).
(K) Ptn and Mdk levels in the medium of GC and TC co-culture system (n = 12).
(L) Gene ontology biological processes enrichment analysis of activated ligand-receptor pairs. Data are represented as mean ± SD, ∗p < 0.05 by t-test.
Further investigation into ligand-receptor pairs revealed that Ptn_Ncl and Mdk_Ncl interactions were significantly pronounced, especially between TC2 and other ovarian cells, suggesting a pivotal mechanism for the disrupted balance of cell subsets and ovarian dysfunction (Figure 7D). The GC5 subpopulation exhibited substantial changes, including an increase in Mdk_Ncl interaction, potentially reflecting mechanisms underlying the pathophysiology of PCOS (Figure 7E). Furthermore, the signaling pathways of pleiotrophin (PTN) and midkine (MK) were identified as being upregulated in PCOS, notably between the TC2 and other cells for PTN (Figure 7F), and between the GC5 and other cells for MK (Figure 7G), indicating substantial modifications within the regulatory networks.
scRNA-seq analyses highlighted significant differences in the expression levels of Ptn and Mdk between control and PCOS groups. Ptn expression was notably higher in the TC2 subgroup of the PCOS group, implicating its role in the pathology of the disorder (Figure 7H). Similarly, Mdk expression showed significant variation, with increased levels observed in the GC5 subgroup of the PCOS ovary (Figure 7I). Enzyme-linked immunosorbent assay (ELISA) results from co-cultured GC and TC confirmed these patterns, evidencing substantial rises in both Ptn and Mdk levels following DHEA treatment (Figure 7J). Additionally, we conducted ELISA on cultured TC and GC cells treated with DHEA, revealing that Ptn levels in TC and Mdk levels were increased in GC, though to a lesser extent than those observed in the co-culture (Figure 7K). This suggests that the interaction between these cell types in the co-culture may amplify the effects observed in the individual cultures. Gene Ontology enrichment analysis for the activated ligand-receptor pairs revealed processes primarily associated with cell proliferation, migration, and protein kinase B signaling, suggesting mechanisms for disturbed folliculogenesis (Figure 7L).
Steroidogenesis aberrations in polycystic ovary syndrome ovaries and the co-culture system of granulosa cells and thecal cells
Serum analysis of mice demonstrated that levels of P4, T, and E2 were notably altered in the PCOS group compared to controls, indicating a systemic disruption in hormone homeostasis associated with the condition (Figure 8A). In the ovarian single-cell transcriptomic data, the expression of key steroidogenic genes, such as Star, Hsd3b1, Cyp11a1, and Cyp17a1, was significantly different between the control and PCOS groups, revealing transcriptional changes that may underlie the steroid biosynthesis disorders in PCOS (Figure 8B).
Figure 8.

Hormonal and genetic disruptions in PCOS
(A) Serum P4, T and E2 levels in different groups (n = 9).
(B) Violin plots of key steroidogenic gene expression in control and PCOS ovaries from scRNA-seq data.
(C) qRT-PCR detection for key steroidogenic genes mRNA expression in control and PCOS ovaries (n = 6).
(D) Heatmap visualization of key steroidogenic gene expression in GC from scRNA-seq data.
(E) qRT-PCR detection for key steroidogenic genes mRNA expression of GC in co-culture system (n = 3).
(F) Heatmap visualization of key steroidogenic gene expression in TC from scRNA-seq data.
(G) qRT-PCR detection for key steroidogenic genes mRNA expression of TC in co-culture system (n = 3).
(H and I) Heatmap visualization of key steroidogenic gene expression in GC subsets and TC subsets from scRNA-seq data. Key steroidogenic genes: Star, Hsd3b1, Cyp11a1, Cyp17a1, and Cyp19a1. Data are represented as mean ± SD, ∗p < 0.05 by t-test.
qRT-PCR analysis of ovarian tissues corroborated these findings, showing a downregulation of Star, Hsd3b1, and Cyp11a1, and an upregulation of Cyp17a1 and Cyp19a1 in the PCOS group (Figure 8C). These alterations in gene expression highlight a shift in the steroidogenic landscape of PCOS ovaries, which is further visualized in the heatmap analyses of granulosa and thecal cell subtypes (Figures 8D, 8F, 8H, and 8I). The heatmaps expose a cell-type-specific response to the PCOS environment, with particular disruptions evident in the expression profiles of the steroidogenesis-related genes.
Following co-culture of GC and TC, subsequent qRT-PCR analysis revealed significant downregulation of Star and Cyp11a1 in GC, with non-significant reductions in Hsd3b1 and increases in Cyp17a1, while Cyp19a1 levels were significantly elevated (Figure 8E). Conversely, in TC collected after co-culture, there was a notable decrease in Star expression and a significant increase in Cyp17a1, with other genes showing no significant change (Figure 8G). The contrasting gene expression patterns observed in GC and TC after co-culture emphasize the complex regulatory alterations of steroidogenic pathways in the PCOS-like model, suggesting cell-specific steroidogenic responses to the PCOS-associated hyperandrogenic environment.
Discussion
The intricate relationship between PCOS and its underlying molecular mechanisms has long been a topic of significant scientific interest. Our study provides extensive insights into the dynamic changes within the ovarian microenvironment in a model of PCOS, particularly focusing on GC and TC. By employing advanced scRNA-seq and spatial transcriptomics, we elucidate significant alterations in cellular landscapes, steroidogenesis, and intercellular communication. These findings not only deepen our understanding of PCOS pathophysiology but also highlight potential therapeutic targets.
We identified an increased inflammatory state in GC and TC cells within the follicular microenvironment of PCOS. Notably, GC showed enhanced transcriptional activity, with an upsurge in pro-inflammatory cytokine (IL-17, TGF-β, and TNF) signaling along the hormone alteration. While TC exhibited significant changes in leptin (proinflammatory cytokine)29 signaling and tissue remodeling. These observations extend the mechanism of inflammation status in ovaries of PCOS as reported by others.30,31,32,33,34 Additionally, the GC7 subpopulation, representing luteinized granulosa cells, is decreased in the PCOS group, yet serum P4 levels are increased. This discrepancy may be due to the fact that GC7 is not the sole source of serum P4.35 Thecal cells and various granulosa cell subpopulations may exhibit enhanced steroidogenesis in response to the hyperandrogenic environment in PCOS. Disruptions of the HPG axis could lead to increased luteinizing hormone production, which stimulates serum P4 elevation despite the reduction in ovarian luteinized cells.36,37,38 Moreover, the adrenal glands, which can produce progesterone, might contribute to the elevated P4 in PCOS.39,40 Adrenal hyperactivity, a common feature in PCOS, could also play a role in the P4 elevation independent of ovarian function.41,42
The nuanced expansion and diminution of specific GC and TC subsets in response to androgen exposure underscore the cellular heterogeneity characteristic of the ovarian microenvironment, revealing its vulnerability to hormonal imbalances. The marked increase in the TC2 subset alongside the substantial alterations in the GC5 subset in conditions of PCOS highlights the crucial roles these cells play in the pathology of the disease. Such shifts in cellular composition illuminate the intricate nature of PCOS, reframing it from solely a reproductive disorder to a complex condition marked by detailed, cell-type-specific responses within the ovarian milieu. This perspective aligns with the insights provided by Rosenfield and Ehrmann,41 who emphasized the fundamental role of hyperandrogenism in disrupting follicular development through its impact on GC and TC functionality. Advancing beyond these foundational understandings, our investigation delves into the cellular architecture of the ovary at a single-cell resolution. This approach has unveiled specific subpopulations within GC and TC that are significantly impacted by androgen excess, thereby enriching the understanding of PCOS pathophysiology, which has traditionally centered on broader endocrine and metabolic disruptions.43
Notably, TC, integral to folliculogenesis and androgen production, is relatively less characterized than GC, especially regarding their behavior in PCOS-related ovarian dysfunction. While recent advancements in single-cell transcriptomics have facilitated the identification of three TC subgroups based on their gene expression profiles,15 of these studies have not explored the response of TC subpopulations to androgenic stimuli. Current research addresses this gap, documenting a pronounced expansion in the TC2 subset within PCOS ovaries. This observation suggests an adaptive response by TC cells to the hyperandrogenic environment for insights not previously documented in the literature.
In this investigation of PCOS, we detected significant metabolic reprogramming within GC and TC subsets, which manifest as shifts toward increased lipid metabolism and enhanced antioxidative defense mechanisms. This adaptation delineates the cellular strategies employed to navigate the hyperandrogenic milieu characteristic of PCOS. Specifically, the metabolic transformations noted in TC subsets underscore a profound connection between metabolic health and reproductive functionality within the PCOS context. The modifications in lipid metabolism, antioxidant defense, and energy metabolism pathways illustrate an adaptive modulation of TCs' metabolic profiles in response to androgen surplus. Such metabolic reprogramming is pivotal to the broader spectrum of metabolic dysregulation observed in PCOS, encompassing insulin resistance and dyslipidemia. Our elucidation of the specific metabolic pathways impacted in PCOS, particularly within TC subsets, extends the insights reported by Dumesic et al.,15 on the complex nexus between metabolic disturbances and reproductive dysfunction in PCOS. By delving deeper into the affected metabolic pathways, our research suggests that precise metabolic interventions could mitigate some symptoms of PCOS by rectifying the distorted metabolic activities in ovarian cells.
The present study highlights significant changes in cell communication within the PCOS ovarian microenvironment, especially between GC and TC, driven by the MK and PTN signaling pathways. These changes, likely an adaptive response to the hyperandrogenic environment, suggest a role in follicular dysfunction and cyst formation in PCOS. We have identified key disruptions in cell-cell communication, notably the upregulation of Ptn_Ncl and Mdk_Ncl pairs, pointing to potential therapeutic targets. Modulating these signaling pathways could correct PCOS’s cellular imbalances, indicating cell-based therapies as a direct strategy to tackle follicular dysfunction’s underlying causes. Our findings highlight the importance of intercellular communication and provide potential targets for PCOS treatment.
This research reveals systemic disruptions highlighted by changes in key steroidogenic gene expressions and serum hormone profiles, emphasizing the syndrome’s impact on hormonal balance. Notably, the upregulation of Cyp17a1, crucial for androgen synthesis, indicates thecal cell dysfunction, especially under elevated DHEA levels, suggesting a shift toward increased androgen and estrogen production. This shift underlines the hormonal imbalances defining PCOS and suggests rebalancing steroid hormone production as a therapeutic strategy. Using scRNA-seq, we offer insights into how GC and TC contribute to steroidogenesis dysregulation, identifying specific gene expression changes linked to hormonal imbalances.2,15 Our findings, which extend existing research, show elevated serum P4 levels in PCOS models despite reduced biosynthesis gene expression, possibly reflecting compensatory mechanisms or a disrupted regulatory environment. This underscores PCOS’s complexity, suggesting that serum hormone levels might not directly reflect ovarian cell activity but rather a broader endocrine disruption.
In conclusion, this study elucidates the cellular intricacies and dysregulation within the PCOS ovarian microenvironment, highlighting the critical impact of hyperandrogenism on granulosa and thecal cell subsets. The enhanced intercellular crosstalk, especially between TC2 and GC5 subsets through the MK and PTN pathways, provides important insights into the pathogenesis of PCOS. Identifying key ligand-receptor interactions offers potential therapeutic targets, suggesting avenues for targeted interventions to mitigate the cellular imbalances characteristic of PCOS. This research advances our understanding of PCOS at the cellular level, providing a foundation for developing precise treatments aimed at restoring ovarian function and improving reproductive health in affected women.
Limitations of the study
One limitation of our study is that although the PCOS-like mouse mimics important aspects of human PCOS, such as high androgen levels and lack of ovulation, it may not completely reflect the human conditions. However, our work does provide insight into the high androgen impact in the microenvironment by characterizing GC and TC subsets in the ovaries of PCOS, which sets the foundation for future studies to translate the observations into the human PCOS.
Resource availability
Lead contact
Further information and requests for resources and reagents should be directed to and will be fulfilled by the lead contact: Jianping Ye (yejianping@zzu.edu.cn).
Materials availability
This study did not generate new unique reagents.
Data and code availability
Data
The raw and processed data of scRNA-seq and spatial transcriptomics have been deposited in NCBI’s Gene Expression Omnibus (GEO) under accessory number GSE268919. The data will be publicly available as of the date of publication. Accession numbers are listed in the key resources table.
Code
This article does not report the original code.
Additional information
Any additional information required to reanalyze the data reported in this article is available from the lead contact upon request.
Acknowledgments
This research was funded by the Health Commission of Henan Province (LHGJ20210766) and Zhengzhou Central Hospital Affiliated to Zhengzhou University (KYQDJJ2021002).
Author contributions
M.L. and J.Y. contributed to the study in conception and experiment design; methodology, M.L, X.Y, M.Z, J.Z, and B.Y; data analysis, M.L., J.Z, and B.Y; Funding acquisition, M.L.; data collection, M.L, X.Y., M.Z, and H.L.; writing original draft, M.L.; writing review and editing, M.L., H.L., and J.Y. All authors read the article and approved the submission.
Declaration of interests
The authors declare no competing interests.
STAR★Methods
Key resources table
| REAGENT or RESOURCE | SOURCE | IDENTIFIER |
|---|---|---|
| Antibodies | ||
| Cyp17a1 | Abcam | Cat#T2829, RRID:AB_10704336 |
| Fst | Sigma-Aldrich | Cat# HPA018155, RRID:AB_1848999 |
| IL-17 | Proteintech | Cat# 13082-1-AP, RRID:AB_10644322 |
| TNF-α | Proteintech | Cat# 17590-1-AP, RRID:AB_2271853) |
| Lhcgr | Proteintech | Cat# 19968-1-AP RRID: N/A |
| Vegfa | Proteintech | Cat# 26157-1-AP, RRID:AB_2880408 |
| Srebf1 | Proteintech | Cat# 14088-1-AP, RRID:AB_2255217 |
| Hmgcr | Proteintech | Cat# 13533-1-AP, RRID:AB_2877957 |
| β-actin | Beyotime | Cat# AF0003, RRID:AB_2893353 |
| α-tubulin | Beyotime | Cat# AF2827, RRID:AB_3064710 |
| Goat anti-Rabbit IgG (H + L) Secondary Antibody, HRP | ThermoFisher | Catalog # 32460 |
| Biological samples | ||
| Mice ovary | This paper | N/A |
| Chemicals, peptides, and recombinant proteins | ||
| DHEA | LKT lab | D1629, Cas No. 53-43-0 |
| MACS Tissue Storage Solution | Miltenyi | Cas No.130-100-008 |
| Tissue-Tek O.C.T. Compound | SAKURA | Product code:4583 |
| DAPI | ThermoFisher | Catalog number: 62247 |
| Critical commercial assays | ||
| Mouse progesterone ELISA Kit | Cusabio | CSB-E05104m |
| Mouse testosterone ELISA Kit | Cusabio | CSB-E05101m |
| Mouse Estradiol ELISA Kit | Cusabio | CSB-E05109m |
| Mouse IL-17 ELISA Kit | Cusabio | CSB-E04608m |
| Mouse Estradiol ELISA Kit | Cusabio | CSB-E04741m |
| Deposited data | ||
| Raw and processed data | This paper | GEO: GSE268919 |
| Experimental models: Cell lines | ||
| Mouse: Granulosa cells | Procell | CM-M050 |
| Mouse: Thecal cells | Procell | CP-M205 |
| Experimental models: Organisms/strains | ||
| Mouse: ICR | Liaoning Changsheng Biotechnology Co., Ltd | NO.SCXK(Liao) 2020-0001 |
| Oligonucleotides | ||
| Il17a Forward (5′ to 3′): CTCCAGAAGGCCCTCAGA | This paper | N/A |
| Il17a Reverse (5′ to 3′): CTTTCCCTCCGCATTGACAC | This paper | N/A |
| Tnf Forward (5′ to 3′): CCCTCACACTCAGATCATCTTCT | This paper | N/A |
| Tnf Reverse (5′ to 3′): GCTACGACGTGGGCTACAG | This paper | N/A |
| Lhcgr Forward (5′ to 3′): TCTACCACTTCGTGCAGATG | This paper | N/A |
| Lhcgr Reverse (5′ to 3′): CACAGACTCAGTGGCTGTTG | This paper | N/A |
| Vegfa Forward (5′ to 3′): ATGAACTTTCTGCTGTCTTGG | This paper | N/A |
| Vegfa Reverse (5′ to 3′): TCACCGCCTCGGCTTGTCAC | This paper | N/A |
| Srebf1 Forward (5′ to 3′): GGAGCCATGGATTGCACATT | This paper | N/A |
| Srebf1 Reverse (5′ to 3′): GTCGGGTCACTGTCTTGGTG | This paper | N/A |
| Hmgcr Forward (5′ to 3′): GGAACACACGGACACCTACA | This paper | N/A |
| Hmgcr Reverse (5′ to 3′): CAGTGGTGGTGTTGGTGAAG | This paper | N/A |
| Star Forward (5′ to 3′): CCTCAGCACTCAGCATGTTCC | This paper | N/A |
| Star Reverse (5′ to 3′): GACGTCGAACTTGACCCATCC | This paper | N/A |
| Cyp11a1 Forward (5′ to 3′): AGTTCAGATGCCTGGAAGAAAGA | This paper | N/A |
| Cyp11a1 Reverse (5′ to 3′): ACTCAAAGGAAAAGCGGAATAGG | This paper | N/A |
| Hsd3b1 Forward (5′ to 3′): AGACCATCCTAGATGTCAATCTG | This paper | N/A |
| Hsd3b1 Reverse (5′ to 3′): TACTGCCTTCTCAGCCATCT | This paper | N/A |
| Cyp17a1 Forward (5′ to 3′): TGGAGGCCACTATCCGAGAA | This paper | N/A |
| Cyp17a1 Reverse (5′ to 3′): CACATGTGTGTCCTTCGGGA | This paper | N/A |
| Cyp19a1 Forward (5′ to 3′): TTGGAAGTGCCTGCAACTAC | This paper | N/A |
| Cyp19a1 Reverse (5′ to 3′): TTCTCCAAAGGCTCGGGTT | This paper | N/A |
| Gapdh Forward (5′ to 3′): AGAAACCTGCCAAGTATGATGAC | This paper | N/A |
| Gapdh Reverse (5′ to 3′): CCTGTTGCTGTAGCCGTATTC | This paper | N/A |
| β-actin Forward (5′to 3′): GGCTGTATTCCCCTCCATCG | This paper | N/A |
| β-actin Reverse (5′ to 3′): CCAGTTGGTAACAATGCCATGT | This paper | N/A |
| α-Tubulin Forward (5′ to 3′): AGTGTGACCAATGACGTGCTG | This paper | N/A |
| α-Tubulin Reverse (5′ to 3′): CGGGTGCTGAGAGACATTGG | This paper | N/A |
| Software and algorithms | ||
| GraphPad Prism 8 | GraphPad Software, San Diego, CA, USA | RRID:SCR_002798 |
| ImageJ | https://imagej.nih.gov/ij/download.html | RRID:SCR_003070 |
| CellRanger | 10× Genomics | RRID:SCR_023221 |
| SpaceRanger | 10× Genomics | RRID:SCR_023571 |
| DoubletFinder | https://github.com/chris-mcginnis-ucsf/DoubletFinder | RRID:SCR_018771 |
| Seurat | https://satijalab.org/seurat/get_started.html | RRID:SCR_016341 |
| Loupe Browser | 10× Genomics | RRID:SCR_018555 |
| Monocle2 | http://cole-trapnell-lab.github.io/monocle-release/docs/ | RRID:SCR_016339 |
| clusterProfiler | http://bioconductor.org/packages/release/bioc/html/clusterProfiler.html | RRID:SCR_016884 |
| ggplot2 | https://cran.r-project.org/web/packages/ggplot2/index.html | RRID:SCR_014601 |
| CellChat | https://github.com/sqjin/CellChat | RRID:SCR_021946 |
| CellphoneDB | https://www.cellphonedb.org/ | RRID:SCR_017054 |
| scMetabolism | https://github.com/wu-yc/scMetabolism | N/A |
| AddModuleScore | https://github.com/WalterMuskovic/AddModuleScore | N/A |
| AUCell | https://bioconductor.org/packages/AUCell/ | RRID:SCR_021327 |
| IBM SPSS Statistics | https://www.ibm.com/products/spss-statistics | RRID:SCR_016479 |
Experimental model and study participant details
PCOS-like mice were generated by subcutaneous administration of DHEA into 25-day-old female ICR mice purchased from Liaoning Changsheng Biotechnology Co., Ltd as reported.25,26 Female mice were used in this study as male mice can’t be used in the PCOS model. The DHEA was dissolved in sesame oil at 10% by volume in 95% ethanol, and was administrated in each mouse of model group (n = 9) at 6 mg/100 g of body weight in 0.1 mL once a day over a period of 20 days according to the established protocol.26 The control mice (n = 9) were injected with vehicle in the same way. The mice were housed under a pathogen-free condition with a 12-h light/dark cycle, free access to food and water. All experimental procedures involving animals were approved by the Institutional Animal Care and Use Committee (IACUC) of Zhengzhou Central Hospital Affiliated to Zhengzhou University (202224). GC and TC were obtained from Procell and cultured in their respective complete media (Procell). The GCs were identified through immunofluorescence staining for FSHR, while TCs were verified by staining for 3β-HSD. Both cell types were confirmed to be free of mycoplasma contaminants.
Method details
Single-cell RNA-Sequencing and library preparation
We used 10× Genomics technology to perform scRNA-seq, to probe gene expression at the individual cell level, as shown in Figure 1A. Ovarian tissues from one side of female mouse was collected and and stored in MACS Tissue Storage Solution (Miltenyi) for transport to OE Biotech Co., Ltd. (Shanghai) within 48 h of collection. Each ovarian sample was used in preparation of individual single-cell library using the 10× Genomics platform at 3 samples/group (n = 3). Initially, tissue samples were carefully processed to yield single-cell suspensions. Subsequently, employing 10× Genomics’ GEMs technology, cells were individually encapsulated with barcoded gel beads, each bearing a cell-specific barcode and UMI. Within these GEMs, cellular mRNA was captured and efficiently transformed into cDNA through reverse transcription, with each resulting cDNA molecule retaining its corresponding cell’s barcode and UMI information. Following this, library preparation involved cDNA amplification and the addition of essential sequencing adapters to prepare the cDNA for high-throughput sequencing. High-throughput sequencing was performed using an Illumina platform, yielding comprehensive gene expression profiles for every individual cell.
Spatial transcriptomics
The 10× Genomics Spatial Transcriptomics technology was employed to create comprehensive gene expression maps within complete tissue sections, providing valuable insights into cellular spatial organization and functionality. In this study, one side of fresh ovarian samples of mice underwent a meticulous process. The ovarian samples (n = 3) were initially embedded in Tissue-Tek O.C.T. Compound (SAKURA) and sliced into sections with a thickness of 10 μm using a Leica CM1950 cryostat (Leica Biosystems). These sections were then carefully mounted onto 10× Genomics visium slides. On the Visium slides, the sections underwent a series of essential procedures. They were first subjected to fixation, followed by H&E staining to visualize tissue morphology, and permeabilization to prepare them for subsequent steps. This strategic preparation facilitated the efficient release of mRNA from the tissue, allowing it to hybridize with capture probes for in situ reverse transcription. This incorporation of spatial barcodes into the resulting cDNA molecules enabled precise localization of gene expression patterns. Finally, Illumina sequencing was performed to generate comprehensive spatially resolved gene expression data.
Immunofluorescence
Ovarian tissues were embedded in Tissue-Tek O.C.T. Compound (SAKURA) and sectioned at 6 μm in thickness. The tissue sections were fixed in cold 4% paraformaldehyde PBS for 10 min, washed with PBS, and then incubated in blocking buffer (1% BSA, 0.1% Triton X-100, and 0.1% sodium azide in PBS) for 1 h at room temperature. Primary antibodies including anti-Cyp17a1 (1:100, Abcam) and anti-Fst (1:100, Sigma-Aldrich) were incubated in the blocking buffer over night at 4°C. The samples were washed in PBS and incubated with secondary antibodies goat anti-immunoglobulin G (1:500, ThermoFisher) in the next day. Finally, sections were treated with 4′,6-diamidino-2-phenylindole (DAPI, 1:1000, ThermoFisher) for nuclear visualization. Immunofluorescent imaging was performed on a fluorescence microscope (Nikon).
Immunohistochemistry
Paraffin-embedded ovarian tissues were sectioned at 4 μm and processed for immunohistochemical analysis. After deparaffinization and rehydration, antigen retrieval was performed by heating the sections in citrate buffer (pH 6.0) for 20 min. The sections were then cooled, washed with PBS, and blocked with 1% BSA in PBS for 1 h at room temperature. The sections were then incubated overnight at 4°C with a primary antibody against Lhcgr (1:500, Proteintech). The next day, the samples were washed in PBS and incubated with a biotinylated secondary antibody (1:500, ThermoFisher) for 1 h. Signal amplification was achieved using the avidin-biotin complex (ABC) method, with diaminobenzidine (DAB) as the chromogen. Finally, the sections were counterstained with hematoxylin, dehydrated, and mounted. Imaging was conducted using a bright-field microscope (Nikon).
Identification of differentially expressed genes
To identify specific markers for each cellular subset, we employed the 'Findallmarker' function of Seurat (Version 4.4.0). This process involved selecting genes that were expressed in more than 10% of the cells within a given cluster and exhibited a log2 fold change greater than 0.25 when comparing one cluster to others. Following this criterion, we also pinpointed subpopulation-specific markers utilizing a similar analytical approach.
Gene functional enrichment analysis
Gene ontology and pathway enrichment analysis were performed using the clusterProfiler package (Version 4.8.2) in R. For Gene Set Enrichment Analysis (GSEA), we ranked genes based on differential expression and conducted the analysis using the GSEA function in clusterProfiler. Significance was assessed via permutation tests and adjusted using the Benjamini-Hochberg method. Results, including enrichment plots, were visualized using ggplot2.
Cell‒cell communication analysis
To evaluate the variances in cellular communication across different cell groups, we employed an integrative approach using gene expression data via CellChat (version 1.0.0). In this process, the CellphoneDB, set as default, served as our primary database for ligand-receptor pairs. Our analysis focused on identifying cell group-specific communication patterns by pinpointing ligands or receptors that were significantly overexpressed in certain cell populations, leading to enhanced ligand-receptor interaction dynamics. Subsequently, we applied CellphoneDB (version 3.0) for a more detailed ligand-receptor interaction analysis. This step involved calculating the mean expression levels of ligand-receptor pairs between various cell types, considering only those genes that were expressed in at least 10% of cells for each type. We adhered to CellphoneDB’s standard analysis protocols (available at https://github.com/ventolab/CellphoneDB) to pinpoint significant ligand-receptor interactions across all cell pairs. Our criteria for significance included ligand-receptor pairs with a p-value lower than 0.001 and an average expression level exceeding 0.2.
Analysis of metabolic pathways
The scMetabolism toolkit (Version 0.2.1), a specialized R package, was utilized for assessing cellular metabolic activities on a single-cell scale. This tool facilitated the analysis of the engagement of KEGG metabolic pathways within individual cells. For each cell cluster, the collective metabolic pathway activities were quantified and represented through an average activity scoring system, offering a detailed view of the metabolic landscape at the cellular level.
Gene sets scoring
For gene set scoring, we implemented the AddModuleScore and AUCell algorithms. The AddModuleScore approach involves calculating the average expression of genes within a set and segmenting the expression matrix based on this mean value. Control genes are then sampled from each segment to provide comparative background values. On the other hand, the AUCell algorithm assesses the enrichment of a specified gene set within the top 5% of expressed genes in each sample, based on their expression rankings. The distribution of Area Under the Curve (AUC) scores across the cellular population allows for an analysis of relative gene expression features. Notably, the rank-based nature of the AUCell algorithm ensures that its analysis is unaffected by variations in gene expression units and the normalization methods employed.
Quantitative real-time PCR
Total ovarian RNA was extracted and reverse-transcribed into cDNA, facilitating the amplification and quantification of critical gene expression levels. The focus was on genes pivotal to ovarian function and steroidogenesis, including steroidogenic acute regulatory protein (Star), hydroxy-delta-5-steroid dehydrogenase, 3 beta- and steroid delta-isomerase 1 (Hsd3b1), cytochrome P450 family 11 subfamily a member 1 (Cyp11a1), cytochrome P450, family 17, subfamily a, polypeptide 1 (Cyp17a1), cytochrome P450 family 19 subfamily a member 1 (Cyp19a1), interleukin 17a (Il17a), tumor necrosis factor (Tnf), luteinizing hormone receptor (Lhcgr), vascular endothelial growth factor a (Vegfa), sterol regulatory element-binding protein 1 (Srebf1), 3-hydroxy-3-methylglutaryl-coA reductase (Hmgcr), alpha tubulin (α-Tubulin), and beta actin (β-Actin). The primer sequences were listed in the key resources table. After analysis using the 2−ΔΔCt method, data were normalized to Gapdh expression.
Cell culture, Co-culture system and cell treatment
GC and TC were incubated at 37°C with 5% CO2. The media were changed every 48 h. For the co-culture experiments, a Transwell plate system (Corning) with a pore size of 0.4 μm was used. GCs (1 × 10⁵ cells/well) were seeded in the lower chamber, and TCs (1 × 10⁵ cells/well) were seeded in the insert. The co-culture was maintained in DMEM/F12 medium supplemented with 10% FBS, 100 IU/mL penicillin, and 100 μg/mL streptomycin at 37°C with 5% CO2. After 24 h of co-culture, the cell cultures were treated with DHEA (100 μM) dissolved in DMSO for 12 h. Control cultures received equivalent volumes of the solvent without DHEA. In addition to the co-culture experiments, both cell types were individually treated with DHEA (100 μM dissolved in DMSO) for 12 h. The control cultures were treated with equivalent volumes of DMSO without DHEA.
Hormonal assays and quantification of Ptn and Mdk levels
Blood samples were obtained via orbital puncture, and the serum was subsequently separated for the quantification of progesterone (P4), testosterone (T), and estradiol (E2) concentrations. For the assessment of Ptn and Mdk levels, culture media were harvested from both the co-culture systems and from the individual GC and TC cultures following DHEA treatment. Quantitative analysis of these substances was conducted using specific ELISA kits (Cusabio), adhering to the protocols provided by the manufacturer.
Quantification and statistical analysis
Data processing and analysis
Reference genome data (GRCm38/mm10) were sourced from UCSC Genome Browser (https://genome.ucsc.edu).44 CellRanger and SpaceRanger were utilized in processing and aligning single-cell and spatial transcriptomic data. For scRNA-seq, the analysis included six samples, with high-quality cell counts ranging from 8,319 to 13,199 per sample as determined by Cell Ranger quantification. After stringent quality control, including filtering out doublets, multiplets, and apoptotic cells, the final number of cells retained per sample ranged from 6,855 to 9,543. Cells were retained based on having gene and UMI counts within the median ±2 times the median absolute deviation and a mitochondrial UMI percentage below 15%. Doublets were identified and removed using DoubletFinder, ensuring high-quality data for downstream analysis. Normalization, variable gene identification, Principal Component Analysis, and clustering analyses were performed using Seurat (Version 4.4.0). UMAP was first used to visualize the data across all samples to assess potential separation between batches. Upon identifying minor batch effects, Seurat’s Anchor-Based Integration method was applied, utilizing the “FindIntegrationAnchors” and “IntegrateData” functions. This approach effectively mitigated batch effects while preserving the biological differences between cell populations. After adjustment, UMAP visualization was re-performed to confirm that the batch effects had been successfully eliminated, ensuring that the clustering of subtypes was primarily based on biological differences rather than technical artifacts. UMAP was also used for visualization of cell type distribution and relationships. For spatial transcriptomics, data normalization and visualization were conducted in the Seurat environment, aligned with H&E images using Loupe Browser software.
Statistical analysis
Each in vitro experiment was repeated independently three times at least with consistent results. The results are expressed as mean ± standard deviation (SD). In the statistical analysis, we employed the Student’s t test, using the SPSS 13.0 software. A p-value of less than 0.05 is considered as statistical significance. The exact sample size (n) is indicated in each relevant figure legend.
Additional resources
This study did not generate additional data.
Published: September 24, 2024
Contributor Information
Man Luo, Email: luomanzz@zzu.edu.cn.
Jianping Ye, Email: yejianping@zzu.edu.cn.
References
- 1.Goodarzi M.O., Dumesic D.A., Chazenbalk G., Azziz R. Polycystic ovary syndrome: etiology, pathogenesis and diagnosis. Nat. Rev. Endocrinol. 2011;7:219–231. doi: 10.1038/nrendo.2010.217. [DOI] [PubMed] [Google Scholar]
- 2.Huang-Doran I., Kinzer A.B., Jimenez-Linan M., Thackray K., Harris J., Adams C.L., de Kerdanet M., Stears A., O'Rahilly S., Savage D.B., et al. Ovarian Hyperandrogenism and Response to Gonadotropin-releasing Hormone Analogues in Primary Severe Insulin Resistance. J. Clin. Endocrinol. Metab. 2021;106:2367–2383. doi: 10.1210/clinem/dgab275. [DOI] [PMC free article] [PubMed] [Google Scholar]
- 3.Gao L., Zhao Y., Wu H., Lin X., Guo F., Li J., Long Y., Zhou B., She J., Zhang C., et al. Polycystic Ovary Syndrome Fuels Cardiovascular Inflammation and Aggravates Ischemic Cardiac Injury. Circulation. 2023;148:1958–1973. doi: 10.1161/circulationaha.123.065827. [DOI] [PMC free article] [PubMed] [Google Scholar]
- 4.Hatziagelaki E., Pergialiotis V., Kannenberg J.M., Trakakis E., Tsiavou A., Markgraf D.F., Carstensen-Kirberg M., Pacini G., Roden M., Dimitriadis G., Herder C. Association between Biomarkers of Low-grade Inflammation and Sex Hormones in Women with Polycystic Ovary Syndrome. Exp. Clin. Endocrinol. Diabetes. 2020;128:723–730. doi: 10.1055/a-0992-9114. [DOI] [PubMed] [Google Scholar]
- 5.Möhlig M., Spranger J., Osterhoff M., Ristow M., Pfeiffer A.F.H., Schill T., Schlösser H.W., Brabant G., Schöfl C. The polycystic ovary syndrome per se is not associated with increased chronic inflammation. Eur. J. Endocrinol. 2004;150:525–532. doi: 10.1530/eje.0.1500525. [DOI] [PubMed] [Google Scholar]
- 6.Nohara K., Waraich R.S., Liu S., Ferron M., Waget A., Meyers M.S., Karsenty G., Burcelin R., Mauvais-Jarvis F. Developmental androgen excess programs sympathetic tone and adipose tissue dysfunction and predisposes to a cardiometabolic syndrome in female mice. Am. J. Physiol. Endocrinol. Metab. 2013;304:E1321–E1330. doi: 10.1152/ajpendo.00620.2012. [DOI] [PMC free article] [PubMed] [Google Scholar]
- 7.Palomba S., de Wilde M.A., Falbo A., Koster M.P.H., La Sala G.B., Fauser B.C.J.M. Pregnancy complications in women with polycystic ovary syndrome. Hum. Reprod. Update. 2015;21:575–592. doi: 10.1093/humupd/dmv029. [DOI] [PubMed] [Google Scholar]
- 8.Morford J.J., Wu S., Mauvais-Jarvis F. The impact of androgen actions in neurons on metabolic health and disease. Mol. Cell. Endocrinol. 2018;465:92–102. doi: 10.1016/j.mce.2017.09.001. [DOI] [PMC free article] [PubMed] [Google Scholar]
- 9.Wilson J.L., Chen W., Dissen G.A., Ojeda S.R., Cowley M.A., Garcia-Rudaz C., Enriori P.J. Excess of nerve growth factor in the ovary causes a polycystic ovary-like syndrome in mice, which closely resembles both reproductive and metabolic aspects of the human syndrome. Endocrinology. 2014;155:4494–4506. doi: 10.1210/en.2014-1368. [DOI] [PMC free article] [PubMed] [Google Scholar]
- 10.Andrisse S., Feng M., Wang Z., Awe O., Yu L., Zhang H., Bi S., Wang H., Li L., Joseph S., et al. Androgen-induced insulin resistance is ameliorated by deletion of hepatic androgen receptor in females. FASEB J. 2021;35 doi: 10.1096/fj.202100961R. [DOI] [PMC free article] [PubMed] [Google Scholar]
- 11.Lim S., Takele W.W., Vesco K.K., Redman L.M., Hannah W., Bonham M.P., Chen M., Chivers S.C., Fawcett A.J., Grieger J.A., et al. Participant characteristics in the prevention of gestational diabetes as evidence for precision medicine: a systematic review and meta-analysis. Commun. Med. 2023;3:137. doi: 10.1038/s43856-023-00366-x. [DOI] [PMC free article] [PubMed] [Google Scholar]
- 12.Mauvais-Jarvis F. Developmental androgenization programs metabolic dysfunction in adult mice: Clinical implications. Adipocyte. 2014;3:151–154. doi: 10.4161/adip.27746. [DOI] [PMC free article] [PubMed] [Google Scholar]
- 13.Caldwell A.S.L., Middleton L.J., Jimenez M., Desai R., McMahon A.C., Allan C.M., Handelsman D.J., Walters K.A. Characterization of reproductive, metabolic, and endocrine features of polycystic ovary syndrome in female hyperandrogenic mouse models. Endocrinology. 2014;155:3146–3159. doi: 10.1210/en.2014-1196. [DOI] [PubMed] [Google Scholar]
- 14.Azziz R., Carmina E., Chen Z., Dunaif A., Laven J.S.E., Legro R.S., Lizneva D., Natterson-Horowtiz B., Teede H.J., Yildiz B.O. Polycystic ovary syndrome. Nat. Rev. Dis. Prim. 2016;2 doi: 10.1038/nrdp.2016.57. [DOI] [PubMed] [Google Scholar]
- 15.Dumesic D.A., Oberfield S.E., Stener-Victorin E., Marshall J.C., Laven J.S., Legro R.S. Scientific Statement on the Diagnostic Criteria, Epidemiology, Pathophysiology, and Molecular Genetics of Polycystic Ovary Syndrome. Endocr. Rev. 2015;36:487–525. doi: 10.1210/er.2015-1018. [DOI] [PMC free article] [PubMed] [Google Scholar]
- 16.Liao B., Qi X., Yun C., Qiao J., Pang Y. Effects of Androgen Excess-Related Metabolic Disturbances on Granulosa Cell Function and Follicular Development. Front. Endocrinol. 2022;13 doi: 10.3389/fendo.2022.815968. [DOI] [PMC free article] [PubMed] [Google Scholar]
- 17.Jiang Y., Gao X., Liu Y., Yan X., Shi H., Zhao R., Chen Z.J., Gao F., Zhao H., Zhao S. Cellular atlases of ovarian microenvironment alterations by diet and genetically-induced obesity. Sci. China Life Sci. 2024;67:51–66. doi: 10.1007/s11427-023-2360-3. [DOI] [PubMed] [Google Scholar]
- 18.Wang S., Zheng Y., Li J., Yu Y., Zhang W., Song M., Liu Z., Min Z., Hu H., Jing Y., et al. Single-Cell Transcriptomic Atlas of Primate Ovarian Aging. Cell. 2020;180:585–600.e19. doi: 10.1016/j.cell.2020.01.009. [DOI] [PubMed] [Google Scholar]
- 19.Garcia-Alonso L., Lorenzi V., Mazzeo C.I., Alves-Lopes J.P., Roberts K., Sancho-Serra C., Engelbert J., Marečková M., Gruhn W.H., Botting R.A., et al. Single-cell roadmap of human gonadal development. Nature. 2022;607:540–547. doi: 10.1038/s41586-022-04918-4. [DOI] [PMC free article] [PubMed] [Google Scholar]
- 20.Shi Y., Guo Y., Zhou J., Cui G., Cheng J.C., Wu Y., Zhao Y.L., Fang L., Han X., Yang Y.G., Sun Y. A spatiotemporal gene expression and cell atlases of the developing rat ovary. Cell Prolif. 2023;56 doi: 10.1111/cpr.13516. [DOI] [PMC free article] [PubMed] [Google Scholar]
- 21.Franzén O., Gan L.M., Björkegren J.L.M. PanglaoDB: a web server for exploration of mouse and human single-cell RNA sequencing data. Database. 2019;2019 doi: 10.1093/database/baz046. [DOI] [PMC free article] [PubMed] [Google Scholar]
- 22.Han X., Wang R., Zhou Y., Fei L., Sun H., Lai S., Saadatpour A., Zhou Z., Chen H., Ye F., et al. Mapping the Mouse Cell Atlas by Microwell-Seq. Cell. 2018;172:1091–1107.e17. doi: 10.1016/j.cell.2018.02.001. [DOI] [PubMed] [Google Scholar]
- 23.Fei L., Chen H., Ma L., E W., Wang R., Fang X., Zhou Z., Sun H., Wang J., Jiang M., et al. Systematic identification of cell-fate regulatory programs using a single-cell atlas of mouse development. Nat. Genet. 2022;54:1051–1061. doi: 10.1038/s41588-022-01118-8. [DOI] [PubMed] [Google Scholar]
- 24.Wang R., Zhang P., Wang J., Ma L., E W., Suo S., Jiang M., Li J., Chen H., Sun H., et al. Construction of a cross-species cell landscape at single-cell level. Nucleic Acids Res. 2023;51:501–516. doi: 10.1093/nar/gkac633. [DOI] [PMC free article] [PubMed] [Google Scholar]
- 25.Luo M., Huang J.C., Yang Z.Q., Wang Y.S., Guo B., Yue Z.P. Hydroxysafflor yellow A exerts beneficial effects by restoring hormone secretion and alleviating oxidative stress in polycystic ovary syndrome mice. Exp. Physiol. 2020;105:282–292. doi: 10.1113/ep088147. [DOI] [PubMed] [Google Scholar]
- 26.Luo M., Zheng L.W., Wang Y.S., Huang J.C., Yang Z.Q., Yue Z.P., Guo B. Genistein exhibits therapeutic potential for PCOS mice via the ER-Nrf2-Foxo1-ROS pathway. Food Funct. 2021;12:8800–8811. doi: 10.1039/d1fo00684c. [DOI] [PubMed] [Google Scholar]
- 27.Fan X., Bialecka M., Moustakas I., Lam E., Torrens-Juaneda V., Borggreven N.V., Trouw L., Louwe L.A., Pilgram G.S.K., Mei H., et al. Single-cell reconstruction of follicular remodeling in the human adult ovary. Nat. Commun. 2019;10:3164. doi: 10.1038/s41467-019-11036-9. [DOI] [PMC free article] [PubMed] [Google Scholar]
- 28.Wang J.J., Ge W., Zhai Q.Y., Liu J.C., Sun X.W., Liu W.X., Li L., Lei C.Z., Dyce P.W., De Felici M., Shen W. Single-cell transcriptome landscape of ovarian cells during primordial follicle assembly in mice. PLoS Biol. 2020;18 doi: 10.1371/journal.pbio.3001025. [DOI] [PMC free article] [PubMed] [Google Scholar]
- 29.Friedman J.M. Leptin and the endocrine control of energy balance. Nat. Metab. 2019;1:754–764. doi: 10.1038/s42255-019-0095-y. [DOI] [PubMed] [Google Scholar]
- 30.Rudnicka E., Suchta K., Grymowicz M., Calik-Ksepka A., Smolarczyk K., Duszewska A.M., Smolarczyk R., Meczekalski B. Chronic Low Grade Inflammation in Pathogenesis of PCOS. Int. J. Mol. Sci. 2021;22 doi: 10.3390/ijms22073789. [DOI] [PMC free article] [PubMed] [Google Scholar]
- 31.Armanini D., Boscaro M., Bordin L., Sabbadin C. Controversies in the Pathogenesis, Diagnosis and Treatment of PCOS: Focus on Insulin Resistance, Inflammation, and Hyperandrogenism. Int. J. Mol. Sci. 2022;23 doi: 10.3390/ijms23084110. [DOI] [PMC free article] [PubMed] [Google Scholar]
- 32.Lai Y., Ye Z., Mu L., Zhang Y., Long X., Zhang C., Li R., Zhao Y., Qiao J. Elevated Levels of Follicular Fatty Acids Induce Ovarian Inflammation via ERK1/2 and Inflammasome Activation in PCOS. J. Clin. Endocrinol. Metab. 2022;107:2307–2317. doi: 10.1210/clinem/dgac281. [DOI] [PubMed] [Google Scholar]
- 33.Dabravolski S.A., Nikiforov N.G., Eid A.H., Nedosugova L.V., Starodubova A.V., Popkova T.V., Bezsonov E.E., Orekhov A.N. Mitochondrial Dysfunction and Chronic Inflammation in Polycystic Ovary Syndrome. Int. J. Mol. Sci. 2021;22 doi: 10.3390/ijms22083923. [DOI] [PMC free article] [PubMed] [Google Scholar]
- 34.Qi X., Yun C., Sun L., Xia J., Wu Q., Wang Y., Wang L., Zhang Y., Liang X., Wang L., et al. Gut microbiota-bile acid-interleukin-22 axis orchestrates polycystic ovary syndrome. Nat. Med. 2019;25:1225–1233. doi: 10.1038/s41591-019-0509-0. [DOI] [PMC free article] [PubMed] [Google Scholar]
- 35.Taraborrelli S. Physiology, production and action of progesterone. Acta Obstet. Gynecol. Scand. 2015;94:8–16. doi: 10.1111/aogs.12771. [DOI] [PubMed] [Google Scholar]
- 36.Steegers-Theunissen R.P.M., Wiegel R.E., Jansen P.W., Laven J.S.E., Sinclair K.D. Polycystic Ovary Syndrome: A Brain Disorder Characterized by Eating Problems Originating during Puberty and Adolescence. Int. J. Mol. Sci. 2020;21 doi: 10.3390/ijms21218211. [DOI] [PMC free article] [PubMed] [Google Scholar]
- 37.Koysombat K., Dhillo W.S., Abbara A. Assessing hypothalamic pituitary gonadal function in reproductive disorders. Clin. Sci. 2023;137:863–879. doi: 10.1042/cs20220146. [DOI] [PMC free article] [PubMed] [Google Scholar]
- 38.Tang R., Ding X., Zhu J. Kisspeptin and Polycystic Ovary Syndrome. Front. Endocrinol. 2019;10:298. doi: 10.3389/fendo.2019.00298. [DOI] [PMC free article] [PubMed] [Google Scholar]
- 39.Payne A.H., Hales D.B. Overview of steroidogenic enzymes in the pathway from cholesterol to active steroid hormones. Endocr. Rev. 2004;25:947–970. doi: 10.1210/er.2003-0030. [DOI] [PubMed] [Google Scholar]
- 40.Miller W.L., Auchus R.J. The molecular biology, biochemistry, and physiology of human steroidogenesis and its disorders. Endocr. Rev. 2011;32:81–151. doi: 10.1210/er.2010-0013. [DOI] [PMC free article] [PubMed] [Google Scholar]
- 41.Rosenfield R.L., Ehrmann D.A. The Pathogenesis of Polycystic Ovary Syndrome (PCOS): The Hypothesis of PCOS as Functional Ovarian Hyperandrogenism Revisited. Endocr. Rev. 2016;37:467–520. doi: 10.1210/er.2015-1104. [DOI] [PMC free article] [PubMed] [Google Scholar]
- 42.Glueck C.J., Goldenberg N. Characteristics of obesity in polycystic ovary syndrome: Etiology, treatment, and genetics. Metabolism. 2019;92:108–120. doi: 10.1016/j.metabol.2018.11.002. [DOI] [PubMed] [Google Scholar]
- 43.Escobar-Morreale H.F. Polycystic ovary syndrome: definition, aetiology, diagnosis and treatment. Nat. Rev. Endocrinol. 2018;14:270–284. doi: 10.1038/nrendo.2018.24. [DOI] [PubMed] [Google Scholar]
- 44.Nassar L.R., Barber G.P., Benet-Pagès A., Casper J., Clawson H., Diekhans M., Fischer C., Gonzalez J.N., Hinrichs A.S., Lee B.T., et al. The UCSC Genome Browser database: 2023 update. Nucleic Acids Res. 2023;51:D1188–D1195. doi: 10.1093/nar/gkac1072. [DOI] [PMC free article] [PubMed] [Google Scholar]
Associated Data
This section collects any data citations, data availability statements, or supplementary materials included in this article.
Data Availability Statement
Data
The raw and processed data of scRNA-seq and spatial transcriptomics have been deposited in NCBI’s Gene Expression Omnibus (GEO) under accessory number GSE268919. The data will be publicly available as of the date of publication. Accession numbers are listed in the key resources table.
Code
This article does not report the original code.
Additional information
Any additional information required to reanalyze the data reported in this article is available from the lead contact upon request.