Abstract
Purpose
Cardiovascular disorders are the leading cause of mortality worldwide with obstructive sleep apnea (OSA) as the independent risk factor. Heart sounds are strong modalities to obtain clinically relevant information regarding the functioning of the heart valves and blood flow. The objective of this study was to use a small wearable device to record and investigate the changes in heart sounds during respiratory events (reduction and cessation of breathings) and their association with oxyhemoglobin desaturation (hypoxemia).
Patients and Methods
Sleep assessment and tracheal respiratory and heart sounds were recorded simultaneously from 58 individuals who were suspected of having OSA. Sleep assessment was performed using in-laboratory polysomnography. Tracheal respiratory and heart sounds were recorded over the suprasternal notch using a small device with embedded microphone and accelerometer called the Patch. Heart sounds were extracted from bandpass filtered tracheal sounds using smoothed Hilbert envelope on decomposed signal. For each individual, data from 20 obstructive events during Non-Rapid Eye Movement stage-2 of sleep were randomly selected for analysis.
Results
A significant increase in heart sounds’ intensities from before to after the termination of respiratory events was observed. Also, there was a significant positive correlation between the magnitude of hypoxemia and the increase in heart sounds’ intensities (r>0.82, p<0.001). In addition, the changes in heart sounds were significantly correlated with heart rate and blood pressure.
Conclusion
Our results indicate that heart sound analysis can be used as an alternative modality for assessing the cardiovascular burden of sleep apnea, which may indicate the risk of cardiovascular disorders.
Keywords: heart sounds, obstructive sleep apnea, sympathetic nervous activity, hypoxemia, blood pressure
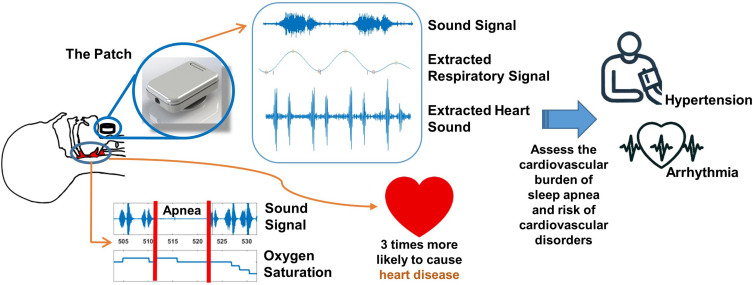
Graphical Abstract
Introduction
Cardiovascular disorders are the leading cause of mortality and morbidity worldwide1 with obstructive sleep apnea (OSA) being an independent risk factor.2,3 OSA is a common breathing disorder marked by recurring episodes of breath cessation (apnea) or reduction (hypopnea) during sleep, resulting from complete or partial closure of the pharyngeal airway. The prevalence of OSA in patients with hypertension and congestive heart failure are 35%4 and 80%,5 respectively, exceeding the 10% prevalence in general population.6
OSA adversely impacts the autonomic nervous system, altering heart rate regulation due to increased activity of the sympathetic nervous system.7,8 Other factors contributing to the cardiovascular consequences of OSA include heightened negative intrathoracic pressure during apneas and hypopneas, increased sympathetic nervous system activity caused by oxyhemoglobin desaturation (hypoxemia),9 and the resulting spikes in blood pressure and heart rate at the termination of these episodes.10
The response of the cardiovascular system to individual respiratory events during sleep is affected by several factors such as associated hypoxemia, presence of arousals, and the frequency of apneas and hypopneas per hour of sleep known as the apnea-hypopnea index (AHI).11 Higher AHI is known to be associated with increased risk of cardiovascular disease. Moreover, the hypoxic burden, which quantifies the area under the curve of overnight oxygen desaturations that are associated with sleep apnea has been shown to predict cardiovascular events and mortality in patients with OSA.12,13 However, the AHI alone lacks sufficient sensitivity and specificity to predict cardiovascular events14 while the hypoxic burden is unable to distinguish between various patterns of hypoxic stress.12 The current technologies for monitoring cardiac condition such as electrocardiogram (ECG), oxyhemoglobin saturation (SaO2), or continuous blood pressure monitoring systems (such as Finapres) primarily provide information about electrical activity of the heart, oxygenation status, or information on systemic perfusion. However, they are unable to comprehensively capture the mechanical aspects of cardiac activity, which is important to detect early valvular abnormalities, and its response to apneas and hypopneas. Therefore, there is a need for an alternate metric or tool that can be useful in assessing and predicting the pathophysiology of cardiovascular diseases in individuals with OSA.12,14
Heart sounds (S1 and S2) provide clinically relevant insights into heart valve function and blood flow dynamics. The first heart sounds, S1, results from the closure of the mitral and tricuspid valves at the onset of isovolumetric ventricular contraction. Meanwhile, the second heart sound, S2, is generated by the closure of the aortic and pulmonic valves at the start of isovolumetric ventricular relaxation. In our proof-of-concept study (Appendix 1), we showed that the changes in heart sound intensities were correlated with the changes in systolic and diastolic blood pressures (Supplementary Figure 1A–C). Moreover, earlier research indicates that accurately identifying each component of heart sounds yields valuable insights for predicting cardiovascular disorders.15–17 Crucially, heart sounds can be continuously and easily recorded using a microphone placed on the chest or neck, causing minimal discomfort to the participants. Although heart sounds have clear potential for assessing cardiovascular disorder pathology, no convenient tool currently exists to monitor the cardiovascular effects of OSA during sleep based on heart sounds. Therefore, the goal of this study was to investigate the potential of a device developed in our lab based on heart sounds in assessing the cardiovascular consequences of OSA during sleep. To achieve this goal, our objectives were 1) to develop a technique to extract heart sounds from the recorded sounds in the presence of noise such as snoring and 2) to investigate the effects of apneas and hypopneas on the intensities of heart sounds S1 (HSIS1) and S2 (HSIS2) compared to normal breathing.
We hypothesized that, from pre-termination to post-termination of respiratory events, there would be increases in HSIS1 and HSIS2. In addition, we hypothesized that the changes in HSIS1 and HSIS2 from pre-termination to post-termination of respiratory events were correlated with the magnitude of physiological derangement such as hypoxemia during the events and changes in heart rate and blood pressure.
Materials and Methods
This was a prospective observational cohort study. The study complies with the Declaration of Helsinki and was approved by the research ethics board of the University Health Network. All participants were fully informed about the purpose of the study and signed written consent prior to participation in the study.
Participants
Participants of 18 years and older with suspected OSA who were referred to the sleep laboratory of Toronto Rehabilitation Institute18 for overnight PSG were recruited for this study. Participants whose skin was sensitive to medical tapes were excluded. In addition, we had the following exclusion criteria for the data analysis: 1) participants with low quality data (signal to noise ratio below 20 for acoustic data), 2) participants with no OSA who had less than 5 obstructive respiratory events during Non-Rapid Eye Movement stage-2 (N2) due to insufficient data for a meaningful analysis, 3) participants with no hypoxemia during sleep (no drops in SaO2 of at least 3%), and 4) participants who had atrial fibrillation on the night of the study as the irregular rhythm can disrupt the characteristics of heart sounds that would make it difficult to interpret the results.
Data Acquisition
Overnight Polysomnography (PSG)
A comprehensive overnight PSG was conducted using Embla® N7000/S4500 (Natus Medical Incorporated, USA). The PSG recorded cardiac function (ECG), brain activity (electroencephalogram, EEG), muscle activity (electromyogram, EMG), respiration (chest and abdominal respiratory inductance plethysmography), airflow (nasal pressure cannula), and blood oxygen saturation (SaO2 via pulse oximetry). Apneas, hypopneas, sleep stages, and arousals were identified and scored according to the American Academy of Sleep Medicine guidelines.19 Apneas were defined as a reductions in airflow or abdominal and chest movement of over 90% for at least 10 seconds. Hypopneas were classified as a reduction in airflow or abdominal and chest movement of over 30% for more than 10 seconds, accompanied by arousals or at least a 3% drop in SaO2.19 (see Appendix 2).
Tracheal Sounds Recording
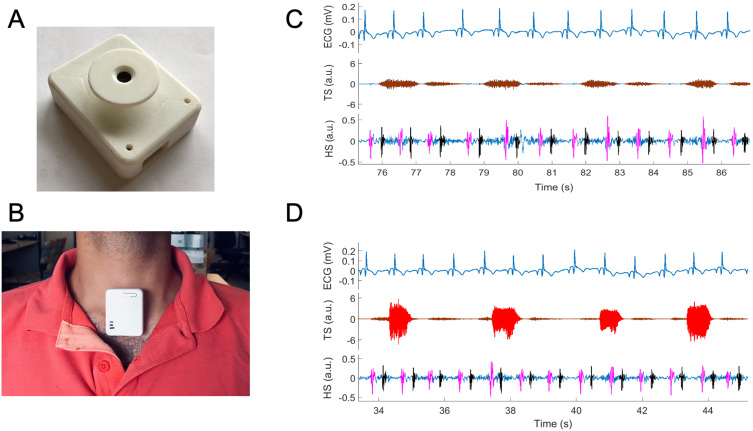
Tracheal sounds, consisting of respiratory and heart sounds, were recorded continuously and simultaneously with the PSG using a small wearable device (The Patch) developed in our laboratory.20–23 The Patch consisted of a microphone and an accelerometer to record sounds and body movement, respectively. The Patch was secured to participants’ suprasternal notch using double-sided tape (Figure 1). Custom hardware was developed to synchronize the Patch data with the PSG.
Figure 1.
Extraction of heart sounds (HS), S1 (marked as pink) and S2 (marked as black) from tracheal sound (TS) recorded by the Patch (A) attached to participant’s suprasternal notch (B) during (C) normal breathing and (D) snoring (shaded red in TS). ECG is recorded from PSG. Tracheal sound containing segments of either (C) normal breathing (marked as brown in TS representing inhalation and exhalation) or (D) snoring (marked as red).
Signal Processing
Signal processing algorithms were developed using Matlab (2018a, MathWorks, Natick, MA).
Electrocardiogram Processing
The ECG recording from the overnight PSG was sampled at 250Hz. Parabolic fitting was utilized to identify the R-peaks in the ECG.24 Subsequently, the R-R time series were averaged over 10-second intervals to establish the gold standard heart rate (HRECG).
Heart Sound Localization from the Tracheal Sound Recording
Sounds recorded over the trachea include normal breathing, snoring, and heart sounds. To extract the features of the heart sounds, several steps were undertaken to eliminate noise, including snoring.
Detection of snoring sound
Snoring sounds span a broad frequency spectrum of 20–2000Hz,25 overlapping with the 10–250Hz range of heart sounds.26 Importantly, the higher intensity of snoring sounds often obscures heart sounds. Therefore, it is necessary to identify snoring sounds and apply suitable filtering to accurately locate heart sounds. Accordingly, tracheal sounds were bandpass filtered with a cut-off frequency range of 200–2000Hz. Using a moving window, features from the sound and respiratory-related body movements were computed. Finally, the snoring segments were identified through a weighted average of features’ scores derived using adaptive thresholds (details in Appendix 3).
Estimation of heart rate from heart sound
The tracheal sound recorded by the Patch was bandpass filtered using 20–150Hz cut-off to eliminate breathing sounds27 and high-frequency background noise. For segments containing snoring sounds, the first intrinsic mode function was extracted using empirical mode decomposition28 and subtracted from the filtered sound to isolate heart sounds. Then, the Hilbert envelope was computed and smoothed using a low-pass Butterworth filter at a 7Hz cut-off. Finally, the subsequent peaks of the smoothed Hilbert envelope were identified as the S1 and S2 heart sounds (Figure 1). The S1-S1 time series were generated and averaged over 10-second intervals to estimate heart rate from the heart sounds (HRHS).
Analysis of Changes in Heart Sound Intensities During Respiratory Events and Normal Breathing
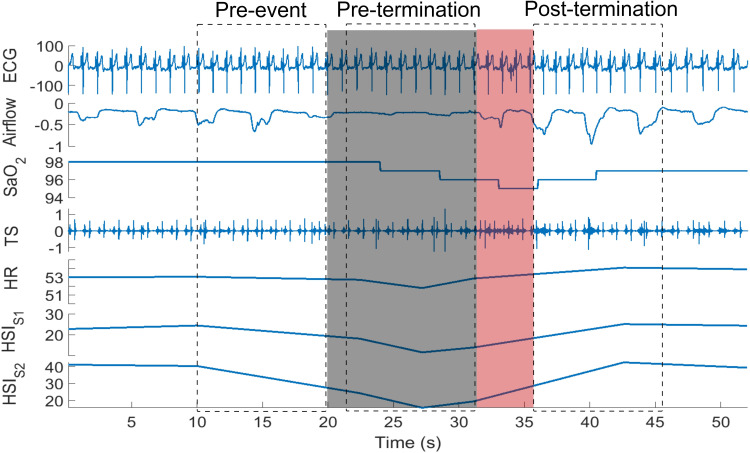
For each participant, 20 obstructive apneas/hypopneas during N2 sleep stage, as marked by the sleep technicians, were randomly selected in order to perform consistent comparison. In this study, only N2 sleep stage was considered as it is the most prevalent sleep stage and may also have a greater impact on the cardiovascular system. In participants with no-OSA, who may have less than 20 events, a minimum of 5 events during N2 sleep stage was considered. For each respiratory event, three 10-second segments were extracted (Figure 2): 1) pre-event: before the start of the event; 2) pre-termination: before the onset of arousal or termination of the respiratory event in case of no arousal; and 3) post-termination: after the arousal or termination of the event in case of no arousal. Then, for each segment, the average area under the curve of the detected S1 and S2 envelopes were calculated as the averages of HSIS1 and HSIS2, respectively. Also, the average HRHS were extracted. Subsequently, the changes in HRHS, HSIS1 and HSIS2 among the three selected segments were calculated for each event. The magnitude of hypoxemia was defined as the total drop in SaO2 level during each respiratory event. In addition, for each participant, 20 normal breathing epochs with duration of 30 seconds were selected randomly to investigate the relationship between heart rate calculated from ECG (HRECG) and heart sound intensities (HSIS1 and HSIS2).
Figure 2.
An extracted hypopnea and the segments of the data considered for heart rate and HSI analysis. The gray shaded area shows hypopnea and the red shaded area indicates the arousal. The dotted rectangles represent the 10-second pre-event, pre-termination and post-termination segments considered for our analysis.
Abbreviations: ECG, electrocardiogram (mV); SaO2, oxygen saturation (%); TS, tracheal sound; HR, heart rate (bpm); HSIS1, S1 intensity (db); HSIS2, S2 intensity (db).
Sex-Based Analyses of Changes in Heart Rate and Heart Sound Intensities During Respiratory Events
Participants were separated into male and female category. For each participant, the average changes in HRHS, HSIS1 and HSIS2 were calculated for each category of drop in SaO2 level during each respiratory event while ignoring the arousal intensity.
Effects of Arousal Intensity on Heart Rate and Heart Sound Intensities
Since arousals can influence heart sounds, the respiratory events were dichotomized into events that terminated a) with arousals; and b) without arousals. For events that terminated with arousals, their intensity was estimated using a modified version of the method proposed by Azarbarzin et al29 using electroencephalogram signal (details in Appendix 4). To investigate the correlation between the changes in HRHS, HSIS1, and HSIS2 from pre-termination to post-termination of respiratory events and arousal intensity, two sound segments were extracted for each arousal:29 i) 10-second segment ending at 2 seconds before arousal onset and ii) the segment from arousal onset until 8 seconds after the arousal end.
Statistical Analysis
For statistical analyses, the RStudio version 1.3.1056 was used. Participants were categorized into four groups based on sleep apnea severity: a) No-OSA (AHI≤5), b) Mild-OSA (5<AHI≤15), c) Moderate-OSA (15<AHI≤30), and d) Severe-OSA (AHI>30). Based on the Shapiro–Wilk normality test, one-way ANOVA or Kruskal Wallis test was used to assess the differences between demographics and sleep-related features among participants with different OSA severity. For categorical features χ2 test was used. Pearson’s correlations were applied to evaluate the relationships between HRHS and HRECG for data with a normal distribution, while Spearman correlation was used for non-normally distributed data. Additionally, the root-mean-square-error (RMSE) between HRHS and HRECG was computed for each sleep stage and position.
A one-way ANOVA was employed to analyze the influence of breathing patterns (normal breathing during wakefulness and sleep, and snoring) on heart rate estimation. To evaluate the effects of sleep stages and sleep positions on heart rate estimation, a two-way repeated measures ANOVA was used. In addition, based on normality test, differences in HSIS1 and HSIS2 from pre-event to pre-termination and post-termination were compared using Friedman or repeated measure ANOVA tests, respectively. Post-hoc analysis was performed using Friedman Conover test or paired t-test with an adjusted p-value for non-normal and normal data, respectively. Repeated measure correlation was used to assess the relation between drop in SaO2 and HRHS, HSIS1, and HSIS2 for events terminated with or without arousals. Linear mixed model with repeated measure was used to assess the changes in HRHS, HSIS1, and HSIS2 between events with and without arousals, for different levels of drop in SaO2.
To study the effect of arousal intensity and drop in SaO2 on HRHS, HSIS1, and HSIS2, a linear mixed model with repeated measure was used. Similarly, the changes in HSIS1 and HSIS2 (ΔHSIS1 and ΔHSIS2) with respect to drop in SaO2 were compared using linear mixed model with repeated measure for subjects with OSA severity of AHI>30 only. We could not run the analysis for other OSA severity categories due to the limited number of data points for some of the hypoxemia levels. Finally, to assess the interaction between arousal intensity and drop in SaO2 levels, a multivariate linear mixed model with repeated measure was used. A p-value of <0.05 was considered statistically significant.
Results
Out of 121 participants aged 18 years and above who were screened for eligibility, 95 individuals agreed to participate in the study. We excluded 5 participants for low-quality data and 13 participants for having less than five obstructive events during N2 stage of sleep. Furthermore, we excluded 13 participants whose overnight drops in SaO2 values for all events were less than 3% (6 individuals) or more than 9% (7 individuals), as there were not enough statistical power for fair comparison. Subsequently, data from 58 participants were included in this study. The average age, BMI, and AHI of the participants (25 females) were 54.7±13.5 years, 30.5±7.1 kg/m2, and 33.2±25.7 events/hour, respectively.
Demographic and sleep data are presented in Table 1. Three participants had No-OSA, 12 had Mild-OSA, 19 had Moderate-OSA, and 24 had Severe-OSA. Age and BMI were significantly different between the four subgroups (p=0.012, 0.008, respectively). Also, the average and minimum SaO2 were significantly different between the four OSA groups (p=0.032, <0.001, respectively). However, sleep efficiency was not significantly different between the four OSA subgroups (p=0.955). As expected, the number of arousals per hour of sleep was significantly higher in participants with severe OSA (53.7±24.7events/h) compared to those with moderate (26.4±11.8events/h, p<0.001), mild (19.2±4.8 events/h, p<0.001) and no (12.7±3.4 events/h, p<0.01) OSA.
Table 1.
Demographic Data and Overnight Polysomnography Findings in Different Groups of OSA Patients
| Total | AHI ≤ 5 | 5<AHI≤ 15 | 15<AHI≤ 30 | AHI >30 | p-value | ||
|---|---|---|---|---|---|---|---|
| N (Female) | 58 (25) | 3 (2) | 12 (6) | 19 (8) | 24 (9) | 0.747 | |
| Demographic | Age (yrs) | 54.7±13.5 | 32.3±16.4** | 55.5±13.4 | 53.1±10.4 | 58.5±13.2 | 0.012* |
| BMI (kg/m2) | 30.5±7.1 | 37.5±7.8 | 26.7±4.2 | 28.9±6.4 | 32.9±7.5 | 0.008* | |
| Weight (kg) | 195.1±51.3 | 237.5±62.4 | 168.4±30.4 | 183.8±44.1 | 212.0±56.6 | 0.018* | |
| Height (cm) | 169.8±9.7 | 168.9±5.8 | 169.1±7.4 | 169.6±8.1 | 170.5±12.2 | 0.977 | |
| History or CVD (Female) | 16 | 0 | 2 (0) | 6 (2) | 8 (3) | _ | |
| Sleep Structure | AHI (events/hr) | 33.2±25.7 | 4.2±1.0** | 9.4±3.4** | 21.9±4.2** | 57.7±21.9** | <0.0001* |
| Sleep efficiency (%) | 77.4±15.7 | 83.0±7.4 | 77.7±12.7 | 76.8±17.0 | 77.2±17.2 | 0.955 | |
| Mean SaO2 (%) | 93.8±2.7 | 94.9±1.0 | 94.7±2.4 | 94.7±1.7 | 92.5±3.2 | 0.032 * | |
| Minimum SaO2 (%) | 81.9±8.1 | 86.7±6.8 | 87.7±5.6 | 83.5±4.7 | 77.2±8.9 | <0.001* | |
| Arousal Index (events/hr) | 35.5±23.4 | 12.7±3.4 | 19.2±4.8 | 26.4±11.8 | 53.7±24.7** | <0.0001* | |
Notes: Data are presented as mean ± standard deviation. Bold text indicates significant changes; *indicate statistically significant changes between groups. **indicate statistically significant changes of that group with all other groups.
Abbreviations: N, Number; BMI, Body Mass Index; AHI, Apnea Hypopnea Index; CVD, Cardiovascular disease.
Heart Rate Estimation from Heart Sound
In all participants, strong correlations between HRECG and HRHS were observed across all sleep stages and positions (r>0.92, p<0.001, in every case) – thus indicating that the heart sounds corresponding to the ECG beats were localized with high precision. During wakefulness, normal breathing while asleep and snoring, the mean RMSE between HRECG and HRHS were 2.9 beat per minute (bpm), 1.7bpm and 2.5bpm, respectively (Table 2). A two-way repeated measures ANOVA revealed that sleep position had a marginal effect on the RMSE of HRHS estimation (p=0.07). However, sleep stage significantly impacted the RMSE of HRHS estimation (p<0.001). Post-hoc analysis indicated that, for both supine and lateral positions, the HRHS estimation error was significantly higher during wakefulness than across various sleep stages (p<0.001).
Table 2.
Comparison of the Effect of Sleep Position, Sleep Stages, Normal Breathing and Snoring During Sleep on the Root-Mean-Square-Error (RMSE) in Heart Rate Estimation from the Patch
| Sleep Position | Sleep Stages | ||||
|---|---|---|---|---|---|
| Awake | N1 | N2 | N3 | REM | |
| Supine, bpm | 2.83±0.1* | 1.86±0.06 | 1.82±0.01 | 1.77±0.04 | 1.95±0.09 |
| Lateral, bpm | 2.91±0.1* | 1.93±0.08 | 1.88±0.05 | 1.86±0.09 | 2.41±0.11 |
| Awake | Sleep | ||||
| Normal breathing | Snoring | ||||
| All postures, bpm | 2.86±0.1* | 1.71±0.07 | 2.45±0.12 | ||
Notes: Bold text indicates significant changes. Here, * = P<0.001, showing statistically significant changes of that stage with all other sleep stages.
Changes in Heart Sound Intensity with Respect to Respiratory Events in Overnight Data
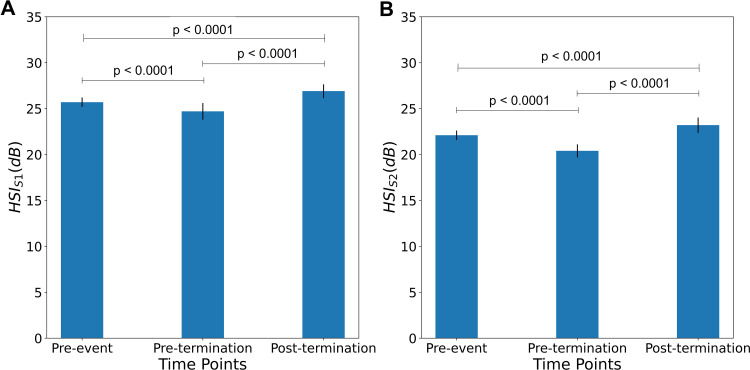
There were significant increases in post-termination HSIS1 and HSIS2 relative to the pre-termination and pre-event HSIS1 and HSIS2 (Figure 3A, HSIS1: 26.9±0.752 dB vs 24.7±0.909 dB, p<0.0001 and 25.7±0.518 dB, p<0.001; Figure 3B, HSIS2: 23.2±0.828 dB vs 20.4±0.714 dB, p<0.0001 and 22.1±0.515 dB, p<0.0001). In addition, the pre-termination HSIS1 and HSIS2 were significantly lower than the pre-event HSIS1 and HSIS2 (p<0.0001; Figure 3A and B).
Figure 3.
Differences in heart sound intensity HSIS1 (A) and HSIS2 (B) from pre-event to pre-termination and post-termination (N= 58): A significant increase in post-termination HSIS1 and HSIS2 can be observed as compared to pre-termination HSIS1 and HSIS2, and pre-event HSIS1 and HSIS2. Similarly, the pre-event HSIS1 and HSIS2 were significantly higher compared to pre-termination HSIS1 and HSIS2.
In all subjects, there were significant positive correlations between HRECG and HSIS1 during respiratory events (r=0.49–0.60, p<0.001) and normal breathing (r=0.47–0.58, p<0.01). On the other hand, the correlation between HRECG and HSIS2 was only significant during respiratory events (r=0.38–0.45, p<0.05), but not during normal breathing (p>0.3).
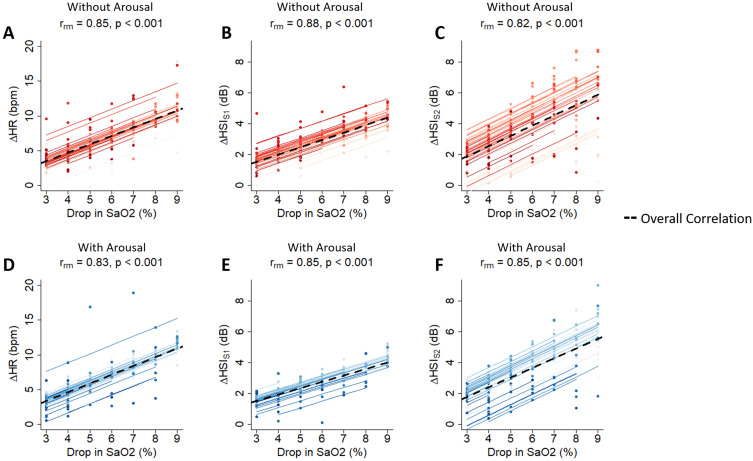
From pre-termination to post-termination of respiratory events with or without arousals, the changes in HRHS, HSIS1 and HSIS2 were significantly correlated with the associated drops in SaO2, with the highest change being for 9% drop compared to 3% drop in SaO2 (Figure 4A–F).
Figure 4.
Relation between change in HR, HSIS1 and HSIS2 with drop in SaO2 during events with and without arousals (N = 58). Significant positive correlations were observed between changes in HR, HSIS1 and HSIS2 with drop in SaO2 for events without arousals (A–C) and for events with arousals (D–F). The dashed line in the figures shows the overall correlation.
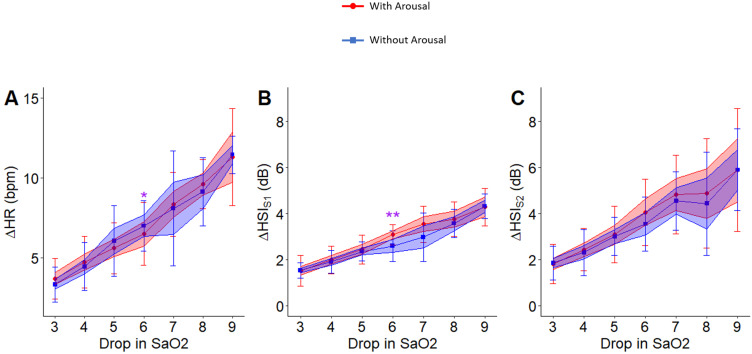
The association of drops in SaO2 with changes in HRHS (p < 0.05), HSIS1 (p < 0.001), and HSIS2 (p < 0.001) were significant even after including arousal intensity in the linear mixed model with repeated measures. However, for the same level of hypoxemia, the changes in HRHS, HSIS1, and HSIS2 from pre-termination to post-termination were not significantly different for respiratory events that terminated with arousals compared to those that were terminated without arousals (Figure 5A–C).
Figure 5.
Relation between change in heart rate, HSIS1 and HSIS2 with drop in SaO2 during events with and without arousals (N = 58). No significant differences in the associated change in heart rate (A), HSIS1 (B) and HSIS2 (C) with drop in SaO2 were observed. For the hypoxemia level of 6%, the changes in HRHS (p < 0.05) and HSIS1 (p < 0.01) were significantly different between events that terminated with arousals compared to those without arousals. Here, * indicates p<0.05 and ** indicates p<0.01. The color band shows the confidence interval of 0.95% and the bars indicate standard deviation.
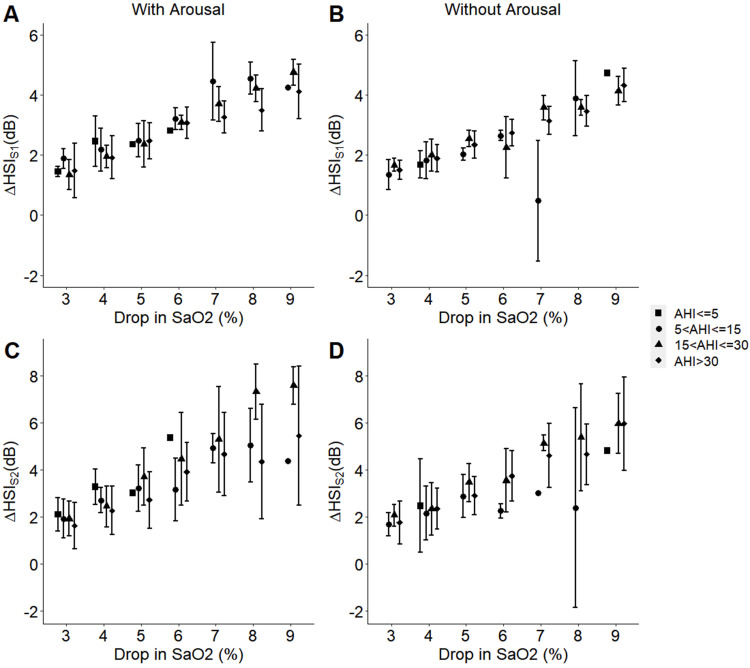
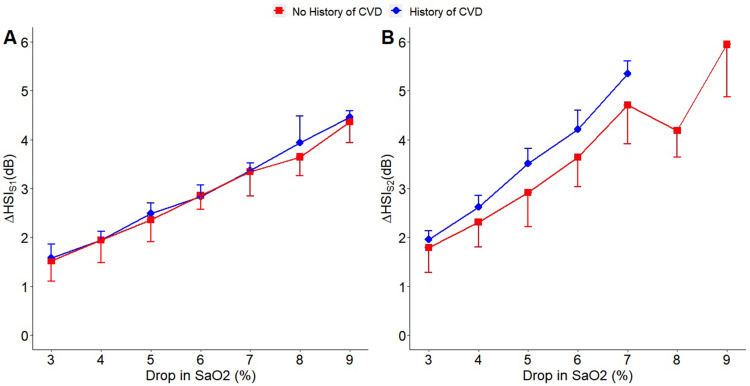
Finally, for participants with AHI>30, the changes in HSIS1 and HSIS2 from pre-termination to post-termination events were significantly different (p < 0.001) among events with different hypoxemia levels (Figure 6). For other OSA severity categories, we could not run the analysis due to the limited number of data points in some of the hypoxemia levels. Participants with a previous history of cardiovascular conditions showed a trend of larger increases in HSIS2 from pre-termination to post-termination events, compared to those with no known history (Figure 7A and B).
Figure 6.
Effect of the participants’ overall AHI on the changes in heart sound intensities HSIS1 and HSIS2 with hypoxemia in the presence (A and C) or absence (B and D) of arousal. For participants with AHI>30 (N = 24), linear mixed model with repeated measure analysis indicated significant changes (p < 0.001) in HSIS1 and HSIS2 among events with different hypoxemia levels from pre-termination to post-termination events, which terminated with or without arousals. For other OSA severity categories, we could not run the analysis due to the limited number of data points in some of the hypoxemia levels.
Figure 7.
Effect of the participants’ history of cardiovascular disease (CVD) on the changes in heart sound intensities HSIS1 (A) and HSIS2 (B) with hypoxemia (N = 16). A trend of larger increase in HSIS2 from pre-termination to post-termination event was observed in participants with previous history of cardiovascular disorder (CVD) compared to those with no known history.
Sex-Based Analysis
In each category (male and female), the changes in HRHS, HSIS1 and HSIS2 were significantly correlated with the associated drops in SaO2, with the highest change being for 9% drop compared to 3% drop in SaO2 (Figure 8).
Figure 8.
Sex-based analysis on the changes in heart rate extracted from heart sound HRHS (A) and heart sound intensities HSIS1 (B) and HSIS2 (C) with hypoxemia. No significant differences in the changes in HRHS, HSIS1 and HSIS2 from pre-termination to post-termination event between male and female participants was observed.
Arousal Intensity Analysis
The results of the linear mixed model with the repeated measures to assess the effects of arousal intensity and drops in SaO2 on changes in HRHS, HSIS1, HSIS2 are presented in Table 3. The changes in HRHS, HSIS1, HSIS2 were significantly associated with drops in SaO2. However, these changes were not associated with arousal intensity, and there was no interaction between arousal intensity and drops in SaO2.
Table 3.
Results of the Linear Mixed Model with Repeated Measure for the Association of Changes in HSIS1 and HSIS2 with Drop in SaO2 and Arousal Intensity
| Value | p-value | |
|---|---|---|
| HRHS | ||
| Intercept | 2.4013865 | 0.1918 |
| Arousal Intensity | −0.5652032 | 0.1421 |
| Drop in SaO2 | 0.7434912 | 0.0173 |
| Arousal Intensity:Drop in SaO2 | 0.1020740 | 0.1089 |
| HSIS1 | ||
| Intercept | −0.7268695 | 0.2561 |
| Arousal Intensity | 0.1760824 | 0.1882 |
| Drop in SaO2 | 0.5778194 | 0.0000 |
| Arousal Intensity:Drop in SaO2 | −0.0219941 | 0.3167 |
| HSIS2 | ||
| Intercept | −0.7489223 | 0.5361 |
| Arousal Intensity | 0.0810042 | 0.7479 |
| Drop in SaO2 | 0.7039053 | 0.0006 |
| Arousal Intensity:Drop in SaO2 | −0.0038487 | 0.9254 |
Note: Bold text indicates significant changes.
Discussion
In this study, we introduced a reliable technology to record and extract heart sounds during overnight sleep. The extracted heart sounds can be used for monitoring the mechanical function of the heart including heart rate and pathophysiologic derangement such as hypoxemia during respiratory events in patients with OSA. The major findings of the study are: (i) compared to pre-termination and pre-respiratory events, there was a significant increase in post-termination HSIS1 and HSIS2; (ii) the changes in HSIS1 and HSIS2 from pre-termination to post-termination of respiratory events with or without arousals showed a significant positive correlation with the associated drops in SaO2, and (iii) changes in HSIS1 and HSIS2 were significantly correlated with the relative changes in heart rate and blood pressure, respectively.
In this study we introduced a technique for extracting heart sounds during sleep even in the presence of snoring. The Patch, placed on the suprasternal notch, captures tracheal respiratory sounds, including heart sounds, breathing sounds, snoring, and ambient noise. We developed a Hilbert transform-based method to localize heart sounds and estimate heart rate. The estimated heart rate was then validated by comparing it with the heart rate derived from the ECG, ensuring accurate heart sound localization during sleep. Our study is also the first to estimate heart rate from heart sounds during sleep. While previous studies demonstrated high accuracy in assessing heart rate during normal breathing,30–32 none has been validated or performed well in the presence of snoring. Our proposed method employs empirical mode decomposition to minimize the impact of snoring, allowing for accurate localization of heart sounds and estimation of heart rate.
Previous studies have indicated that increases in heart rate are strongly associated with the loudness of heart sound S1.33,34 However, the influence of heart rate changes on heart sound S2 remains unclear. We investigated the relationship between variations in beat-to-beat heart rate and HSIS1, HSIS2 during respiratory events and normal breathing. As expected, heart rate showed a significant correlation with HSIS1 in both normal breathing and respiratory events. In contrast, HSIS2 was only associated with heart rate during respiratory events, not normal breathing. This may suggest that changes in blood pressure rather than heart rate at the termination of respiratory events,35,36 account for the observed increase in HSIS2. This finding was further supported by our preliminary data in healthy subjects performing Mueller Maneuvers, showing a significant correlation between HSIS2 and blood pressure. Furthermore, this correlation aligns with previous finding by Turnbull et al,37 that slight reductions in overnight blood pressure can reduce the risk of adverse cardiovascular events in patients with OSA.
In patients with severe OSA, the HSI increased from pre to post termination of the events and this increase was associated with the drops in SaO2. Furthermore, our multivariate analysis for HSI suggested that there was no interaction between arousal intensity and the drops in SaO2, indicating that drops in SaO2 may play a bigger role in the increment of the HSI. During pharyngeal airway obstruction, intermittent hypoxemia elevates sympathetic nervous system activity, leading to increased blood pressure during the night and day.7,38,39 Furthermore, the heart rate following an obstructive respiratory event has been observed to increase in proportion to the event’s severity.18 This suggests that the relative increases in blood pressure and heart rate due to hypoxemia could be responsible for the corresponding increases in HSIS1 and HSIS2 from pre-termination to post-termination of events.
Compared to those with no known history of cardiovascular disorders, participants with the previous history of cardiovascular disorders had a tendency for a larger increase in HSIS2 from pre-termination to post-termination of events in association with drops in SaO2. This could suggest that cardiovascular disorders such as hypertension may constitute louder heart sounds40 in conjunction with hypoxemia. Moreover, in patients with OSA, both heart rate and blood pressure remain elevated during sleep and show a positive correlation with the severity of sleep apnea.41,42 As our sample size was small, the effects of OSA severity on the changes in heart sounds’ features with respiratory events should be investigated in future studies.
There are several limitations to this study. Although our developed algorithm successfully retrieved heart sounds and heart rate during snoring, the effect of signal decomposition on the HSIS1 and HSIS2 during snoring has not been verified. It was assumed that the HSIS1 and HSIS2 were not significantly affected since, i) for snoring segments, only the first level of the decomposed signal was removed; ii) rather than the actual magnitude, we investigated the changes in HSIS1 and HSIS2. We had to exclude participants with overnight SaO2 drops less than 3% and greater than 9%, as the limited range of values in these participants may not provide sufficient variability, which would disproportionately influence and skew the results. Also, we had only 16 participants with a previously known history of cardiovascular diseases. Pathologic cardiac conditions can create abnormal heart sounds40 and should be explored further. Moreover, future studies could include more subjects with different severities of OSA to investigate the effects of OSA severity on heart sounds during sleep. Furthermore, we recorded the heart sounds from the suprasternal notch. We acknowledge the fact that heart sounds recorded over the chest may result in different performance for heart sound localization. Moreover, we only considered the obstructive events in this study. A future study should investigate the effects of other types of respiratory events, such as central events, on heart sound intensity. Finally, our current dataset is limited in terms of sample size. Future studies are required to access our results in a larger population.
Conclusion
In conclusion, this study demonstrates that monitoring heart sounds during sleep can be a promising tool for assessing hypoxemia during the events and changes in heart rate in patients with OSA. Despite advances in the treatment and prevention of cardiovascular disorders, the incidences of cardiovascular-related deaths remain high in patients with OSA. Therefore, heart sounds analyses can be a strong modality in identifying the mechanisms underlying the development and progression of cardiovascular disorders in patients with OSA. This can lead to the development of convenient and accessible technologies which can help in more accurate monitoring, earlier diagnosis, risk prediction, and improved treatment of cardiovascular disorders.
Funding Statement
This project was supported by Ontario Centres of Excellence, Natural Sciences and Engineering Research Council of Canada, AGE-WELL NCE Inc., and BresoTEC Inc, Toronto, ON, Canada.
Disclosure
Azadeh Yadollahi has grants from NSERC-Collaborative Research and Development, NSERC-Discovery, Ontario Centers of Excellence-Voucher for Innovative and Productivity (VIP-II). In addition, Azadeh Yadollahi has a patent Breathing Analysis for Detection of Sleep Apnea/Hypopnea Events – Patent number US7559903B2 licensed, and a patent System and methods for estimating respiratory airflow – Patent number: US10004452B2, licensed. The remaining authors have no conflicts of interest to declare for this work.
References
- 1.Ritchie H, Roser M. Causes of death. 2018. Available from: https://ourworldindata.org/causes-of-death. Accessed October 9, 2024.
- 2.McNicholas WT, Bonsignore MR. Sleep apnoea as an independent risk factor for cardiovascular disease: current evidence, basic mechanisms and research priorities. Eur Respir J. 2007;29(1):156. doi: 10.1183/09031936.00027406 [DOI] [PubMed] [Google Scholar]
- 3.Yeghiazarians Y, Jneid H, Jneid H, et al. Obstructive sleep apnea and cardiovascular disease: a scientific statement from the American Heart Association. Circulation. 2021;144(3):e56–e67. doi: 10.1161/CIR.0000000000000988 [DOI] [PubMed] [Google Scholar]
- 4.Sjöström C, Lindberg E, Elmasry A, Hägg A, Svärdsudd K, Janson C. Prevalence of sleep apnoea and snoring in hypertensive men: a population based study. Thorax. 2002;57(7):602. doi: 10.1136/thorax.57.7.602 [DOI] [PMC free article] [PubMed] [Google Scholar]
- 5.Isakson SR, Beede J, Jiang K, et al. Prevalence of sleep disordered breathing in congestive heart failure as determined by apnealink, a simplified screening device. Sleep Diag Ther. 2008;3(7):52–57. [Google Scholar]
- 6.Young T, Palta M, Dempsey J, Skatrud J, Weber S, Badr S. The occurrence of sleep-disordered breathing among middle-aged adults. New Engl J Med. 1993;328(17):1230–1235. doi: 10.1056/NEJM199304293281704 [DOI] [PubMed] [Google Scholar]
- 7.Somers VK, Dyken ME, Clary MP, Abboud FM. Sympathetic neural mechanisms in obstructive sleep apnea. J Clin Invest. 1995;96(4):1897–1904. doi: 10.1172/JCI118235 [DOI] [PMC free article] [PubMed] [Google Scholar]
- 8.Vena D, Bradley TD, Millar PJ, et al. Heart rate variability responses of individuals with and without saline-induced obstructive sleep apnea. J Clin Sleep Med. 2018;14(4):503–510. doi: 10.5664/jcsm.7032 [DOI] [PMC free article] [PubMed] [Google Scholar]
- 9.Somers VK, White DP, Amin R, et al. Sleep apnea and cardiovascular disease. Circulation. 2008;118(10):1080. doi: 10.1161/CIRCULATIONAHA.107.189420 [DOI] [PubMed] [Google Scholar]
- 10.Podsus T, Mayer J, Penzel T. Nocturnal haemodynamic in patients with obstructive sleep apnoea. Eur J Respir Dis. 1986;69:435–442. [PubMed] [Google Scholar]
- 11.Ryan S. Mechanisms of cardiovascular disease in obstructive sleep apnoea. J Thoracic Dis. 2018;10:S4201–S4211. doi: 10.21037/jtd.2018.08.56 [DOI] [PMC free article] [PubMed] [Google Scholar]
- 12.Azarbarzin A, Sands SA, Stone KL, et al. The hypoxic burden of sleep apnoea predicts cardiovascular disease-related mortality: the osteoporotic fractures in men study and the sleep heart health study. Eur Heart J. 2019;40(14):1149–1157. doi: 10.1093/eurheartj/ehy624 [DOI] [PMC free article] [PubMed] [Google Scholar]
- 13.Trzepizur W, Blanchard M, Ganem T, et al. Sleep apnea-specific hypoxic burden, symptom subtypes, and risk of cardiovascular events and all-cause mortality. Am J Respir Crit Care Med. 2022;205(1):108–117. doi: 10.1164/rccm.202105-1274OC [DOI] [PubMed] [Google Scholar]
- 14.Randerath W, Bassetti CL, Bonsignore MR, et al. Challenges and perspectives in obstructive sleep apnoea: report by an ad hoc working group of the sleep disordered breathing group of the European respiratory society and the European sleep research society. Eur Respir J. 2018;52(3):1702616. doi: 10.1183/13993003.02616-2017 [DOI] [PubMed] [Google Scholar]
- 15.Bartels A, Harder D. Non-invasive determination of systolic blood pressure by heart sound pattern analysis. Clin Phys Physiol Meas. 1992;13(3):249–256. doi: 10.1088/0143-0815/13/3/004 [DOI] [PubMed] [Google Scholar]
- 16.Zhang XY, MacPherson E, Zhang YT. Relations between the timing of the second heart sound and aortic blood pressure. IEEE Trans Bio-Med Eng. 2008;55(4):1291–1297. doi: 10.1109/TBME.2007.912422 [DOI] [PubMed] [Google Scholar]
- 17.Peng R-C, Yan W-R, Zhang N-L, Lin W-H, Zhou X-L, Zhang Y-T. Cuffless and continuous blood pressure estimation from the heart sound signals. Sensors. 2015;15(9):23653–23666. doi: 10.3390/s150923653 [DOI] [PMC free article] [PubMed] [Google Scholar]
- 18.Jordan AS, Eckert DJ, Wellman A, Trinder JA, Malhotra A, White DP. Termination of respiratory events with and without cortical arousal in obstructive sleep apnea. Am J Respir Crit Care Med. 2011;184(10):1183–1191. doi: 10.1164/rccm.201106-0975OC [DOI] [PMC free article] [PubMed] [Google Scholar]
- 19.Berry RB, Albertario CL, Harding SM, et al. The AASM manual for the scoring of sleep and associated events: rules, terminology and technical specifications. American Academy of Sleep Medicine; 2018.
- 20.Saha S, Kabir M, Ghahjaverestan NM, et al. Portable diagnosis of sleep apnea with the validation of individual event detection. Sleep Med. 2020;69:51–57. doi: 10.1016/j.sleep.2019.12.021 [DOI] [PubMed] [Google Scholar]
- 21.Ghahjaverestan NM, Akbarian S, Hafezi M, et al. Sleep/wakefulness detection using tracheal sounds and movements. Nat Sci Sleep. 2020;12:1009–1021. doi: 10.2147/NSS.S276107 [DOI] [PMC free article] [PubMed] [Google Scholar]
- 22.Ghahjaverestan NM, Kabir M, Saha S, et al. Automatic respiratory phase identification using tracheal sounds and movements during sleep. Annals Biomed Eng. 2021;49:1–13. [DOI] [PubMed] [Google Scholar]
- 23.Hafezi M, Montazeri N, Saha S, et al. Sleep apnea severity estimation from tracheal movements using a deep learning model. IEEE Access. 2020;8:22641–22649. doi: 10.1109/ACCESS.2020.2969227 [DOI] [Google Scholar]
- 24.Kabir MM, Saint DA, Nalivaiko E, Abbott D, Voss A, Baumert M. Quantification of cardiorespiratory interactions based on joint symbolic dynamics. Ann Biomed Eng. 2011;39(10):2604–2614. doi: 10.1007/s10439-011-0332-3 [DOI] [PubMed] [Google Scholar]
- 25.Lee LA, Lo YL, Yu JF, et al. Snoring sounds predict obstruction sites and surgical response in patients with obstructive sleep apnea hypopnea syndrome. Sci Rep. 2016;6:30629. doi: 10.1038/srep30629 [DOI] [PMC free article] [PubMed] [Google Scholar]
- 26.Debbal SM, Bereksi-Reguig F. Computerized heart sounds analysis. Comput Biol Med. 2008;38(2):263–280. doi: 10.1016/j.compbiomed.2007.09.006 [DOI] [PubMed] [Google Scholar]
- 27.Yadollahi A, Moussavi ZM. A robust method for heart sounds localization using lung sounds entropy. IEEE Trans Bio-Med Eng. 2006;53(3):497–502. doi: 10.1109/TBME.2005.869789 [DOI] [PubMed] [Google Scholar]
- 28.Huang NE, Shen Z, Long SR, et al. The empirical mode decomposition and the Hilbert spectrum for nonlinear and non-stationary time series analysis. Proc R Soc London A. 1998;454(1971):903. doi: 10.1098/rspa.1998.0193 [DOI] [Google Scholar]
- 29.Azarbarzin A, Ostrowski M, Hanly P, Younes M. Relationship between arousal intensity and heart rate response to arousal. Sleep. 2014;37(4):645–653. doi: 10.5665/sleep.3560 [DOI] [PMC free article] [PubMed] [Google Scholar]
- 30.Sun S, Jiang Z, Wang H, Fang Y. Automatic moment segmentation and peak detection analysis of heart sound pattern via short-time modified Hilbert transform. Comput Methods Prog Biomed. 2014;114(3):219–230. doi: 10.1016/j.cmpb.2014.02.004 [DOI] [PubMed] [Google Scholar]
- 31.Ari S, Kumar P, Saha G. A robust heart sound segmentation algorithm for commonly occurring heart valve diseases. J Med Eng Technol. 2008;32(6):456–465. doi: 10.1080/03091900601015162 [DOI] [PubMed] [Google Scholar]
- 32.Chen YH, Chen HH, Chen TC, Chen LG Robust heart rate measurement with phonocardiogram by on-line template extraction and matching. Conference proceedings: Annual International Conference of the IEEE Engineering in Medicine and Biology Society IEEE Engineering in Medicine and Biology Society Annual Conference. 2011;2011:1957–1960. [DOI] [PubMed] [Google Scholar]
- 33.Leech G, Brooks N, Green-Wilkinson A, Leatham A. Mechanism of influence of PR interval on loudness of first heart sound. Br Heart J. 1980;43(2):138–142. doi: 10.1136/hrt.43.2.138 [DOI] [PMC free article] [PubMed] [Google Scholar]
- 34.Stept ME, Heid CE, Shaver JA, Leon DF, Leonard JJ. Effect of altering P-R interval on the amplitude of the first heart sound in the anesthetized dog. Circ res. 1969;25(3):255–263. doi: 10.1161/01.RES.25.3.255 [DOI] [PubMed] [Google Scholar]
- 35.Chen D, Pibarot P, Honos G, Durand LG. Estimation of pulmonary artery pressure by spectral analysis of the second heart sound. Am j Cardiol. 1996;78(7):785–789. doi: 10.1016/S0002-9149(96)00422-5 [DOI] [PubMed] [Google Scholar]
- 36.Aggio S, Baracca E, Longhini C, et al. Noninvasive estimation of the pulmonary systolic pressure from the spectral analysis of the second heart sound. Acta cardiologica. 1990;45(3):199–202. [PubMed] [Google Scholar]
- 37.Turnbull F. Effects of different blood-pressure-lowering regimens on major cardiovascular events: results of prospectively-designed overviews of randomised trials. Lancet. 2003;362(9395):1527–1535. [DOI] [PubMed] [Google Scholar]
- 38.Daly MD, Scott MJ. The cardiovascular responses to stimulation of the carotid body chemoreceptors in the dog. J Physiol. 1963;165:179–197. doi: 10.1113/jphysiol.1963.sp007051 [DOI] [PMC free article] [PubMed] [Google Scholar]
- 39.Hla KM, Young TB, Bidwell T, Palta M, Skatrud JB, Dempsey J. Sleep apnea and hypertension. A population-based study. Ann Internal Med. 1994;120(5):382–388. doi: 10.7326/0003-4819-120-5-199403010-00005 [DOI] [PubMed] [Google Scholar]
- 40.Marelli AJ. 69 - congenital heart disease in adults A2 - Goldman, Lee. In: Schafer AI, editor. Goldman’s Cecil Medicine (Twenty-Fourth Edition). Philadelphia: W.B. Saunders; 2012:397–409. [Google Scholar]
- 41.Dopp JM, Reichmuth KJ, Morgan BJ. Obstructive sleep apnea and hypertension: mechanisms, evaluation, and management. Curr Hypertens Rep. 2007;9(6):529–534. doi: 10.1007/s11906-007-0095-2 [DOI] [PubMed] [Google Scholar]
- 42.He QY, Feng J, Zhang XL, et al. Elevated nocturnal and morning blood pressure in patients with obstructive sleep apnea syndrome. Chinese Med J. 2012;125(10):1740–1746. [PubMed] [Google Scholar]


