Abstract
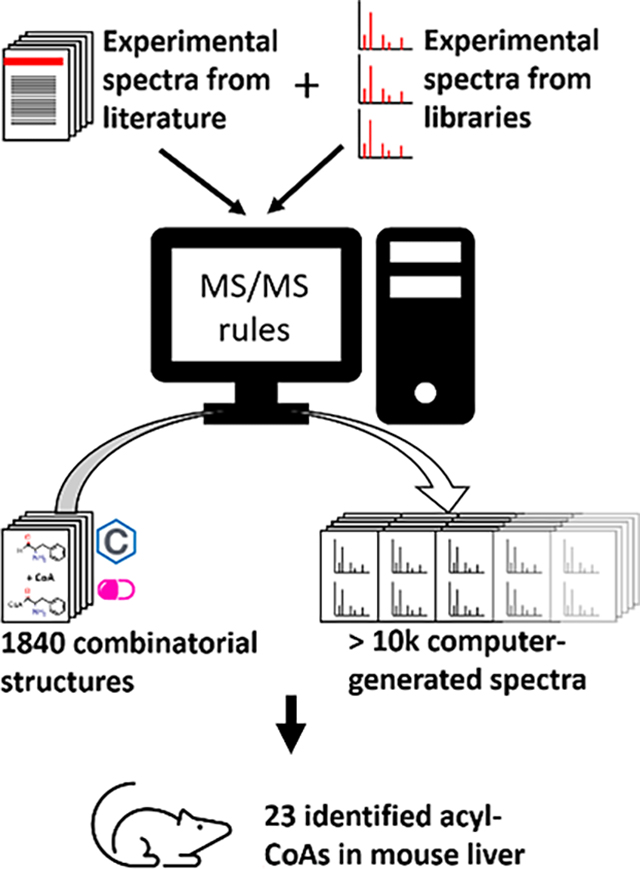
Acyl-coenzyme A derivatives (acyl-CoAs) are core molecules in the fatty acid and energy metabolism across all species. However, in vivo, many other carboxylic acids can form xenobiotic acyl-CoA esters, including drugs. More than 2467 acyl-CoAs are known from the published literature. In addition, more than 300 acyl-CoAs are covered in pathway databases, but as of October 2020, only 53 experimental acyl-CoA tandem mass spectra are present in NIST20 and MoNA libraries to enable annotation of the mass spectra in untargeted metabolomics studies. The experimental spectra originated from low-resolution ion trap and triple quadrupole mass spectrometers as well as high-resolution quadrupole-time of flight and orbital ion trap instruments at various collision energies. We used MassFrontier software and the literature to annotate fragment ions to generate fragmentation rules and intensities for the different instruments and collision energies. These rules were then applied to 1562 unique species based on [M+H]+ and [M–H]− precursor ions to generate two mass spectra per instrument platform and collision energy, amassing an in silico library of 10,934 accurate mass MS/MS spectra that are freely available at github.com/urikeshet/CoA-Blast. The spectra can be imported into a commercial or freely available mass spectral search tool. We used the libraries to annotate 23 acyl-CoA esters in mouse liver, including 8 novel species.
Graphical Abstract
INTRODUCTION
Acyl-CoA Analysis.
Acyl-CoAs are fundamental compounds in numerous reactions in metabolism. The KEGG pathway database lists 351 CoA-specific enzymes, covering 56 CoA-specific enzyme classes such as decarboxylases, kinases, dehydratases, dehydrogenase, desaturases, hydrolases, ligases, reductase, synthases, and others.
Enzymes that catalyze many reactions (enzyme promiscuity) and therefore lack high specificity are also known for a series of CoA specific enzymes.1 The evolutionary divergence from “generalist” enzyme to “specialist” enzyme2 also bears a risk, namely, that xenobiotic compounds such as carboxylic drugs are rendered useless by catalytic conversion to their CoA thioester analogs or, in the case of acyl-CoA deficiency disorders, the fatty acids itself become toxic.3
Acyl-CoAs take part in enzymatic formation and cleavage of carbon–carbon bonds4 but also act as cellular signaling molecules5 and are found dysregulated in various diseases.6,7 Yet, in untargeted metabolomics, acyl-CoAs are difficult to unambiguously annotate because they are usually low abundant and show high structural complexity8 with a few available authentic standards. Current experimental libraries only contain approximately 50 mass spectra of this compound class.
Furthermore, some enzymes, such as mammalian carboxylesterases, have broad substrate specificities and can react with drugs, narcotics, and also various acyl-CoA species.9 Other enzymes can catalyze reactions between CoA and various xenobiotics to form xenobiotic-CoAs, such as the benzoyl-CoA generation from the benzoic acid substrate.10 Thus, it is important to expand the existing mass spectral libraries to also cover unexpected CoAs species to enable novel discoveries in biology and disease pathogenesis.
Lipidomics Relies on In Silico MS/MS Libraries.
Ultrahigh-performance liquid chromatography (LC) coupled with high-resolution accurate mass tandem MS/MS has greatly improved our ability to resolve and identify a growing number of metabolites from biological samples. Untargeted metabolomics typically uses collision-induced fragmentation in either quadrupole time-of-flight (QTOF) or orbital ion trap mass spectrometers. For compound identifications, the MS/MS spectra are matched to experimentally acquired libraries such as NIST20 and MassBank of North America (MoNA).11 For many compound classes, however, the number of MS/MS spectra from authentic chemical compounds remains very low, limiting the power of compound annotations by MS/MS spectral searches. Yet, if clear fragmentation rules can be extracted from experimental data, the in silico MS/MS spectra can be generated from chemical structures. As an example, the large LipidBLAST12 library has been extended to glucuronyl lipids, fatty acid esters of hydroxy fatty acids (FAHFAs) lipids,13 and acyl-carnitines.14 These libraries contain computer-generated spectra for a whole class of compounds, generated from only a few authentic standards from this class, extending the range of identifiable compounds by a significant amount.
Computational Methods.
Structures from PubChem CoA searches were imported into ChemAxon Instant-JCHEM (v2.4, ChemAxon Ltd.) and exported into a csv spreadsheet. All entries were annotated with a PubChem compound identifier (CID), InChiKeys, molecular formulas, and exact isotopic masses. In addition, carboxylic acids from the DrugBank database15 were exported into an SDF file. The structures were converted with ChemAxon Molconvert into molfiles, and aromaticity and explicit hydrogens were removed. All carboxylic acids were converted into their acyl-CoA derivatives using the reaction modeling software ChemAxon Reactor v5.3 (ChemAxon Ltd.).16 For compounds with multiple carboxyl groups, the reaction software enumerated all possible products in a combinatorial way for up to 35 products. All resulting compounds were exported into Instant-JChem to generate accurate masses and mass differences of the CoA substructures. InChIKey17 hash strings were calculated and used to remove stereoisomers by examining the first part of the InChiKey string. Chemical names were generated by adding “-CoA” to the substrate name. For experimental drugs without a common name, the DrugBank ID or PubChem CID was taken. The MS/MS fragmentation spectra were annotated using ACD/MS Manager version 9.0 (Advanced Chemistry Development, Inc., Toronto, On, Canada)18 and MassFrontier 6.0 (HighChem Ltd., Bratislava, Slovakia). Accurate masses were calculated using MWTWIN (v 6.48).19 The precursor and fragment ion intensity were modeled in a heuristic way and can be modified using the commented VBA code available at github.com/urikeshet/CoA-Blast. The mass spectra were converted from MSP or SDF into NIST format using the Lib2NIST (v1.0.3.3, 2011) library conversion tool. Library files were used in the NIST MS Search program (version 2.0f, build April 2010).20 The spectra are publicly available at github.com/urikeshet/CoA-Blast. Library conversion errors were tested using NIST MSPepSearch (ver. 0.95 t5).21
EXPERIMENTAL METHODS
Standard Mixture Preparation.
Fourteen acyl-CoA authentic standards (Sigma-Aldrich) were dissolved in methanol at a concentration of 100 μg/mL each and stored overnight at −20 °C. The mix was diluted to a 1:6 ratio in water with 50 mM ammonium acetate for a standard LC–MS analysis and, in 20%/80% acetonitrile/water for the long-chain acyl-CoA LC–MS analysis, to a final concentration of 16.67 μg/mL for each of the standards in a final volume of 30 μL.
Sample Preparation for Liver Samples.
Wild-type C57BL/6NCrl mouse liver tissue samples were procured from the University of California, Davis, Mouse Biology Program (MBP) and were processed as previously described.22 Twenty milligrams of fresh weight liver tissue samples was transferred from cryotubes to Eppendorf tubes over dry ice, and 500 μL of methanol/water (80%/20%) was added as the ice-cold extraction solvent. The tissue samples were homogenized for 30 s at 1500 rpm using a Genogrinder 2010 homogenizer (Spex SamplePrep, Metuchen, NJ, USA) and further incubated on ice for 10 min. The homogenized samples were centrifuged at 20,000g for 5 min. The supernatants were transferred to a second polypropylene vial and dried down using a Centrivap (Labconco, Kansas, MO, USA). The dried extracts were reconstituted in two different solvents to match the initial LC conditions of the two separation methods: 30 μL of 50 mM ammonium acetate in water for the standard acyl-CoA method and 30 μL of 50 mM ammonium acetate in 20%/80% acetonitrile/water for the long-chain acyl-CoA method. For a complete recovery of the dried extracts, the reconstituted samples were vortexed for 10 s, sonicated for 2 min, and centrifuged at 20,000g for 2 min. The extracts from two liver tissues were combined into the injection vials (Agilent Technologies, Santa Clara, CA, USA).
Chromatographic and Mass Spectral Settings on the QTOF Instrument.
The samples were analyzed on an Agilent 1290 UHPLC system coupled to an Agilent 6550 iFunnel quadrupole time-of-flight mass spectrometer. LC separation was performed on a Kinetex C18 column (100 × 2.1 mm i.d., 1.7 μm particle size) equipped with a C18 SecurityGuard ULTRA pre-column unit (Phenomenex, Torrance, CA, USA), operated at 40 °C. The mobile phases consisted of the following: (A) 10 mM ammonium acetate in water and (B) acetonitrile. The LC gradient was as follows: 0 min, 2% B; 1.5 min, 2% B; 4 min, 15% B; 6 min, 30% B; 13 min, 95% B; 17 min, 95% B, followed by an additional 3 min post-run time for column equilibration to the initial settings. In addition, the samples were also analyzed in the following LC gradient: 0 min, 20% B; 1.5 min, 20% B; 5 min, 95% B; 14.5 min, 95% B; 15 min, 20% B; 20 min, 20% B (long-chain acyl-CoA method). The autosampler was maintained at 4 °C, and the injection volume was 7 μL, followed by standard needle wash during each analytical run. The electrospray (ESI) source parameters of QTOF were set as follows: drying gas temperature, 200 °C; drying gas flow, 14 L/min; nebulizer pressure, 35 psi; sheath gas temperature, 350 °C; sheath gas flow, 11 L/min. Real-time mass axis calibration was performed by monitoring the reference ions continuously infused throughout the runs (m/z = 121.0509, 922.0098 for positive mode and m/z = 119.0363, 980.0164 for negative mode). The MS/MS spectra were generated in data-dependent acquisition mode with iterative exclusion. The top 4 most intense precursors per scan cycle were selected for fragmentation at 30 eV collision energy. The scan rates were 4 spectra/s for MS and 2 spectra/s for MS/MS. Four consecutive runs were made using the IE-Omics R code to increase the coverage of the MS/MS spectra by automatically generating exclusion lists that are based on each previous run.23 The mass spectra were compared by dot-product scores.24,25
Data Processing and Interpretation.
MS-DIAL ver. 3.9626 was used with 1000 counts/spectrum as the lower threshold for peak picking in LC–QTOF MS/MS and 60% identification score cut-off with accurate mass filters of 0.01 Da for the precursor and 0.05 Da for MS2 ions. The CoA Blast library was used for compound annotation by accurate mass and MS/MS spectral similarity. All spectra with similarity scores >600 were manually investigated by using a linear retention time model based on authentic standards. Additionally, we performed a ChemSpider elemental formula search and extracted the number of data sources from online search results for each candidate structure as an estimate of its biological relevance. If more than one entry with the same structure was found in ChemSpider (e.g., with less defined stereochemistry), the numbers were taken for the entry with the highest number of data sources for that structure.
RESULTS AND DISCUSSION
In stark contrast to the minute number of available experimental MS/MS spectra, thousands of acyl-CoAs have been reported in the literature and database. Curated from the literature, the Chemical Abstract Database (CAS) revealed 2467 molecules via substructure search. In comparison, the PubChem database lists 1455 acyl-CoAs, and 246 are found in the ChEBI database. Even on the level of specific organisms, acyl-CoAs are much more numerous than in MS/MS libraries. The KEGG pathway database covers 288 acyl-CoAs across all species, and the Human Metabolome DB lists 125 acyl-CoAs in humans. We here bridge this wide gap between known CoA species and MS/MS data by generating a large in silico library and validate its usefulness in an analysis of acyl-CoAs by the untargeted LC–MS/MS analysis of mouse liver. An overview of the workflow is given in Figure 1.
Figure 1.
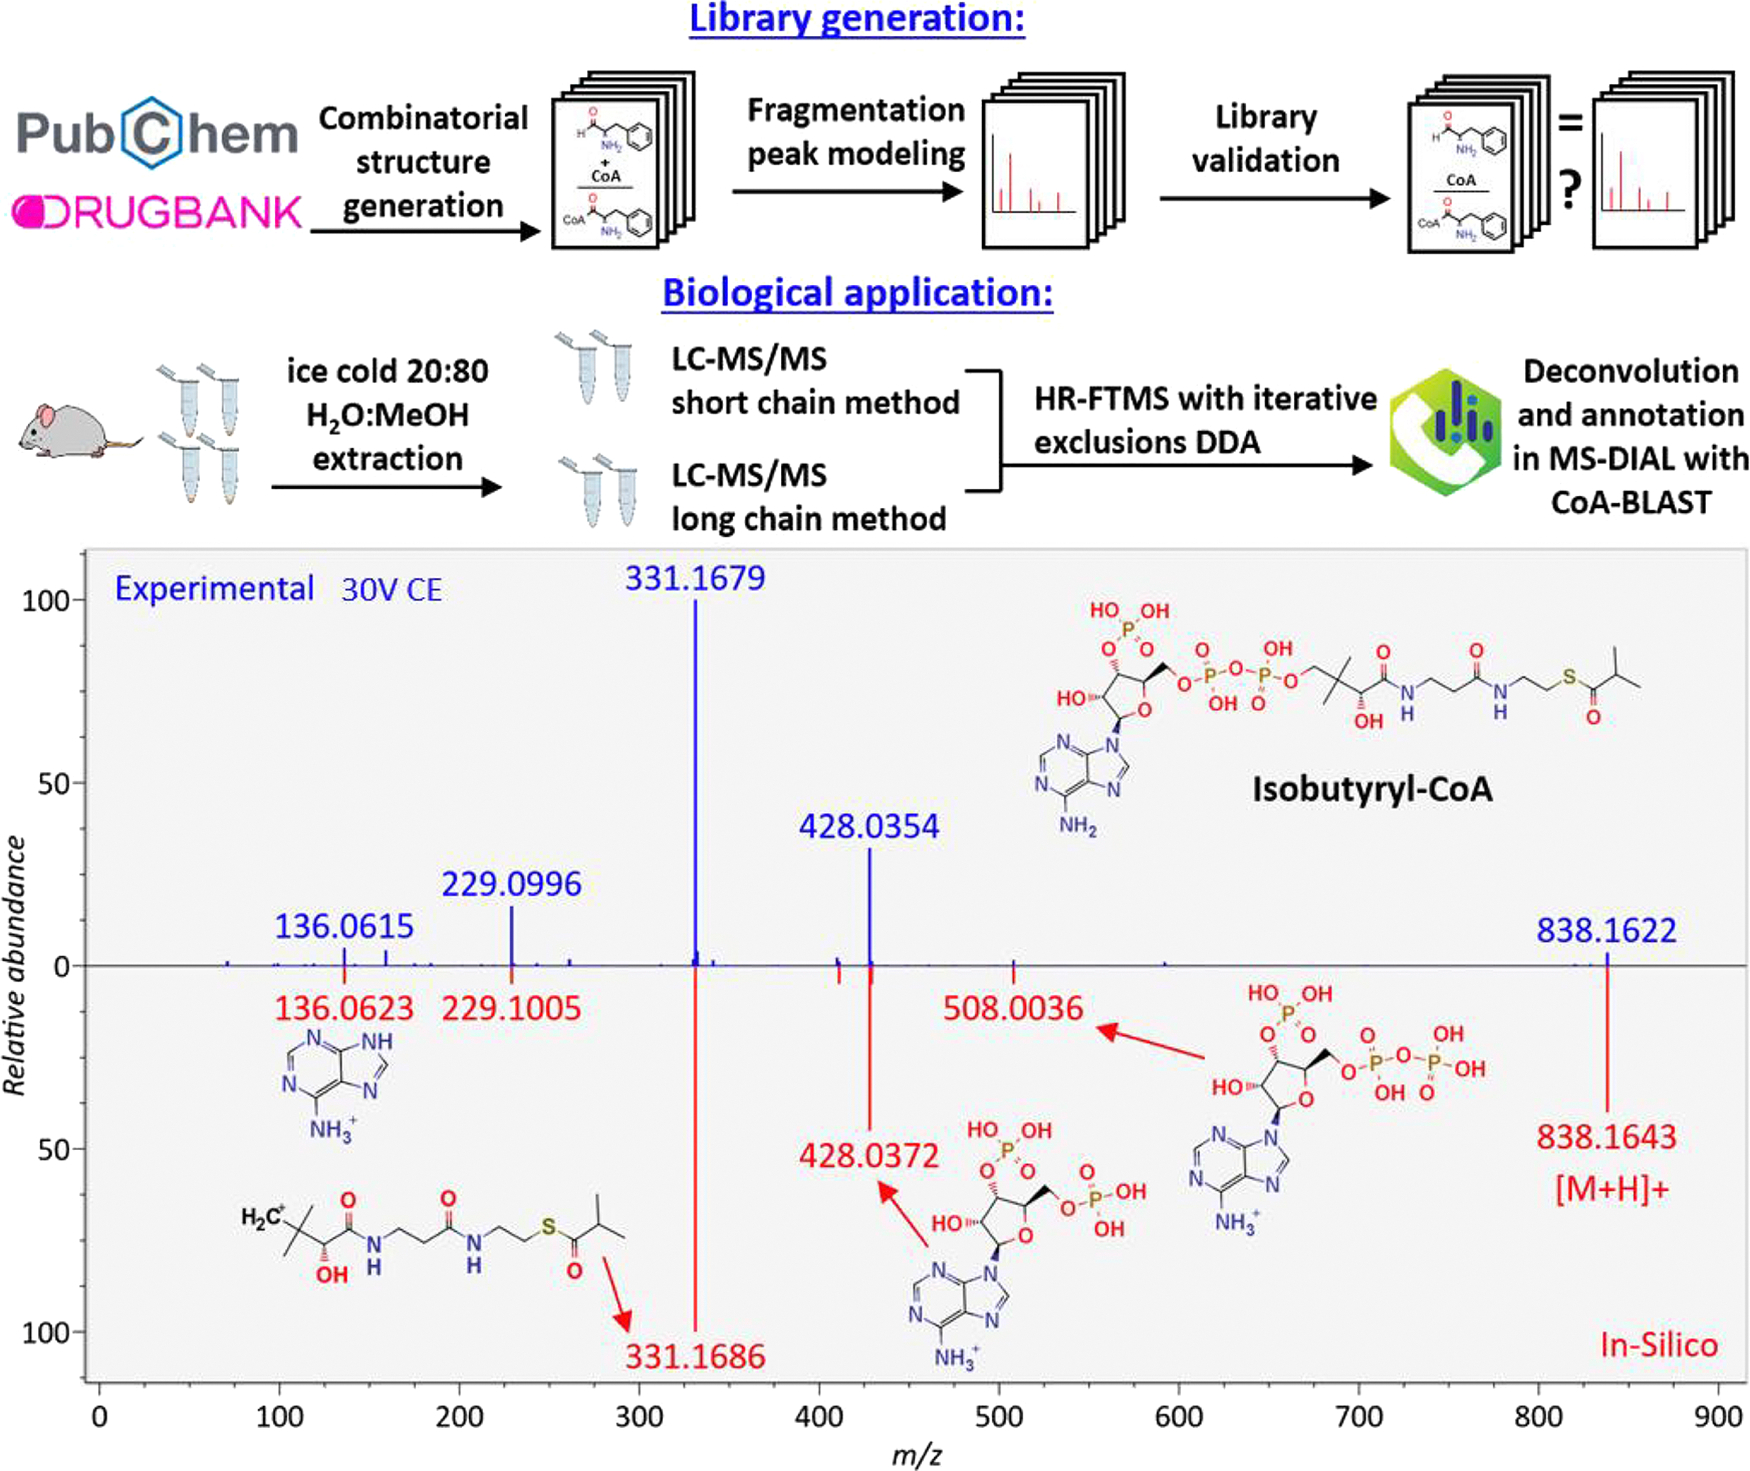
CoA-BLAST library generation workflow, biological analysis workflow, and an example of MS/MS library identification of isobutyryl-CoA in mouse liver by the CoA-Blast in silico library in positive ionization mode. The experimental spectrum is in blue (top spectrum), and the library spectrum is in red (bottom spectrum), with structure annotations for all major fragments in the spectrum.
In Silico Library Creation and Validation.
Because both public and licensed MS/MS libraries only comprise about 50 experimental mass spectra of acyl-CoA species, we first set out to create a comprehensive in silico mass spectral library of such compounds. First, compound structures were generated from chemical scaffolds. To this end, we searched the PubChem database compounds containing the CoA substructure and downloaded 1455 unique acyl-CoA structures as SDF. We reduced the structure list to 585 unique achiral acyl-CoA structures by removing duplicates that accounted for stereoisomers, salt forms, or isotope-labeled compounds. To enrich our chemical scaffolds to cover hypothetical acyl-CoAs that could be formed in vivo by enzyme promiscuity from exposome compounds, we incorporated all 1257 carboxylic acid drugs from the DrugBank database into the scaffold, converting them to their corresponding acyl-CoAs using Chemaxon Reactor. Last, we manually added odd-chain fatty acyl-CoAs that we expected to be found in plants and bacteria: C5:0-CoA, C7:0-CoA, C9:0-CoA, C11:0-CoA, C13:0-CoA, C15:0-CoA, C17:0-CoA, C19:0-CoA, C21:0-CoA, C23:0-CoA, C25:0-CoA, C27:0-CoA, C29:0-CoA, C31:0-CoA, and C33:0-CoA. After removing the stereoisomers as before, a total of 1840 acyl-CoA compound structures were retained.
In a second step, MS/MS fragmentation rules for acyl-CoAs were generated and applied to the list of in silico CoA structures from above. To this end, all available experimental mass spectra from MoNA and NIST17 and a few spectra from scientific publications were investigated to associate fragment ions to compound substructures to generate fragmentation rules using ACD/MS and MassFrontier 6.0 software. This step also enabled modeling of product ion abundances in a heuristic way. Based on the experimental data for the positive mode MS/MS spectra of acyl-CoAs, the characteristic loss of the nucleotide triphosphate moiety [M+H-C10H16N5O13P3]+ (loss of 506.9957 Da) and the typical presence of the nucleotide diphosphate fragment [C10H15N5O10P2H]+ at 428.037 Da were statically modeled as the highest abundant peaks. We modeled all precursor ions at 40% of the base peak abundance as the average across different collision energies. The peak at 508.004 Da corresponds to the 428.037 Da fragment, with the addition of a PO3H group. Two other abundant fragments are the loss of 428.037 Da and the same fragment with the addition of water (loss of 410.026 Da). Finally, a fragment of the loss of 609.064 Da corresponds to the loss of C15H26N5O15P3.
In negative mode, a loss of PO3H resulted in a peak with a loss of 79.967 Da, a loss of 329.053 Da represents the loss of C10H12N5O6P, and the same fragment can lose water to provide another ion at a loss of 347.063 Da. A loss of an additional PO3H group results in an overall loss of 427.030 Da. The fragment at 426.022 Da is the ion [C10H14N5O10P2]−, the fragment at 408.011 Da is C10H12N5O9P2]−, and the fragment at 346.055 Da is [C10H13N5O7P]−, which after a water loss provides the fragment at 328.054 Da. The fragment at 158.925 Da is [P2O6H2]+, and last, the fragment at 78.959 Da is [PO3]−.
In negative mode MS/MS fragmentations, enough experimental data were available to model ion abundance for QTOF and Orbital Ion Trap mass spectrometers separately and to model three different collision energies. Therefore, the negative mode CoA-Blast library consists of 9372 spectra, yielding a total of 10,934 spectra for both negative and positive mode acyl-CoA species combined. The mass spectra were converted into NIST format and are publicly available at github.com/urikeshet/CoA-Blast.
In a third step, we validated this newly generated CoA-Blast MS/MS library. When comparing the whole library to itself and scanning the resulting file manually for misannotations, we did not find any conversion errors. Nevertheless, we found that the acyl-CoA MS/MS spectra were dominated by the abundant fragment ions of the CoA substructure. Therefore, isomers of acyl groups (such as branched-chain or linear-chain fatty acyls) yielded identical in silico MS/MS spectra. Such duplicate spectra were kept in the library to caution users that for some MS/MS matches, more than one chemical structure needs to be considered. Furthermore, we validated the CoA-Blast library by matching all spectra against the NIST MS/MS experimental library, with a precursor mass window of 5 ppm. The results were tested for false-positive identifications. In positive ESI mode, all 10 [M+H]+ NIST17 acyl-CoA entries were correctly identified as top hits using in silico CoA-Blast with MS/MS similarity dot scores of 776–952. No other positively charged NIST17 MS/MS spectrum had a dot-product similarity >500, indicating a very low probability to find false-positive identifications using the CoA-Blast library. Only at similarity <500, 13/1562 virtual CoA-Blast spectra (0.7%) matched some random NIST17 MS/MS spectra of other compounds. For the negative ESI mode MS/MS spectra, all 25 [M–H]− NIST17 acyl-CoA entries were correctly identified as top hits using CoA-Blast with dot scores of 776–971. However, the false-positive rate was slightly higher than in positive ESI mode because the negative ESI mode library contains significantly more spectra due to its two instrument types and three collision energies. In a dot score >500, 4/10,934 (0.04%) CoA-Blast spectra were falsely matched with random NIST17 dimer entries [2M–H]− with collision energies >80 eV, while at a dot score <500, 35/10,934 (0.3%) spectra were falsely annotated. These findings show that the CoA-Blast library successfully annotates the experimentally acquired spectra of acyl-CoA, while it excludes most false positives by using a cutoff dot score of 500. In negative ESI mode, a stricter threshold of >700 may be required to eliminate false-positive annotations as much as possible.
We further validated the library by acquiring both positive and negative ESI mode LC-QTOF MS/MS data on a mixture of 14 acyl-CoA authentic standards. This mixture was then analyzed in MS-DIAL software (ver. 3.96) using the in silico QTOF CoA-Blast library with 40 eV collision energy spectra to identify the experimental acyl-CoA authentic standard spectra (Figure 2, top panel). While all highly abundant negative ESI mode MS/MS fragment ions were correctly matched between experimental acyl-CoAs and the in silico-predicted spectra, some low abundant fragment ions were found in the experimental acyl-CoA MS/MS spectra that were absent in the CoA-Blast library. Hence, we optimized the negative mode CoA-Blast QTOF library based on the MS/MS spectra of these 14 authentic standards by adjusting ion abundances and by adding characteristic fragment ions m/z 134.047 (adenosine fragment) and m/z 78.959 (PO3− anion). These adjustments led to drastic improvements in MS/MS dot scores (Figure 2, lower panel). For example, for hexanoyl-CoA, the dot product score increased from 302 to 712 and its reverse dot product from 377 to 842. Examples of butyryl-CoA and arachidonoyl-CoA in both ionization modes are given in Figure 3.
Figure 2.
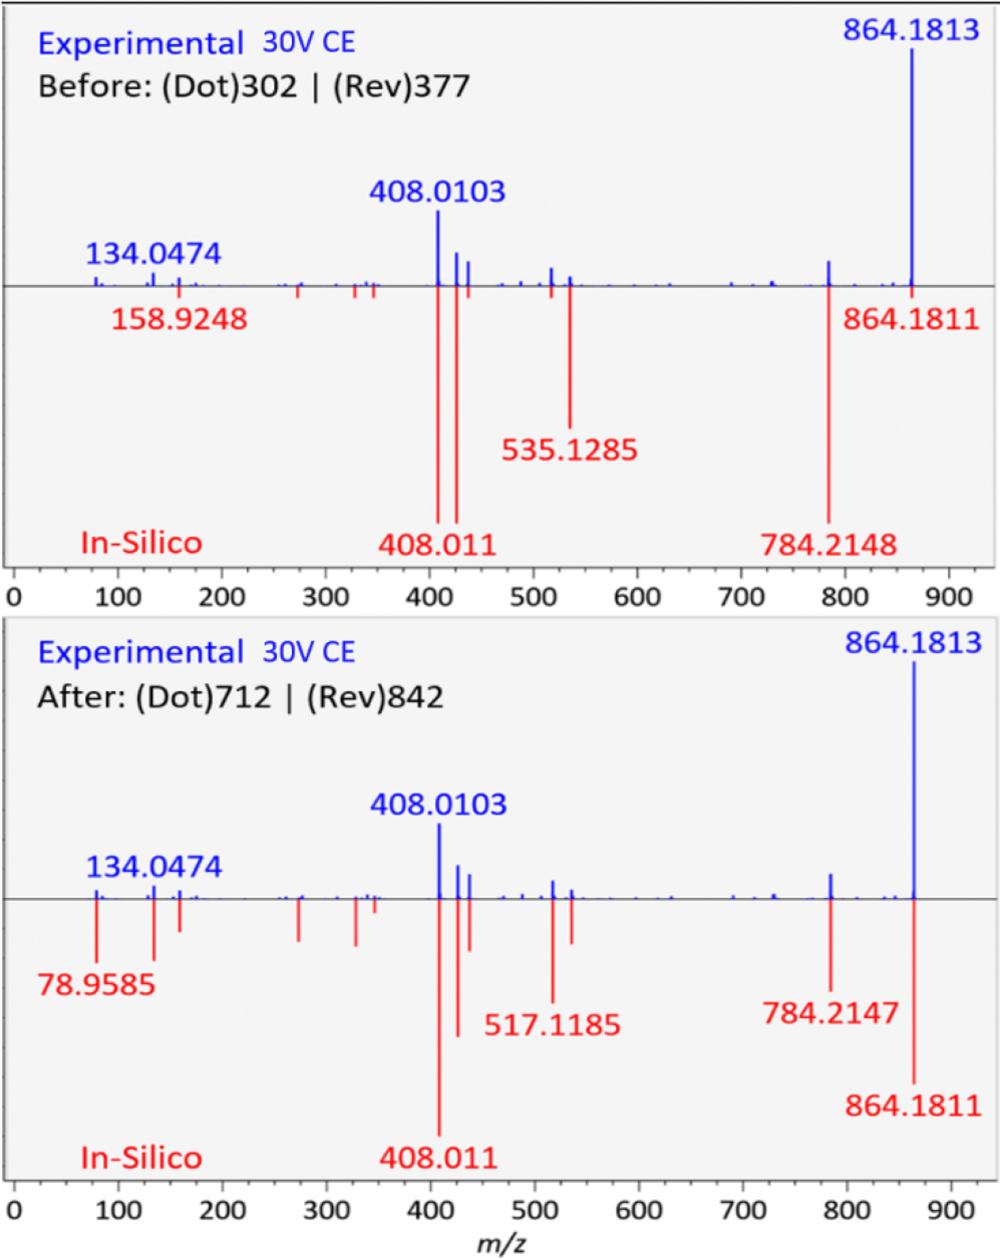
Improving negative ESI mode QTOF MS/MS experimental spectrum matches against the CoA-Blast spectra by adjusting relative abundances in negative mode and adding characteristic fragment ions. Example given for hexanoyl-CoA. Top: unmodified CoA-Blast library; bottom: optimized CoA-Blast library.
Figure 3.
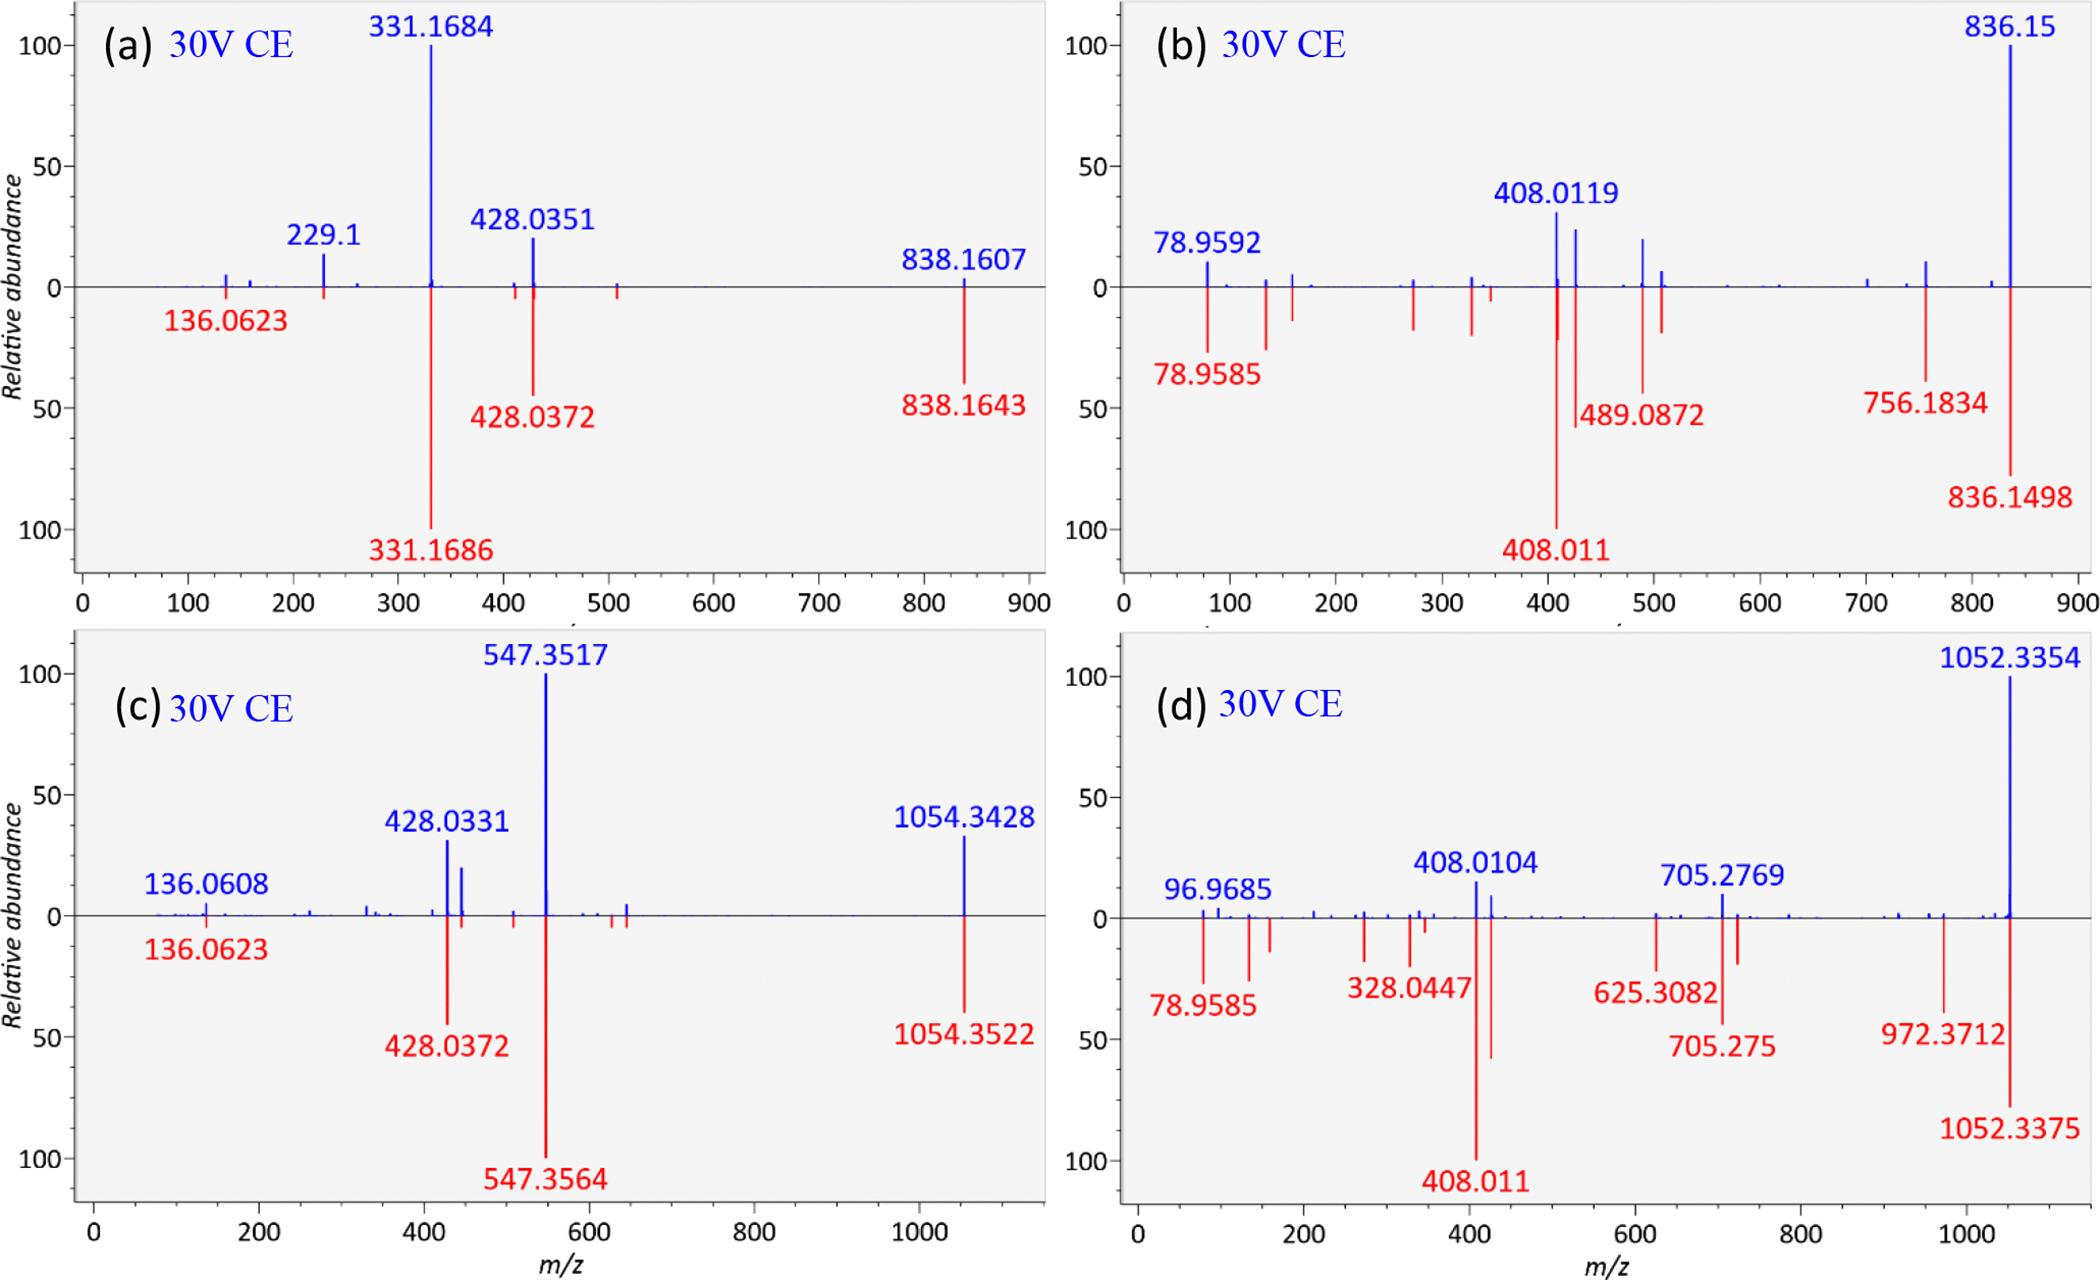
CoA-Blast examples of the experimental tandem mass spectra of the standards (blue) versus the optimized CoA-Blast in silico spectra (red). Examples are butyryl-CoA in positive (a) and negative (b) modes and arachidonoyl-CoA in positive (c) and negative (d) modes.
Adding Retention Times to Increase Confidence in CoA-Blast MS/MS Annotations.
While the combination of accurate precursor m/z and MS/MS spectra is a powerful tool for compound identification, it is still prone to false-positive identifications, for example, due to in-source fragmentation or isobaric interferences. In such cases, it is important to have orthogonal dimensions for high confidence identifications, such as retention times modeled from the experimental retention times of authentic standards. While modern retention time models can be fairly accurate, they require thousands of standards to be trained on.27 For practicality and simplicity, we used a simplified linear regression model for the removal of false-positive library hits. The retention times of 14 acyl-CoA authentic standards (Table S1) were used to develop a linear regression model using the calculated distribution coefficient (logD) values from the structure files. Due to the simplicity of the model, a confidence interval of +1.25 min was used to flag false-positive identifications. In this standard CoA-method, long-chain acyl-CoAs (>C14:0) eluted close to the isocratic region, compromising the separation of possible longer-chain, less polar acyl-CoAs. We therefore added a method for such long-chain acyl-CoAs that, conversely, did not retain small, polar acyl-CoA standards at retention factor k′ < 3.
Identifying Acyl-CoAs in Mouse Liver Using the CoA-Blast Library.
We applied the CoA-Blast library on mouse liver for a comprehensive acyl-CoA analysis. Twenty-three compounds were found and annotated by the library, returning multiple hits with various matching scores. It is difficult to rely on the exact thresholds for MS/MS matching scores and to determine the correct library candidate in untargeted MS/MS assays because, first, the CID fragmentation pattern for isobaric compounds is dominated by the CoA moiety fragment ions and lacks ions that are indicative of the acyl chain. Other techniques such as ultraviolet photodissociation or electron-activated dissociation may assist such interpretations in the future. Second, the in silico library spectra are predictions and, as such, will never be as good as an experimental library that was generated using authentic standards and the same instrument type and parameters. Therefore, we examined all possible CoA candidates with MS/MS similarity scores >600.
The list of all candidates from the library is given in Table S2. The 23 compounds identified in mouse liver are shown in the extracted ion chromatograms in Figure 4. To eliminate false-positive hits, we calculated logD values for all possible MS/MS hits and applied the linear regression model that we obtained from the 14 authentic acyl-CoA standards. Figure 5 shows how the retention time model, despite its simplicity and less than ideal performance at the early retention time range, eliminated two false-positive library hit structures. N-Lauroyl-Ala-Gly-CoA with logD = −8.54 was eliminated while maintaining the endogenous C22:6-CoA at 8.29 min with logD = −4.63. Similarly, 2-hydroxy-3-methyl-4-oxobutanoic acid-CoA with logD = −13.72 was eliminated in favor of phenylpropanoyl-CoA.
Figure 4.
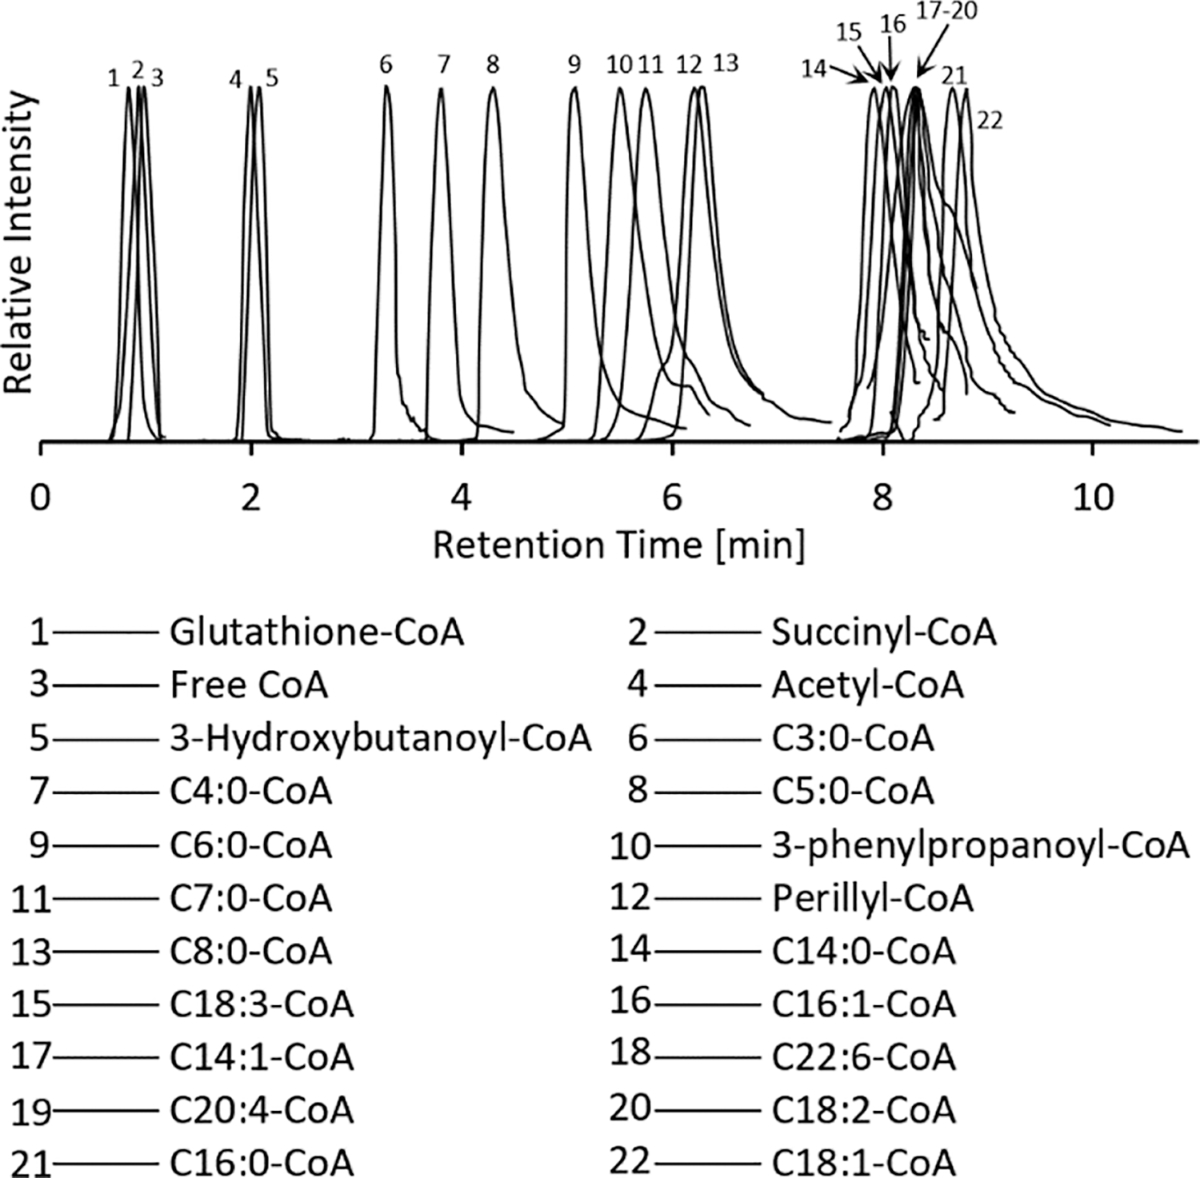
Extracted ion chromatograms of mouse liver acyl-CoAs identified by the matching MS/MS spectra to the CoA-Blast library using the short chain LC method. The extracted chromatograms are normalized for clarity with ±0.5 min retention time windows.
Figure 5.
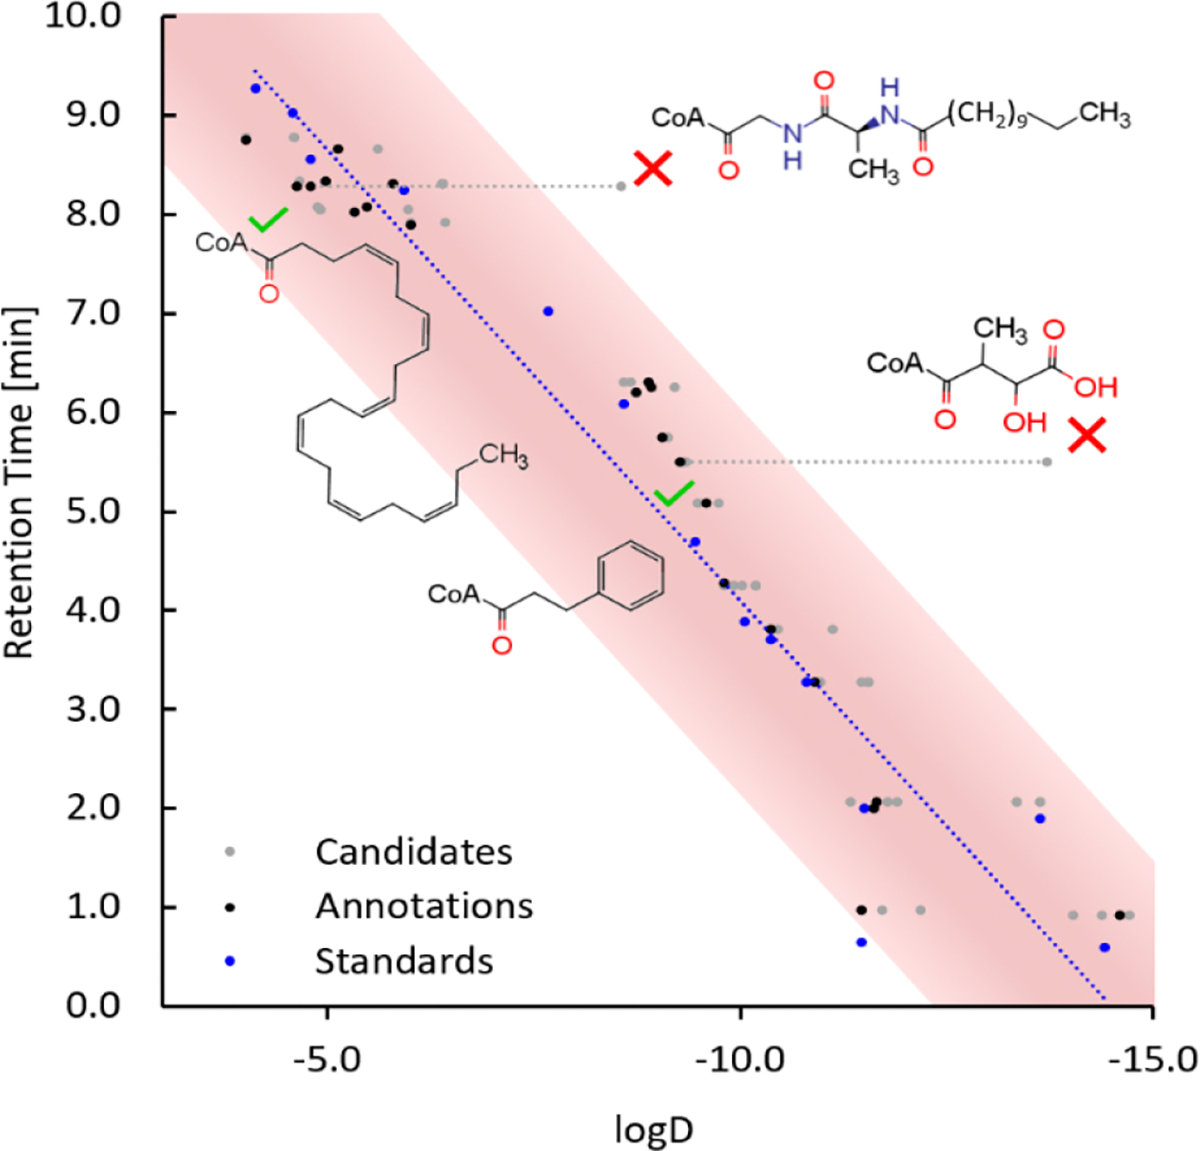
Experimental retention time and logD of 14 standards (blue), all library candidates (gray), and the selected annotations (black) based on the short-to-medium chain method. Two candidate structures eliminated by outlier logD values (red crosses), with correct structures maintained (dotted lines pointing to green check marks).
These examples show how important retention time models are to increase confidence in overall compound annotation. CoA-Blast yields matches for both classic, endogenous CoAs and also CoA-esters of xenobiotic compounds. Hence, hits from MS/MS searches within the retention time confidence intervals may still include different possible structures that needed to be further constrained. To this end, we added a biological likelihood constraint to the retention time–MS/MS chemical probability score. Here, we performed a ChemSpider search for the elemental formula of each library candidate. Table 1 summarizes these final annotations from mouse liver. When multiple isomers were possible, the compound was annotated as the generic aliphatic chain notation, while the most probable isomer from the ChemSpider search is given in parentheses. Most compounds were identified by the standard LC method, except for C20:3-CoA that was only detected by the long-chain LC method. Head-to-tail spectrum comparisons for all identified standards in positive ESI mode are available in Figure S1, for all identified standards in negative ESI mode in Figure S2, and for all identified liver acyl-CoAs in Figure S3.
Table 1.
Acyl-CoAs Detected in Mouse Livera
| # | name (MS/MS) | method | RT (exp) | m/z (exp) | m/z error (mDa) | m/z error (ppm) | logD (calc) | k’ |
|---|---|---|---|---|---|---|---|---|
|
| ||||||||
| 1* | glutathione-CoA | long | 0.46 | 1073.1906 | 0.12 | 0.11 | −19.58 | 0.0 |
| glutathione-CoA | short | 0.83 | 1073.1947 | 4.03 | 3.76 | −19.58 | 0.8 | |
| 2 | succinyl-CoA | short | 0.94 | 868.1411 | 2.56 | 2.95 | −14.58 | 1.1 |
| 3 | 3-hydroxybutanoyl-CoA | short | 2.08 | 854.1595 | 0.24 | 0.28 | −11.64 | 3.6 |
| 4 | acetyl-CoA | short | 2.00 | 810.1342 | 1.16 | 1.43 | −11.60 | 3.4 |
| 5 | free CoA | long | 0.49 | 768.1223 | 0.19 | 0.25 | −11.44 | 0.1 |
| free CoA | short | 0.98 | 768.1222 | 0.28 | 0.37 | −11.44 | 1.2 | |
| 6 | propionyl-CoA | short | 3.28 | 824.1474 | 1.28 | 1.55 | −10.90 | 6.3 |
| 7 | C4:0-CoA (isobutyryl-CoA) | short | 3.81 | 838.1649 | 0.61 | 0.73 | −10.36 | 7.5 |
| 8 | C5:0-CoA (isovaleryl-CoA) | short | 4.29 | 852.1779 | 2.07 | 2.43 | −9.80 | 8.5 |
| 9 | C6:0-CoA (hexanoyl-CoA) | short | 5.08 | 866.1960 | 0.36 | 0.42 | −9.57 | 10.3 |
| 10* | 3-phenylpropanoyl-CoA | short | 5.50 | 900.1789 | 1.10 | 1.22 | −9.25 | 11.2 |
| 11* | C7:0-CoA (2-methylhexanoyl-CoA) | short | 5.75 | 880.2101 | 1.22 | 1.39 | −9.03 | 11.8 |
| 12 | C8:0-CoA (octanoyl-CoA) | short | 6.31 | 894.2252 | 1.71 | 1.91 | −8.88 | 13.0 |
| 13* | perillyl-CoA | short | 6.22 | 916.2101 | 1.22 | 1.33 | −8.73 | 12.8 |
| 14 | C14:0-CoA (myristoyl-CoA) | short | 7.90 | 978.3201 | 0.73 | 0.75 | −6.01 | 16.6 |
| 15* | C14:1-CoA (2-tetradecenoyl-CoA) | short | 8.33 | 976.3001 | 5.08 | 5.20 | −5.78 | 17.5 |
| 16 | Cl6:1-CoA | long | 3.42 | 1004.3381 | 1.64 | 1.64 | −5.48 | 6.6 |
| Cl6:1-CoA | short | 8.07 | 1004.3369 | 0.42 | 0.42 | −5.48 | 16.9 | |
| 17 | C18:3-CoA (linolenoyl-CoA) | short | 8.03 | 1028.3320 | 4.40 | 4.28 | −5.32 | 16.8 |
| 18* | C16:0-CoA (palmitoyl-CoA) | long | 3.78 | 1006.3528 | 0.67 | 0.67 | −5.12 | 7.4 |
| C16:0-CoA (palmitoyl-CoA) | short | 8.66 | 1006.3526 | 0.49 | 0.49 | −5.12 | 18.2 | |
| 19 | C18:2-CoA (linoleyl-CoA) | long | 3.62 | 1030.3511 | 1.10 | 1.07 | −4.96 | 7.0 |
| C18:2-CoA (linoleyl-CoA) | short | 8.34 | 1030.3524 | 0.25 | 0.24 | −4.96 | 17.5 | |
| 20 | C20:4-CoA (arachidonyl-CoA) | long | 3.56 | 1054.3501 | 2.07 | 1.96 | −4.79 | 6.9 |
| C20:4-CoA (arachidonyl-CoA) | short | 8.29 | 1054.3513 | 0.85 | 0.81 | −4.79 | 17.4 | |
| 21* | C22:6-CoA | short | 8.30 | 1078.3512 | 3.06 | 2.84 | −4.63 | 17.4 |
| 22* | C20:3-CoA | long | 3.65 | 1056.3619 | 5.86 | 5.55 | −4.43 | 7.1 |
| 23 | C18:1-CoA (oleoyl-CoA) | long | 3.83 | 1032.3683 | 0.49 | 0.47 | −4.00 | 7.5 |
| C18:1-CoA (oleoyl-CoA) | short | 8.77 | 1032.3690 | 1.22 | 1.18 | −4.00 | 18.5 | |
Asterisks (*) indicate the novel spectra.
Challenges for Untargeted Analyses of Acyl-CoAs.
Acyl-CoA species are known to be sensitive to temperature and pH28 and require extra care in sample preparation. In addition to that, the large range of logD values for acyl-CoAs makes it difficult to separate them using a single method or even a single column. In our analysis, the early eluting compounds suffered from co-elution effects near the void time, and the later eluting compounds suffered from a high degree of peak tailing. These effects were only made worse by the large amount of sample that had to be injected into the column due to the low abundance of the CoA species in the sample, leading to increased matrix effects in both separation (column overload) and identification (ion suppression). Malonyl-CoA, for example, was just barely detected in the standards eluted close to the void volume and was not detected in the sample, although it was expected to be present due to its role in fatty acid metabolism. To overcome these effects, some studies suggest the use of SPE techniques to clean up the matrix before injection29 or the use of advanced separation techniques such as two-dimensional LC separation30 and targeted MS/MS acquisition techniques such as multiple reaction monitoring.28 The intent of our research was to improve the identification of acyl-CoAs in untargeted MS/MS acquisitions but not to provide a more sensitive targeted method by multireaction monitoring in triple-quadrupole or QTRAP instruments.
CONCLUSIONS
We created and validated a novel in silico library for the detection of acyl-CoA species to close the gap between the thousands of acyl-CoAs that are reported in the literature and the very few experimental MS/MS spectra that are publicly available today. CoA-Blast allows the analysis of acyl-CoAs for the two most common adduct ion forms of [M+H]+ and [M–H]− modeled specifically for Orbital ion trap and QTOF mass spectrometers using different collision energies. We validated the library on the experimentally acquired high-resolution mass spectra of a mouse liver sample in an untargeted metabolomics method and identified 23 acyl-CoAs using our CoA-Blast library, reporting a number of annotations that could only be achieved by involving targeted MS/MS approaches before this work.22,31 This success was only possible by using not only the novel CoA-Blast library but also constraining MS/MS matches by a linear retention time prediction model that successfully removed false annotations.
Supplementary Material
ACKNOWLEDGMENTS
We thank the NIST mass spectrometry group for providing the freely available NIST MS Search GUI program and help with the Lib2NIST converter and the MSPepSearch tool. We thank ModLab (University Frankfurt am Main) for providing the free SMILIB enumeration tool that was used in generating CoA-Blast. We thank ChemAxon for a free research license for the Marvin and Instant-JChem cheminformatics tools. Funding was provided by the National Institutes of Health U2C ES030158. We are grateful for the services provided by the UC Davis Mouse Biology Program (www.mousebiology.org).
Footnotes
Notes
The authors declare no competing financial interest. Library .msp spectra files, Excel template with the VBA code for library generation, chromatographic .d raw files, and structure .mol files are available for download online at github.com/urikeshet/CoA-Blast.
The CoA-Blast library is publicly available at github.com/urikeshet/CoA-Blast.
Complete contact information is available at: https://pubs.acs.org/10.1021/acs.analchem.1c03272
ASSOCIATED CONTENT
Supporting Information
The Supporting Information is available free of charge at https://pubs.acs.org/doi/10.1021/acs.analchem.1c03272.
Full tables of authentic standards, all identified compounds, information of the original spectra that were used for library rule formulation, and figures of head-to-tail spectrum comparison of all identified standards in positive and negative ESI modes (PDF)
Contributor Information
Uri Keshet, University of California Davis, Genome Center–Metabolomics, Davis, California 95616, United States.
Tobias Kind, University of California Davis, Genome Center–Metabolomics, Davis, California 95616, United States.
Xinchen Lu, University of California Davis, Genome Center–Metabolomics, Davis, California 95616, United States; College of Environmental Sciences and Engineering, Peking University, Beijing 100871, P. R. China.
Sarita Devi, University of California Davis, Genome Center–Metabolomics, Davis, California 95616, United States; St. John’s Research Institute, St. John’s National Academy of Health Sciences, Bangalore 560034, India.
Oliver Fiehn, University of California Davis, Genome Center–Metabolomics, Davis, California 95616, United States.
REFERENCES
- (1).Garrabou X; Macdonald DS; Wicky BIM; Hilvert D Angew. Chem., Int. Ed. 2018, 57, 5288–5291. [DOI] [PubMed] [Google Scholar]
- (2).Khersonsky O; Roodveldt C; Tawfik DS Curr. Opin. Chem. Biol. 2006, 10, 498–508. [DOI] [PubMed] [Google Scholar]
- (3).Njølstad PR; Skjeldal OH; Agsteribbe E; Huckriede A; Wannag E; Søvik O; Waaler PE Pediatr. Neurol. 1997, 16, 160–162. [DOI] [PubMed] [Google Scholar]
- (4).Young IS; Gaw A Lipid Metabolism. In Current Opinion in Lipidology; Elsevier, 2012; Vol. 23, pp. 503–504. [DOI] [PubMed] [Google Scholar]
- (5).Knudsen J; Neergaard TBF; Gaigg B; Jensen MV; Hansen JK Role of Acyl-CoA Binding Protein in Acyl-CoA Metabolism and Acyl-CoA- Mediated Cell Signaling. In Journal of Nutrition; American Institute of Nutrition, 2000; Vol. 130, pp. 294–298. [DOI] [PubMed] [Google Scholar]
- (6).Kabuyama Y; Suzuki T; Nakazawa N; Yamaki J; Homma MK; Homma Y Am. J. Physiol. 2010, 298, C107–C113. [DOI] [PubMed] [Google Scholar]
- (7).Ma T; Liu T; Xie P; Jiang S; Yi W; Dai P; Guo X Life Sci. 2020, 258, 118160. [DOI] [PubMed] [Google Scholar]
- (8).Abrankó L; Williamson G; Gardner S; Kerimi AJ Chromatogr. A 2018, 1534, 111–122. [DOI] [PubMed] [Google Scholar]
- (9).Redinbo MR; Potter PM Drug Discovery Today 2005, 10, 313–325. [DOI] [PubMed] [Google Scholar]
- (10).Knights K; Drogemuller C Curr. Drug Metab. 2000, 1, 49–66. [DOI] [PubMed] [Google Scholar]
- (11).Horai H; Arita M; Kanaya S; Nihei Y; Ikeda T; Suwa K; Ojima Y; Tanaka K; Tanaka S; Aoshima K; Oda Y; Kakazu Y; Kusano M; Tohge T; Matsuda F; Sawada Y; Hirai MY; Nakanishi H; Ikeda K; Akimoto N; Maoka T; Takahashi H; Ara T; Sakurai N; Suzuki H; Shibata D; Neumann S; Iida T; Tanaka K; Funatsu K; Matsuura F; Soga T; Taguchi R; Saito K; Nishioka TJ Mass Spectrom. 2010, 45, 703–714. [DOI] [PubMed] [Google Scholar]
- (12).Kind T; Liu KH; Lee DY; Defelice B; Meissen JK; Fiehn O Nat. Methods 2013, 10, 755–758.ž [DOI] [PMC free article] [PubMed] [Google Scholar]
- (13).Ding J; Kind T; Zhu QF; Wang Y; Yan JW; Fiehn O; Feng YQ Anal. Chem. 2020, 92, 5960–5968. [DOI] [PMC free article] [PubMed] [Google Scholar]
- (14).Blaženović I; Kind T; Sa MR; Ji J; Vaniya A; Wancewicz B; Roberts BS; Torbašinović H; Lee T; Mehta SS; Showalter MR; Song H; Kwok J; Jahn D; Kim J.; Fiehn O Anal. Chem. 2019, 91, 2155–2162. [DOI] [PMC free article] [PubMed] [Google Scholar]
- (15).Wishart DS; Knox C; Guo AC; Cheng D; Shrivastava S; Tzur D; Gautam B; Hassanali M Nucleic Acids Res. 2008, 36, D901–D906. [DOI] [PMC free article] [PubMed] [Google Scholar]
- (16).ChemAxon - Software Solutions and Services for Chemistry & Biology https://chemaxon.com/ (accessed Jul 20, 2020).
- (17).Heller SR; McNaught A; Pletnev I; Stein S; Tchekhovskoi D Aust. J. Chem. 2015, 7, 23. [DOI] [PMC free article] [PubMed] [Google Scholar]
- (18).Chemistry Software for Analytical and Chemical Knowledge Management https://www.acdlabs.com/ (accessed Jul 20, 2020).
- (19).Matthew Monroe http://www.alchemistmatt.com/ (accessed Jul 20, 2020).
- (20).NIST MS Search Program https://chemdata.nist.gov/mass-spc/ms-search/ (accessed Jul 20, 2020).
- (21).peptidew:mspepsearch https://chemdata.nist.gov/dokuwiki/doku.php?id=peptidew:mspepsearch#ms_pepsearch (accessed Jul 20, 2020).
- (22).Liu X; Sadhukhan S; Sun S; Wagner GR; Hirschey MD; Qi L; Lin H; Locasale JW Mol. Cell. Proteomics 2015, 14, 1489–1500. [DOI] [PMC free article] [PubMed] [Google Scholar]
- (23).Koelmel JP; Kroeger NM; Gill EL; Ulmer CZ; Bowden JA; Patterson RE; Yost RA; Garrett TJ J. Am. Soc. Mass Spectrom. 2017, 28, 908–917. [DOI] [PMC free article] [PubMed] [Google Scholar]
- (24).Stein SE; Scott DR J. Am. Soc. Mass Spectrom. 1994, 5, 859–866. [DOI] [PubMed] [Google Scholar]
- (25).Kind T; Tsugawa H; Cajka T; Ma Y; Lai Z; Mehta SS; Wohlgemuth G; Barupal DK; Showalter MR; Arita M; Fiehn O Mass Spectrom. Rev. 2018, 37, 513–532. [DOI] [PMC free article] [PubMed] [Google Scholar]
- (26).Tsugawa H; Cajka T; Kind T; Ma Y; Higgins B; Ikeda K; Kanazawa M; Vandergheynst J; Fiehn O; Arita M Nat. Methods 2015, 12, 523–526. [DOI] [PMC free article] [PubMed] [Google Scholar]
- (27).Bonini P; Kind T; Tsugawa H; Barupal DK; Fiehn O Anal. Chem. 2020, 92, 7515–7522. [DOI] [PMC free article] [PubMed] [Google Scholar]
- (28).Gao L; Chiou W; Tang H; Cheng X; Camp HS; Burns DJJ Chromatogr., B: Anal. Technol. Biomed. Life Sci. 2007, 853, 303–313. [DOI] [PubMed] [Google Scholar]
- (29).Magnes C; Suppan M; Pieber TR; Moustafa T; Trauner M; Haemmerle G; Sinner FM Anal. Chem. 2008, 80, 5736–5742. [DOI] [PubMed] [Google Scholar]
- (30).Wang S; Wang Z; Zhou L; Shi X; Xu G Anal. Chem. 2017, 89, 1290212908. [DOI] [PubMed] [Google Scholar]
- (31).Cakić N; Kopke B; Rabus R; Wilkes H Anal. Bioanal. Chem. 2021, 413, 3599–3610. [DOI] [PMC free article] [PubMed] [Google Scholar]
Associated Data
This section collects any data citations, data availability statements, or supplementary materials included in this article.


