

Abstract
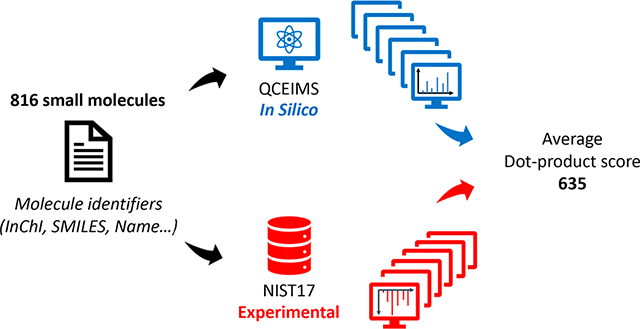
Chemical derivatization, especially silylation, is widely used in gas chromatography coupled to mass spectrometry (GC-MS). By introducing the trimethylsilyl (TMS) group to substitute active hydrogens in the molecule, thermostable volatile compounds are created that can be easily analyzed. While large GC-MS libraries are available, the number of spectra for TMS-derivatized compounds is comparatively small. In addition, many metabolites cannot be purchased to produce authentic library spectra. Therefore, computationally generated in silico mass spectral databases need to take TMS derivatizations into account for metabolomics. The quantum chemistry method QCEIMS is an automatic method to generate electron ionization (EI) mass spectra directly from compound structures. To evaluate the performance of the QCEIMS method for TMS-derivatized compounds, we chose 816 trimethylsilyl derivatives of organic acids, alcohols, amides, amines, and thiols to compare in silico-generated spectra against the experimental EI mass spectra from the NIST17 library. Overall, in silico spectra showed a weighted dot score similarity (1000 is maximum) of 635 compared to the NIST17 experimental spectra. Aromatic compounds yielded a better prediction accuracy with an average similarity score of 808, while oxygen-containing molecules showed lower accuracy with only an average score of 609. Such similarity scores are useful for annotation of small molecules in untargeted GC-MS-based metabolomics, suggesting that QCEIMS methods can be extended to compounds that are not present in experimental databases. Despite this overall success, 37% of all experimentally observed ions were not found in QCEIMS predictions. We investigated QCEIMS trajectories in detail and found missed fragmentations in specific rearrangement reactions. Such findings open the way forward for future improvements to the QCEIMS software.
Graphical Abstract
Gas chromatography coupled to mass spectrometry (GC-MS) requires volatile compounds for analysis. The generation of volatile derivatives from polar or thermo-labile compounds using silylation derivatization reactions is still the first choice for many modern applications.1 The most common reagents for such applications are MSTFA (N-methyl-N-(trimethylsilyl) trifluoroacetamide), TMCS (trimethylchlorosilane), BSA (N,O-bis(trimethylsilyl)acetamide), and BSTFA (N,O-bis(trimethylsilyl) trifluoroacetamide).2 Reactive functional groups that can be silylated with these reagents under mild conditions include alcohols, aldehydes, carboxylic acids, amines, amides, thiols, and inorganic acids.2
Silylation is used in many applications including medical investigations, metabolic profiling, toxicological screening, and environmental research.3,4 All these approaches use mass spectral library matching for compound annotations and identifications. An experimental spectrum is compared against a reference spectrum in a database. The reference spectra were obtained from authentic reference compounds that underwent silylation reactions.
Licensed libraries such as Wiley or NIST205 contain around 5000 TMS derivatives. Smaller TMS libraries for GC-MS4,6,7 are also freely available in MassBank of North America (https://massbank.us/), including retention indices that are used to improve automatic compound annotations. However, these libraries contain less than 3000 compounds combined, which is in stark contrast to the estimated 300,000 known natural products8 and the more than 12 million commercially available compounds of more than 100 million known structures in PubChem. Furthermore, many silylation reactions are incomplete. While hydroxyls, thiols, and carboxylic acid moieties are always completely derivatized, primary and secondary amines may be not be exhaustively derivatized.9
Even with softer chemical ionization and accurate mass GC-MS, it is very difficult to elucidate the structures of unknown compounds.10 To increase the size of available EI-MS libraries, mass spectra can be predicted in silico from molecular structures.11 While machine learning models have been used to model TMS compound spectra, accuracy in EI-MS predictions was found to be lacking.12,13 EI-MS spectra also can be predicted from first-principles simulation by quantum chemical modeling using QCEIMS14–17 with the semi-empirical GFNn-xTB18–20 method. Recent work showed that in silico spectra generated by QCEIMS can help structure elucidation and identify unknowns.21 However, these methods have not been tested so far on TMS-derivatized molecules. We here present data testing the performance of QCEIMS to generate theoretical mass spectra for a diverse set of compound classes using 816 TMS-derivatized compounds.
METHODS
Parallel Fragmentation Prediction.
To test the general performance of QCEIMS for TMS-derivatized compounds (Figure 1), 816 molecules with TMS groups at less than 700 Da were selected from the NIST17 mass spectral database. While we used mono-TMS compounds to test the impact of TMS derivatives on different compound classes, we also calculated nine doubly (2TMS) and nine triply (3TMS) silylated derivatives to demonstrate the extensibility of the QCEIMS method. Starting with the IUPAC International Chemical Identifier (InChI), we generated 3D structures with the Merck Molecular Force Field (MMFF9422) and saved them in mol (∗.mol) and TurboMole format (∗.tmol) using OpenBabel (v2.3.90).23 We then used QCEIMS (v4.0) to generate in silico mass spectra, for which a new version QCxMS24 including an EI-MS prediction module has recently been released at https://github.com/qcxms/QCxMS. Details of partitioning the components of kinetic energy into translational, rotational, and vibrational energies are given in the Supporting Information.25 Default settings for QCEIMS were used, with GFN1-xTB18 used for force/energy calculations and IPEA parameters used for ionization potential (IP) calculations. The CYLview26 program was used to visualize compound structures.
Figure 1.
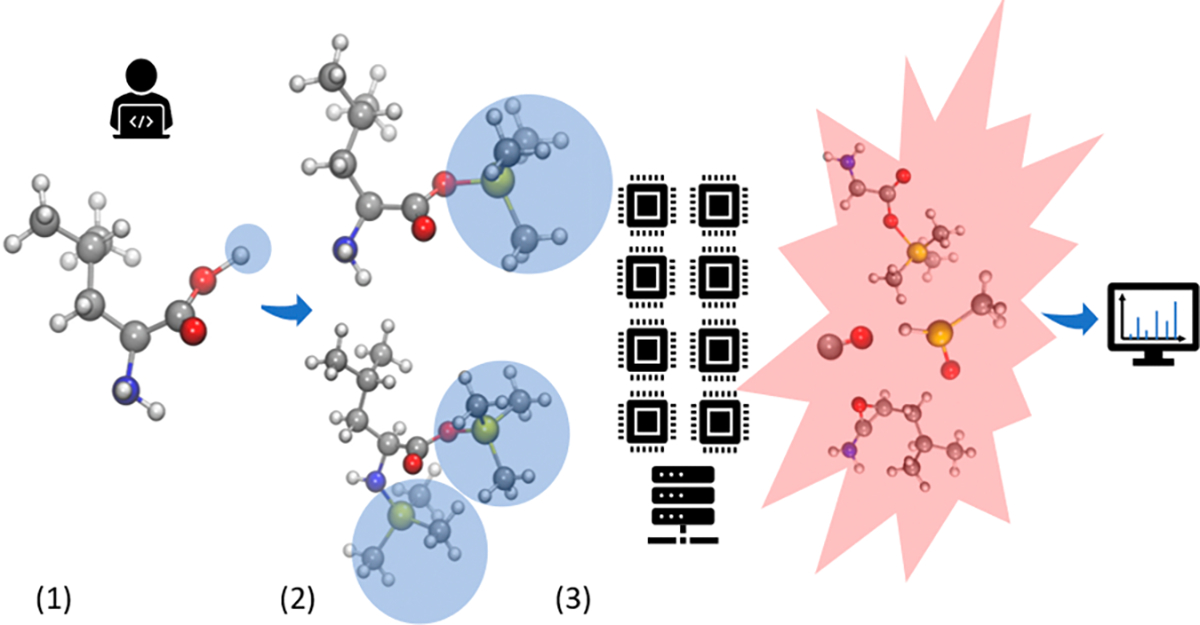
QCEIMS workflow of TMS derivatives: (1) substituting the active hydrogen of test molecules with trimethylsilyl groups, (2) generating 3D structures and initial conditions for QCEIMS, and (3) parallel simulation to get fragments and in silico spectra.
Substructure Compound Classification.
Chemical compounds can be classified by substructure analysis into many different classes.27 To evaluate the simulation accuracy on different compound classes, we here used the α-position of heteroatoms next to the silicon in TMS groups to classify compounds. For example, if the α-heteroatom belonged to a carboxyl substructure, such compounds were annotated as acid, regardless which other functional groups were present in the molecule. A Python script based on RDKit28 was used to classify molecules into five main compound classes: alcohols, acids, amines, amides, and thiols. A detailed classification tree is presented in Scheme S1.
In Silico Accurate Mass Spectra.
The QCEIMS program currently generates integer mass-to-charge ratios. One advantage of using quantum chemistry for MS simulations is that the type and frequency of molecule fragments are counted, while element and isotopic masses are computed. Therefore, we programmed an extension to the QCEIMS program that also incorporates accurate isotopic masses for elemental compositions (Supporting Information, Zenodo repository). Such accurate mass in silico spectra are important when using high-resolution GC-MS instruments, which are increasingly used during structure elucidation of unknown compounds detected by GC-MS.10,29
In Silico Mass Spectrum Annotation.
Experimental mass spectra in the NIST17 database were used as the true positive examples to evaluate the accuracy of in silico spectra generated by the QCEIMS process. Cosine similarity scores and modified dot product scores were used for spectra comparison.11
| (1) |
| (2) |
where is the mass-weighted peak intensity, and subscript denotes the in silico intensity and the experimental intensity.
MassFrontier 7.030 was utilized to help annotate m/z peaks and neutral losses for all 70 eV mass spectra.
Accurate Mass GC-MS Analysis.
Accurate mass spectra were acquired on an Agilent 7890A GC system with an Agilent 7200 accurate mass quadrupole time-of-flight (Q-TOF) mass spectrometer system (Agilent Technologies, Santa Clara, CA, U.S.A.). Chemicals were derivatized with 10 μL of methoxyamine hydrochloride in pyridine (20 mg/mL) to protect aldehyde or ketone groups and then trimethylsilylated to increase volatility by 90 μL N-methyl-N-(trimethylsilyl)-trifluoroacetamide (MSTFA). Previously published gas chromatographic conditions were used.31 Mass spectra were obtained from m/z 50 to 800 at a 5 Hz scan rate in electron ionization mode with electron energy of 70 eV.
RESULTS AND DISCUSSION
Trajectory Analysis of In Silico Predictions of Fragmentations in Electron Ionization Spectra.
One advantage of first-principles simulation is that we can follow molecular dynamics (MD) trajectories during the fragmentation reactions. In this way, we can annotate observed m/z fragment ions with fragmentation substructures that provide insights into reaction mechanisms.32,33 Selections of representative head-to-tail mass spectral comparisons including MD trajectories are given in the Supporting Information (Figures S1–S8). Experimental mass spectra represent the likelihood and frequency of many stochastic fragmentation events. Therefore, many trajectories are combined into simulated spectra when using QCEIMS. We first exemplify this principle on a few typical mass spectra from different compound classes. As an example of an aliphatic acid, the head-to-tail comparison of the QCEIMS-predicted fragmentation of O-trimethylsilylleucine to the experimental NIST17 library spectrum (Figure 2) shows that many experimental observed ions were indeed correctly predicted by simulation. However, the ion intensities were often found to be different between predicted and experimental spectra, yielding a low dot score MS similarity. For example, the [M-15]+ fragment ion m/z 188 was predicted at 70% of base peak abundance, compared to the experimentally found 26% abundance. Similarly, the [M-89]+ fragment ion at m/z 114 was predicted at 14% abundance compared to an experimental 2% abundance. Such disagreements in ion relative abundances heavily distort dot score similarity calculations. We therefore set out to better understand the QCEIMS trajectories that led to ion formation. Relative abundances are determined by the prevalence of trajectories leading to specific fragments. QCEIMS spectra account for all charged fragments from all trajectories. We used 25 trajectories per atom for each molecule, guided by the idea that large molecules may have more options of fragmentations than smaller ones.14 For example, the simulation of leucine-OTMS with 34 atoms accumulated a total of 850 trajectories. Twenty-seven trajectories resulted in the formation of the [M-89]+ fragment ion (m/z 114, Figure 2) with an average trajectory length of 900 fs and a median trajectory length of 857 fs. The QCEIMS method predicted two fragmentation pathways: (1) In 24 trajectories, a loss of •CH3 was followed by a loss of OSi(CH3)2 (Figure 2a, b) (2) In three trajectories, a loss of a TMSO• radical was found (Figure 2c). For calculating the relative abundance of ions in QCEIMS spectra, the stabilities of ions are estimated by comparing the statistical charges of fragments to their ionization potentials, which are weighted by the Boltzmann distribution. Because of this weighting method, the same [M-89]+ fragment ions in pathways (1) and (2) show extremely different statistical charges. The statistical charge for the 27 trajectories in pathway (1) is almost +1, while the three trajectories of pathway (2) have an average statistical charge of 0.04. In addition, we considered the impact excess energy (IEE), which denotes the residual energy introduced by the electron impact after ionizing the neutral molecule. For the 27 trajectories that generated the [M-89]+ fragment ion, an average IEE of 25 eV was found. In contrast, for the 48 trajectories that stopped after a loss of a methyl group, an average IEE of 16 eV was found. This lower IEE thus led trajectories to remain at [M-15]+ fragment ions without subsequent secondary fragmentations. We also found that [M-15]+ fragmentations were exclusively associated with methyl losses from the TMS group but not from the branched leucine carbon backbone. For the predicted [M-15]+ fragment ion, an average trajectory length of 1625 fs and median trajectory of 1066 fs were found. In comparison, therefore, the [M-89]+ fragment will be formed faster but only under conditions that lead to higher impact excess energy.
Figure 2.
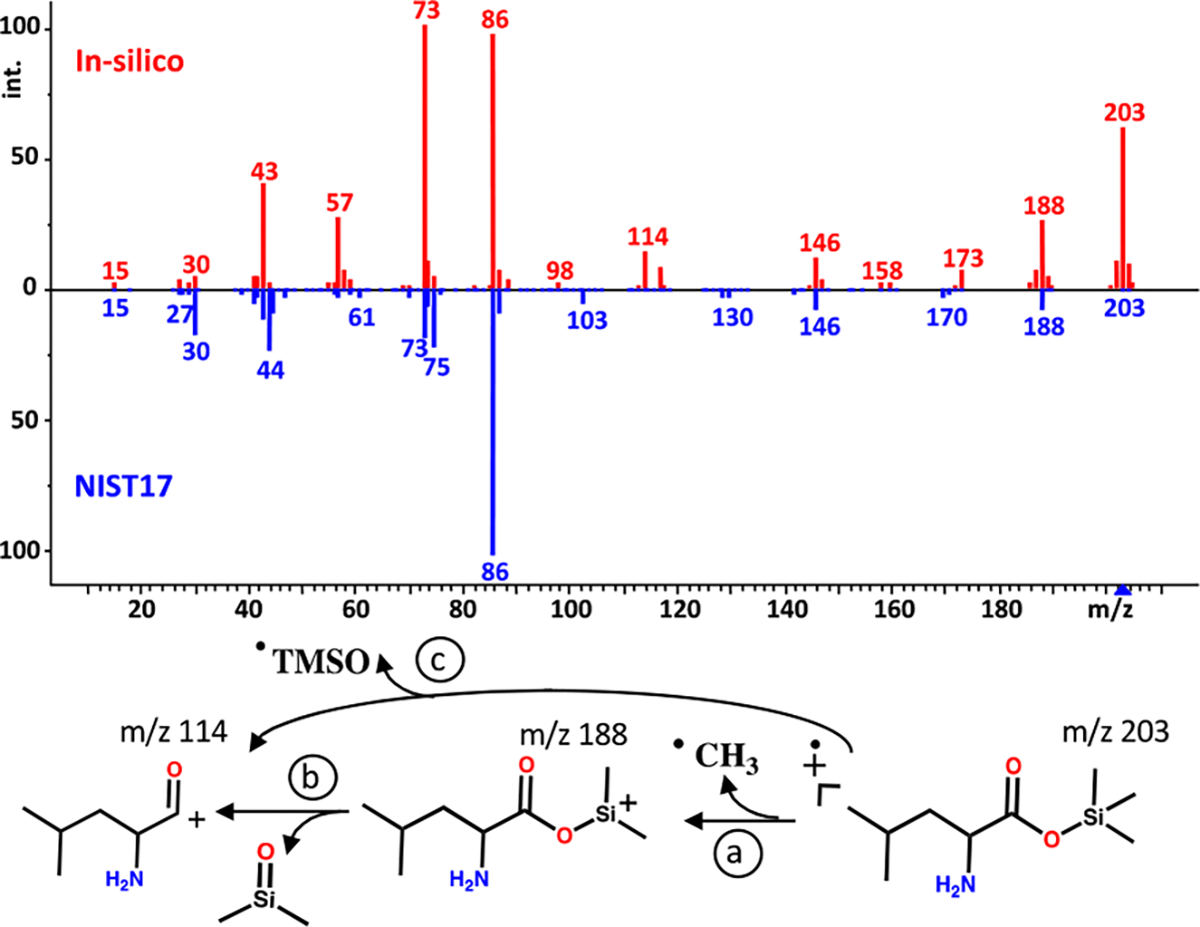
Fragmentation of leucine-OTMS modeled by QCEIMS compared to the experimental mass spectrum from the NIST17 mass spectral library. (Bottom) Alternative fragmentation mechanisms (a–c) as detailed by QCEIMS trajectories. https://mona.fiehnlab.ucdavis.edu/spectra/display/MoNA040855.
Previous papers have shown that statistical models purely based on IEE values are insufficient to predict experimental mass spectra.34,35 Aside from the IEE, the distribution of energy within a molecule may also influence the likelihood of specific fragmentation pathways. We therefore analyzed fragmentation of leucine-OTMS from this perspective. To evaluate the effect of energy distributions, we performed an energy partition analysis36 on trajectories #494 and #499, which yielded fragment ions m/z 114 ([M-89]+ ion) and m/z 188 ([M-15]+ ion) (Figure 3). Energy distribution plots of substructures often show oscillations throughout the trajectories, but the timing of fragmentations indeed to coincide with the most drastic changes in energy distributions. For example, in the trajectory leading to the m/z 188 ion (Figure 3, lower panel), the methyl substructure showed significant vibrational energy at 80 fs that led to bond stretching, but the actual fragmentation and generation of the methyl radical only appeared at around 240 fs. In comparison, for the m/z 114 ([M-89]+ ion trajectory #494, the methyl radical departed at around 200 fs, and subsequently, a OSi(CH3)2 fragment departed at around 400 fs. At 380 fs, an intermediate structure was observed with a four-membered ring (Figure 3, upper panel insert). We also separated and validated the transition state structure for the methyl group loss in Figure S12. For both trajectories #494 and #499, methyl substructures showed increases in vibrational energy of around 240–280 fs that led to fragmentation reactions. However, in trajectory #499, the vibrational energy was distributed within the leucine-ODMS substructure, whereas in trajectory #494, the vibrational energy was rapidly distributed to the OSi(CH3)2 substructure. After a final energy redistribution to the dimethylsilanone substructure at around 420 fs, the loss of a neutral OSi(CH3)2 fragment occurred. In conclusion, analyses of QCEIMS trajectories, despite relying on the imperfect harmonic oscillator approximation, reveal how the distribution of vibrational energy can influence the directions of reactions and explain the prevalence of different reaction pathways.
Figure 3.
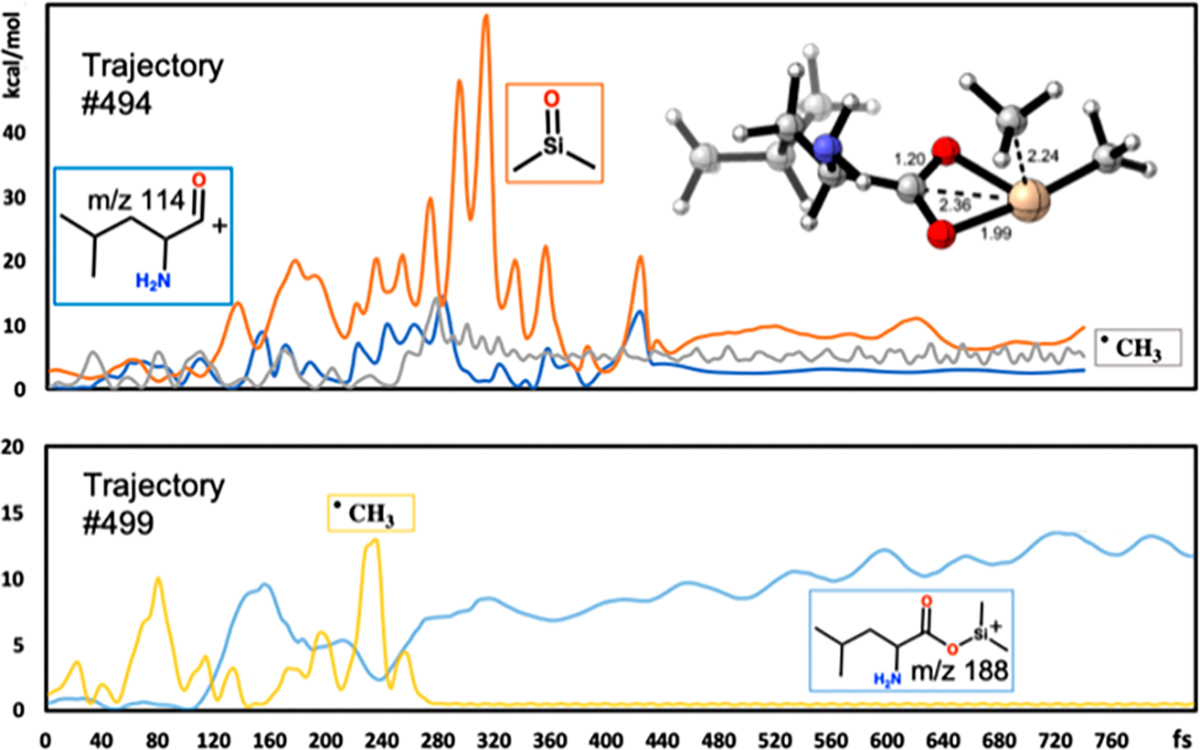
Temporal change of vibrational energy of substructures during the fragmentation of leucine-OTMS as modeled by QCEIMS for two individual trajectories. (Top) Trajectory #494 leading to substructure m/z 114 (blue), substructure dimethylsilanone (orange), and substructure methyl-group (gray). Inset: reaction intermediate observed at 380 fs. (Bottom) Trajectory #499 leading to substructure m/z 188 leucine-ODMS (light blue) and substructure methyl group (yellow).
Mass Spectral Fragmentation Rules.
Over decades of interpreting electron ionization mass spectra, characteristic product ions have been determined for specific molecular substructures,37 including for trimethlysilylated compounds used in metabolomics.29 We therefore investigated if our MD simulations correctly predicted such product ions. Here, we provide detailed information on fragmentation for two molecules, with additional examples given for other compound classes in Figures S2–S8. The aromatic acid trimethylsilyl-4-methoxybenzoate (Figure 4) was predicted to form the molecular radical ion in a higher abundance than experimentally observed. For aromatic acids and their derivatives, five product ions have been described as characteristic fragments.29 Among these, the [M-CH3]+ and [M-OTMS]+ neutral losses were accurately predicted with QCEIMS simulations (Figure 4b). The m/z 194 ion could be produced in two different ways, either as a secondary methyl loss from a m/z 209 ion leading to a m/z 194.039 radical cation that was also found when we analyzed this molecule using accurate mass GC-QTOF MS (Figure S9) but not the alternative m/z 194.076 ion that would have resulted from a neutral loss of O=CH2 from the 4-methoxy group. Similarly, the m/z 135.045 ion was correctly predicted by QCEIMS to arise from a neutral loss of TMSO* and not as an alternative product with m/z 135.024 (C8H11Si) that would have been formed by a literature-described four-membered ring rearrangement (Figure 4b).38 These examples show that QCEIMS can produce mechanistic predictions that were experimentally verified by accurate mass GC-QTOF MS measurements.
Figure 4.
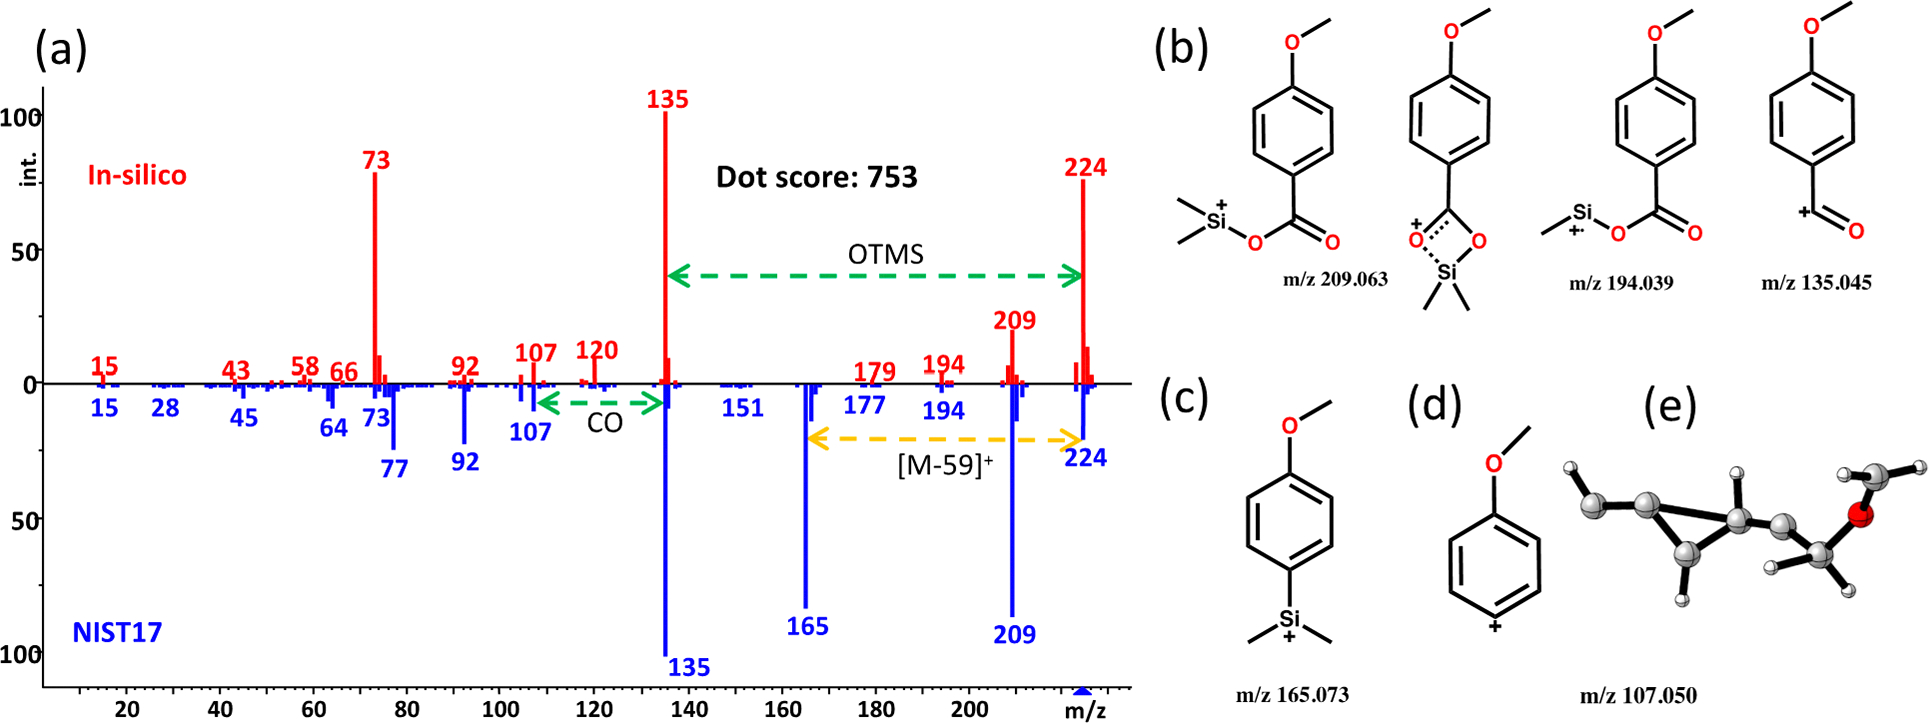
Fragmentation analysis of trimethylsilyl-4-methoxybenzoate as an example of aromatic carboxylates. (a) Head-to-tail comparison of QCEIMS prediction against the experimental NIST17 library spectrum. (b) Proposed structures predicted by QCEIMS simulation and validated by accurate mass GC-QTOF MS measurements. (c) Proposed structure of experimentally found rearrangement product m/z 165. (d) Proposed aromatic structure for fragment ion m/z 107 along with a high energy structure predicted by QCEIMS trajectories. (e) Energetically unstable structures observed. In silico spectrum available at https://mona.fiehnlab.ucdavis.edu/spectra/display/MoNA040747.
However, the neutral loss of CO2 from a m/z 209 species to form a m/z 165.073 fragment (Figure 4c) via a four-membered ring arrangement was not correctly predicted by QCEIMS. Using the rule-based MassFrontier software,31 this ion likely originates from a rearrangement reaction in which the silicon is transferred to the benzene ring through a four-membered transition structure with CO2 as the leaving group.38 Two arguments may explain this observation. First, the high energy transition structure itself can only be accessed if a specific initial conformation is formed, similar to conformer-defined reactions simulated previously.39 This example demonstrates that QCEIMS predictions could be improved by more comprehensive conformer sampling to correctly accommodate the probabilities of alternative reaction pathways. Second, our simulation time was limited to a few picoseconds (10−12 s). Rearrangement reactions in mass spectrometry may reach a time scale from 10−11 to 10−6 s40 which is too long to be simulated by molecular dynamics methods.
QCEIMS predictions also correctly matched the experimental accurate mass m/z 107.050 for [C7H7O]+ leading to a distributed positive charge along the aromatic ring (Figure 4d). However, several trajectories were also detected that led to other energetically unstable structures through ring-opening reactions (Figure 4e). Such trajectories may contribute to incorrect predictions of relative ion intensities. We also found that the m/z 77 for the benzyl cation and m/z 92 for C6H4O+• were underestimated by the simulation. These two fragments were generated by two continuous fragmentations, highlighting the importance of considering multiple step fragmentations and the length of simulation times.
In QCEIMS predictions for primary alcohols, many fragment ions correctly matched experimentally observed ions (Figure 5a): m/z 209 for [M-15] +, m/z 103 for TMS-OCH2+, m/z 73 for TMS+ ions, and m/z 59 for (CH3)2SiH+.29 The characteristic m/z 73 TMS+ ions are generated by Si–O bond dissociations. Errors in predicting ion abundances are likely due to inaccurate estimations of the dissociation energies of oxygen–silicon bonds. QCEIMS-predicted different trajectories that led to two distinct fragment structures for the m/z 194 peak (Figure 5b): C11H18OSi+• (m/z 194.112) and C10H14O2Si+• (m/z 194.076) in an intensity ratio of 1:25. Nine trajectories showed a seven-membered ring rearrangement reaction en route to the m/z C10H14O2Si+• peak (Figure 5c). Both fragment ions were confirmed experimentally by high resolution GC-QTOF MS (Figure S10), albeit with a different relative intensity ratio of 2:9. Nevertheless, this observation shows that QCEIMS can correctly predict rearrangement reactions.
Figure 5.
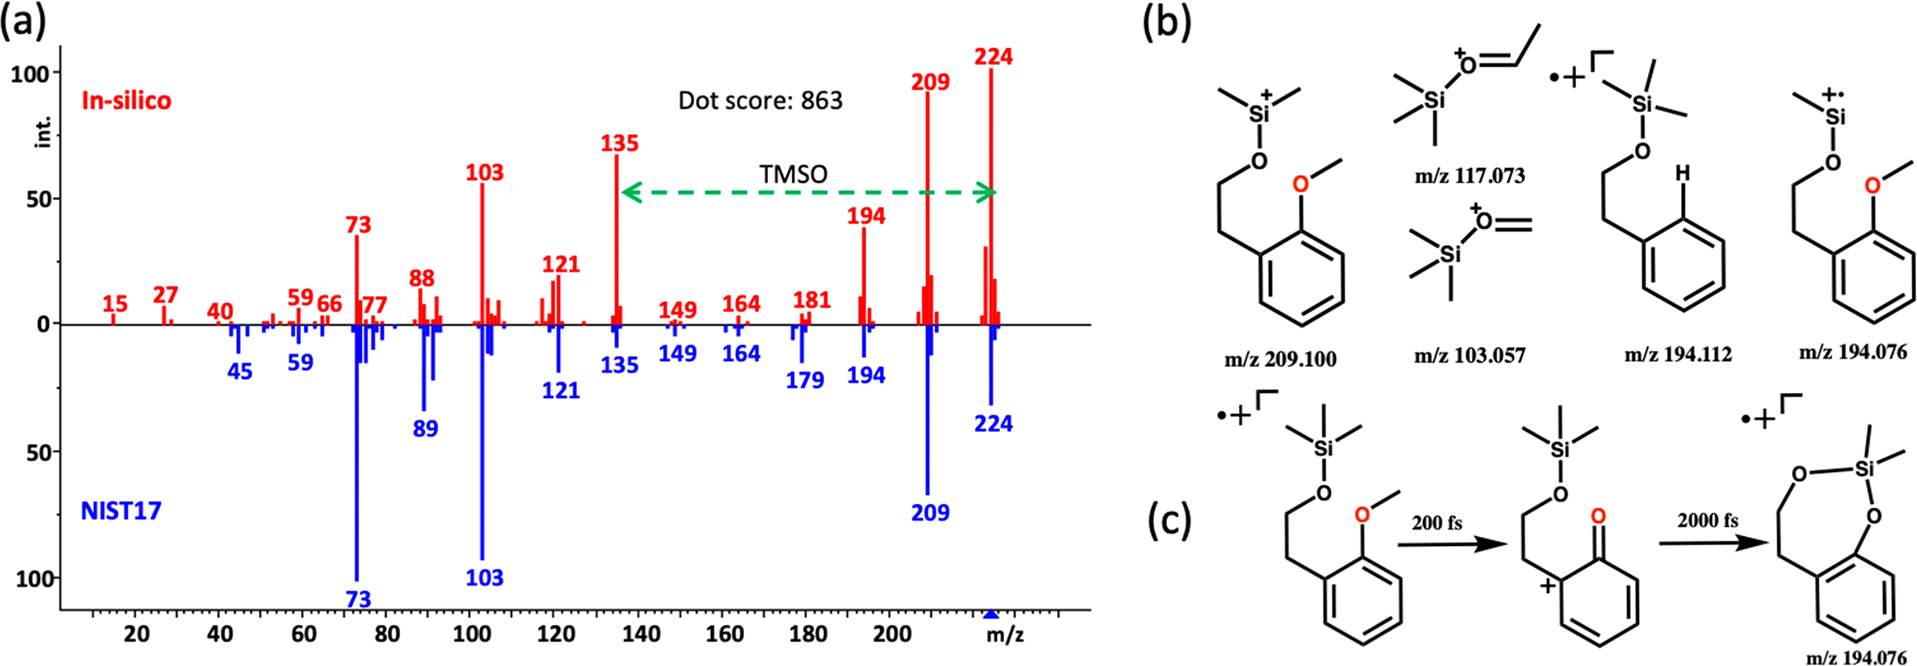
Fragmentation analysis of trimethylsilylated 2-methoxyphenylethanol as an example of primary alcohols. (a) Head-to-tail comparison of QCEIMS prediction against the experimental NIST17 library spectrum. (b) Examples of correctly QCEIMS-predicted fragment ions. (c) Seven-membered ring structure of m/z 194.076. https://mona.fiehnlab.ucdavis.edu/spectra/display/MoNA040546.
Average Accuracy of QCEIMS Predictions for Different Compound Classes.
To obtain an overview how accurate the QCEIMS approach is for predicting TMS-derivatized mass spectra for different classes of typical metabolites, we calculated spectra for a total of 816 molecules. All QCEIMS-predicted spectra have been uploaded to MassBank (https://massbank.us/). Molecules were selected by following the frequency distribution of chemical classes in the NIST database. A discussion of simulation time can be found in Figure S11. We summarized all structures into five major compound classes (Table 1) and subdivided these into aromatic and aliphatic structures by the location of the TMS-derivatized heteroatom (Figure S1). We had previously shown for QCEIMS predictions of underivatized molecules that mass-weighted dot score similarities were better suited than cosine scores for matching predicted to experimental spectra.11 We found the same trend for TMS-derivatized compounds here and therefore only present the mass-weighted dot score match factors (Table 1). Detailed comparisons for cosine and dot score similarities are given for all 816 compounds in Table S1. Across all compound subclasses, dot score similarities ranged from 532 to 847 when compared to standard 70 eV spectra in the NIST17 database (Table 1). In addition, for 18 example molecules, we showed that the QCEIMS approach can be extended to 2TMS and 3TMS derivatives (Table S2). The nine tested 2TMS derivatives yielded an average dot product score of 615, whereas the nine tested 3TMS derivatives only gave an average dot product score of 449. Short QCEIMS simulation times may become even more detrimental for predicting intramolecular rearrangements for molecules with multiple TMS groups, for example, for predicting fragments such as m/z 147 for TMS-diols.38
Table 1.
Matching 816 QCEIMS Theoretical Spectra Against NIST17 Experimental Spectra Using Weighted Dot Product and Jaccard Similarity Indicesa
| Superclass | Subclass | Count | Dot score | Jaccard |
|---|---|---|---|---|
| acids | total | 211 | 605 ± 183 | 0.51 ± 0.10 |
| aromatic | 50 | 710 ± 123 | 0.49 ± 0.10 | |
| aliphatic | 161 | 572 ± 187 | 0.51 ± 0.10 | |
| alcohols | total | 443 | 611 ± 224 | 0.53 ± 0.13 |
| aromatic | 117 | 832 ± 79 | 0.52 ± 0.15 | |
| aliphatic | 326 | 532 ± 206 | 0.53 ± 0.13 | |
| amides | total | 30 | 727 ± 152 | 0.56 ± 0.12 |
| aromatic | 14 | 806 ± 34 | 0.59 ± 0.11 | |
| aliphatic | 16 | 658 ± 181 | 0.52 ± 0.13 | |
| amines | total | 106 | 744 ± 186 | 0.58 ± 0.13 |
| aromatic | 50 | 838 ± 95 | 0.56 ± 0.12 | |
| aliphatic | 56 | 661 ± 208 | 0.60 ± 0.13 | |
| thiols | total | 26 | 743 ± 186 | 0.49 ± 0.11 |
| aromatic | 15 | 847 ± 31 | 0.55 ± 0.04 | |
| aliphatic | 11 | 601 ± 217 | 0.41 ± 0.11 |
Averages of ± standard deviations are given.
Two important differences were noted when comparing mass spectral similarity scores between experimental and QCEIMS-predicted spectra across all compound classes. (1) Most aromatic compounds yielded a significantly higher similarity score than corresponding aliphatic compounds of the same class, with the exception of aromatic and aliphatic acids, which yielded comparable scores. (2) Average mass-weighted dot scores of oxygen-containing compounds (acids, alcohols) were significantly lower than other compound classes (amides, amines, thiols).
When inspecting head-to-tail comparisons of mass spectra (Figures 2, 4, and 5 and Figures S1–S8), we found that spectra with low dot score similarities usually exhibited disagreements in the high m/z peak region, especially with respect to the presence and abundance of the molecular ion peak (M+•). The high m/z region is given especially large weight in the weighted dot score calculation that is used in GC-MS analyses,41 and hence, differences in M+• abundances heavily contribute to lower scores. The radical ion produced for aromatic compounds can be stabilized through π-delocalization which leads to high ion intensities for both predicted and experimental spectra and ultimately a high weighted dot similarity score. When comparing the prediction errors across the different functional groups (superclasses), it was clearly noted that both alcohols and acids showed a large difference in M+• abundances between predicted and experimental spectra. In comparison, intensities for M+• molecular ions were more predictable for thiols and amides and, to some extent, also for amines. This finding confirms our previous results for nonsilylated compounds that also had shown worse matching scores for oxygen-containing molecules compared to molecules without oxygen atoms.11
Relationship of MS-Similarity Score to QCEIMS Spectral Predictions.
Overall dot score similarities are heavily influenced by predicted ion intensities. However, the current accuracy of QCEIMS predictions can also be evaluated based on the number of ions that were correctly simulated by QCEIMS trajectories, in relation to ions that were predicted but not experimentally validated, and ions that were experimentally found but not predicted. This evaluation can be mathematically expressed by the Jaccard index
where are predicted ions, and experimental ions. is the intersection of ions found in both predicted and experimental spectra, and is the complement of both predicted and experimental ions. Therefore, the Jaccard index ranges from 0 (if no ion is correctly predicted) to 1 (if all ions are correctly predicted). Because the generation of ions is an inherently stochastic process and as the QCEIMS model used here limited the number of tested trajectories to 25 times the number of atoms per molecule, we limited the calculation of Jaccard indices to ions that were found at more than 1% intensity of the base peak ions.
Overall, an average of 53% of all experimental ions were correctly predicted by the QCEIMS method for the 816 trimethylsilylated molecules examined (Figure 6, Table 1), showing that quantum chemistry for electron ionization spectra is both scalable for hundreds of molecules and can produce useful true positive rates. Interestingly, the Jaccard index shows that we have on average a higher proportion of fragment ions that were experimentally found but not QCEIMS-predicted than incorrect predictions by QCEIMS that were not experimentally validated (Figure 6). This observation shows that a range of fragmentation reactions were not located using QCEIMS, for example, the rearrangement via a four-membered ring transition structure in Figure 5 (missing ion m/z 165). Other reactions that heavily depend on conformational or electronic states are likely undersampled, for example, hydrogen migration reactions. When we investigated the degree of Jaccard index accuracy with respect to different substructures, no statistical difference was found (Table 1), unlike for overall dot product similarities. Similarly, when we investigated the dependency of dot score similarities of QCEIMS-predicted spectra versus the Jaccard index errors, no significant impact was evident for the relative contribution of overpredicted ions or underpredicted ions.
Figure 6.
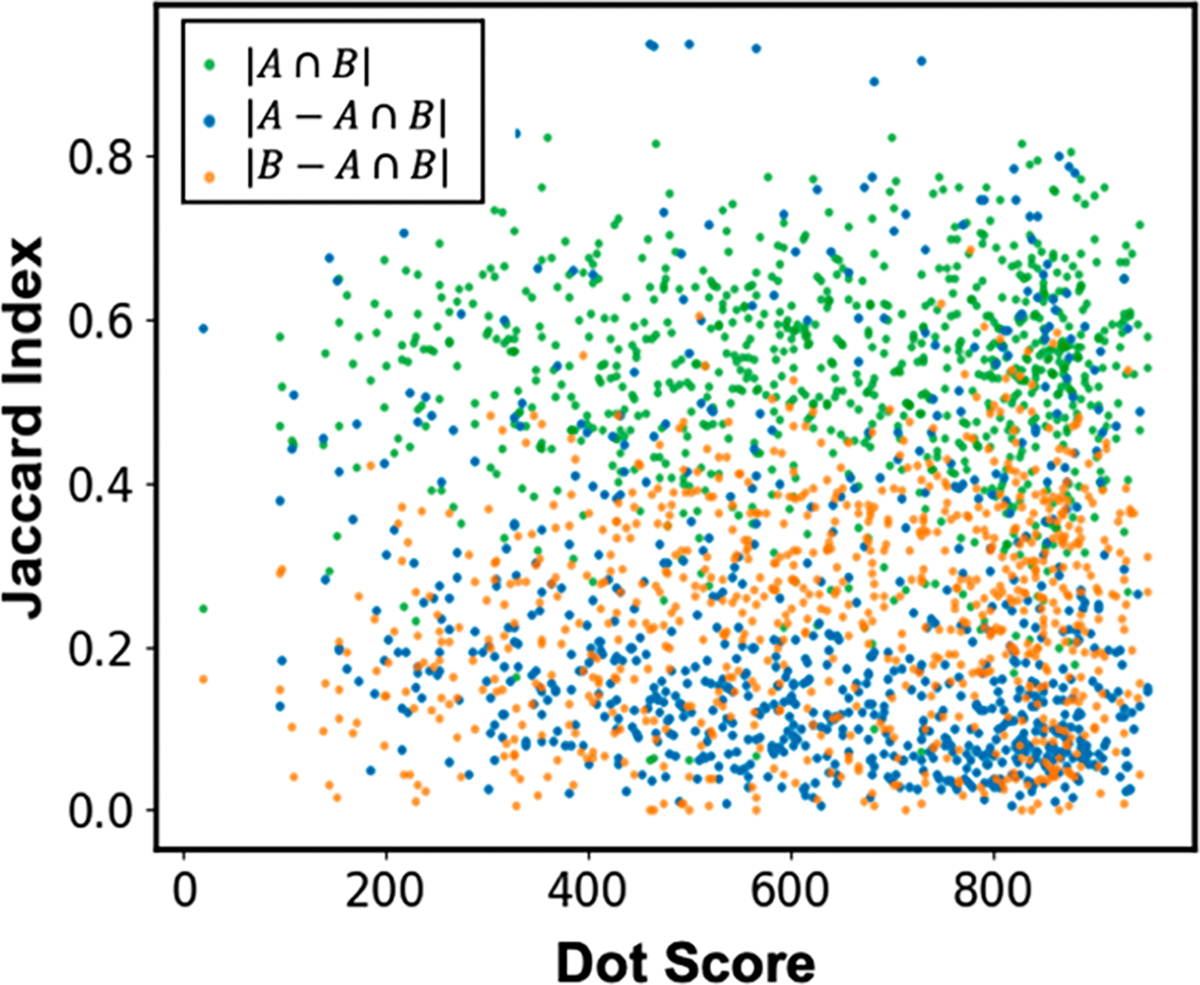
Comparison of 816 compound spectra for QCEIMS prediction versus experimental mass spectra. For each spectrum, the Jaccard similarity index was calculated giving three fractions: the intersection of correctly predicted ions (green dots), versus ions only found in experimental spectra (underpredicted, orange), or ions only found in QCEIMS-predicted spectra (overpredicted, blue).
CONCLUSIONS
We presented the first large-scale application of the QCEIMS algorithm on trimethylsilylated compounds. We completed calculations for almost twice as many compounds than in a previous report on nonderivatized molecules.11 Together, these two studies show that quantum chemistry prediction of mass spectra is now on the verge of being applicable to thousands of compounds, with the prospect of being useful for compounds that are not commercially available and not present in current MS libraries. On a single CPU thread, calculations took approximately 2.3 h per atom or approximately 7.2 h on a 16 CPU cluster for a molecule with 50 atoms. Calculation times increase quadratically if larger molecules are calculated. Assuming these calculations were run on 5000 nodes with molecules that do not exceed 50 atoms, we might be able to calculate spectra for 100,000 molecules within 100 days, as long as the size and complexity of molecules is similar as presented here.
To assess the accuracy of such predictions, we analyzed the fragmentation reactions for specific molecules and the MS/MS matching scores of QCEIMS-predicted spectra across aliphatic and aromatic trimethylsilylated compounds. Overall, we found that QCEIMS predictions were most accurate for aromatic compounds with nitrogen heteroatoms than for oxygen-containing aliphatic compounds. We also uncovered some challenges for this method. For example, internal vibrational energy redistribution appears to impact the selectivity between competitive reactions. While many complex rearrangements were correctly predicted, we found that some reactions with four-membered transition states were missed by QCEIMS trajectory analyses. When calculating the Jaccard index of QCEIMS-predicted spectra versus experimental reference spectra, we concluded that such missed reactions had more impact on poor MS-similarity scores than overpredicted fragment ions. Despite the necessary approximations used in the QCEIMS tool, overall matching scores showed that predicted spectra have high enough quality to be useful in mass spectrometry research, including identification of unknown compounds in untargeted screens. Future advancements in QCEIMS may explore additional conformer sampling and different atom velocities. In addition, we will test excited-state MD simulations to investigate if the inclusion of higher energy states may improve predictions in electron ionization mass spectrometry.39,42
Supplementary Material
ACKNOWLEDGMENTS
We thank Professor Stefan Grimme (University of Bonn) for providing a free academic copy of the QCEIMS code. Input structures and MD trajectories and codes can be found at https://zenodo.org/record/5555434. The in silico TMS-MS database has been uploaded to MassBank of North America at https://massbank.us/spectra/browse?query=tags.text%3D%3D%22QCEIMS%22&text=&size=10.
Funding
Funding for the “West Coast Metabolomics Center for Compound Identification” was provided by the National Institutes of Health under Award Number NIH U2C ES030158.
Footnotes
The authors declare no competing financial interest.
ASSOCIATED CONTENT
Supporting Information
The Supporting Information is available free of charge at https://pubs.acs.org/doi/10.1021/acs.analchem.1c02838.
Scheme of compound classification, table of similarity scores of selected compounds, table of similarity scores of multi-TMS-derivative compounds, supplemental trajectory analysis, mass spectral fragmentation rules (Part II, alcohols, amides, amines, thiols), accurate mass spectra, estimate of processing time, energy partition analysis (PDF)
Metadata of in silico MS database and raw data plots (XLXS)
Complete contact information is available at: https://pubs.acs.org/10.1021/acs.analchem.1c02838
Contributor Information
Shunyang Wang, West Coast Metabolomics Center, UC Davis Genome Center, University of California, Davis, California 95616, United States; Department of Chemistry, University of California, Davis, California 95616, United States.
Tobias Kind, West Coast Metabolomics Center, UC Davis Genome Center, University of California, Davis, California 95616, United States.
Parker Ladd Bremer, West Coast Metabolomics Center, UC Davis Genome Center, University of California, Davis, California 95616, United States; Department of Chemistry, University of California, Davis, California 95616, United States.
Dean J. Tantillo, Department of Chemistry, University of California, Davis, California 95616, United States
Oliver Fiehn, West Coast Metabolomics Center, UC Davis Genome Center, University of California, Davis, California 95616, United States.
REFERENCES
- (1).Fiehn O Trends Analyt Chem. 2008, 27 (3), 261–269. [DOI] [PMC free article] [PubMed] [Google Scholar]
- (2).Zaikin V; Halket JM A Handbook of Derivatives for Mass Spectrometry; IM Publications: Chichester, 2009; pp 1–24. [Google Scholar]
- (3).Kind T; Wohlgemuth G; Lee DY; Lu Y; Palazoglu M; Shahbaz S; Fiehn O Analytical chemistry 2009, 81 (24), 10038–10048. [DOI] [PMC free article] [PubMed] [Google Scholar]
- (4).Kopka J; Schauer N; Krueger S; Birkemeyer C; Usadel B; Bergmüller E; Dörmann P; Weckwerth W; Gibon Y; Stitt M; Willmitzer L; Fernie AR; Steinhauser D. Bioinformatics 2005, 21 (8), 1635–1638. [DOI] [PubMed] [Google Scholar]
- (5).Stein S Anal. Chem. 2012, 84 (17), 7274–7282. [DOI] [PubMed] [Google Scholar]
- (6).Horai H; Arita M; Kanaya S; Nihei Y; Ikeda T; Suwa K; Ojima Y; Tanaka K; Tanaka S; Aoshima K; Oda Y; Kakazu Y; Kusano M; Tohge T; Matsuda F; Sawada Y; Hirai MY; Nakanishi H; Ikeda K; Akimoto N; Maoka T; Takahashi H; Ara T; Sakurai N; Suzuki H; Shibata D; Neumann S; Iida T; Tanaka K; Funatsu K; Matsuura F; Soga T; Taguchi R; Saito K; Nishioka T Journal of Mass Spectrometry 2010, 45 (7), 703–714. [DOI] [PubMed] [Google Scholar]
- (7).Kind T; Tsugawa H; Cajka T; Ma Y; Lai Z; Mehta SS; Wohlgemuth G; Barupal DK; Showalter MR; Arita M; Fiehn O Mass Spectrom. Rev. 2018, 37 (4), 513–532. [DOI] [PMC free article] [PubMed] [Google Scholar]
- (8).Sorokina M; Steinbeck CJ Cheminform. 2020, 12 (1), 20. [DOI] [PMC free article] [PubMed] [Google Scholar]
- (9).Kumari S; Stevens D; Kind T; Denkert C; Fiehn O Anal. Chem. 2011, 83 (15), 5895–902. [DOI] [PMC free article] [PubMed] [Google Scholar]
- (10).Lai Z; Tsugawa H; Wohlgemuth G; Mehta S; Mueller M; Zheng Y; Ogiwara A; Meissen J; Showalter M; Takeuchi K; Kind T; Beal P; Arita M; Fiehn O Nat. Methods 2018, 15 (1), 53–56. [DOI] [PMC free article] [PubMed] [Google Scholar]
- (11).Wang S; Kind T; Tantillo DJ; Fiehn OJ Cheminform. 2020, 12 (1), 63. [DOI] [PMC free article] [PubMed] [Google Scholar]
- (12).Wei JN; Belanger D; Adams RP; Sculley D ACS Cent Sci. 2019, 5 (4), 700–708. [DOI] [PMC free article] [PubMed] [Google Scholar]
- (13).Allen F; Pon A; Greiner R; Wishart D Anal. Chem. 2016, 88 (15), 7689–7697. [DOI] [PubMed] [Google Scholar]
- (14).Grimme S Angew. Chem., Int. Ed. 2013, 52 (24), 6306–6312. [DOI] [PubMed] [Google Scholar]
- (15).Bauer CA; Grimme S Organic & Biomolecular Chemistry 2014, 12 (43), 8737–8744. [DOI] [PubMed] [Google Scholar]
- (16).Bauer CA; Grimme SJ Phys. Chem. A 2014, 118 (49), 11479–11484. [DOI] [PubMed] [Google Scholar]
- (17).Borges RM; Colby SM; Das S; Edison AS; Fiehn O; Kind T; Lee J; Merrill AT; Merz KM; Metz TO; Nunez JR; Tantillo DJ; Wang L-P; Wang S; Renslow RS Chem. Rev. 2021, 121 (10), 5633–5670. [DOI] [PMC free article] [PubMed] [Google Scholar]
- (18).Grimme S; Bannwarth C; Shushkov PJ Chem. Theory Comput. 2017, 13 (5), 1989–2009. [DOI] [PubMed] [Google Scholar]
- (19).Koopman J; Grimme S ACS Omega 2019, 4 (12), 15120–15133. [DOI] [PMC free article] [PubMed] [Google Scholar]
- (20).Bannwarth C; Ehlert S; Grimme SJ Chem. Theory Comput. 2019, 15 (3), 1652–1671. [DOI] [PubMed] [Google Scholar]
- (21).Schreckenbach SA; Anderson JSM; Koopman J; Grimme S; Simpson MJ; Jobst KJ J. Am. Soc. Mass Spectrom. 2021, 32 (6), 1508–1518. [DOI] [PubMed] [Google Scholar]
- (22).Halgren TA J. Comput. Chem. 1996, 17 (5–6), 490–519. [Google Scholar]
- (23).O’Boyle NM; Banck M; James CA; Morley C; Vandermeersch T; Hutchison GR Journal of Cheminformatics 2011, 3 (1), 33. [DOI] [PMC free article] [PubMed] [Google Scholar]
- (24).Koopman J; Grimme SJ Am. Soc. Mass Spectrom. 2021, 32 (7), 1735–1751. [DOI] [PubMed] [Google Scholar]
- (25).Sun L; Park K; Song K; Setser DW; Hase WL J. Chem. Phys. 2006, 124 (6), 064313. [DOI] [PubMed] [Google Scholar]
- (26).Legault CY CYLview, 1.0b; Université de Sherbrooke, 2009; http://www.cylview.org (accessed December 2021). [Google Scholar]
- (27).Djoumbou Feunang Y; Eisner R; Knox C; Chepelev L; Hastings J; Owen G; Fahy E; Steinbeck C; Subramanian S; Bolton E; Greiner R; Wishart DS J. Cheminform. 2016, 8 (1), 61. [DOI] [PMC free article] [PubMed] [Google Scholar]
- (28).RDKit: Open-Source Cheminformatics, 2019.03.1, 2019. http://www.rdkit.org (accessed December 2021). [Google Scholar]
- (29).Lai Z; Fiehn O Mass Spectrom. Rev. 2018, 37 (3), 245–257. [DOI] [PubMed] [Google Scholar]
- (30).Mass Frontier 7.0, HighChem, Ltd., 2011. https://planetorbitrap.com/mass-frontier (accessed December 2021). [Google Scholar]
- (31).Lai Z; Kind T; Fiehn O Anal. Chem. 2017, 89 (19), 10171–10180. [DOI] [PMC free article] [PubMed] [Google Scholar]
- (32).Beuck S; Schwabe T; Grimme S; Schlörer N; Kamber M; Schänzer W; Thevis MJ Am. Soc. Mass Spectrom. 2009, 20 (11), 2034–2048. [DOI] [PubMed] [Google Scholar]
- (33).Engeser M; Mundt C; Bauer C; Grimme S Journal of Mass Spectrometry 2017, 52 (7), 452–458. [DOI] [PubMed] [Google Scholar]
- (34).Lorquet JC Organic Mass Spectrometry 1981, 16 (11), 469–482. [Google Scholar]
- (35).Lorquet JC Int. J. Mass Spectrom. 2000, 200 (1), 43–56. [Google Scholar]
- (36).Kurouchi H; Andujar-De Sanctis IL; Singleton DA J. Am. Chem. Soc. 2016, 138 (44), 14534–14537. [DOI] [PMC free article] [PubMed] [Google Scholar]
- (37).Gasteiger J; Hanebeck W; Schulz KP J. Chem. Inf. Comput. Sci. 1992, 32 (4), 264–271. [Google Scholar]
- (38).Harvey DJ; Vouros P Mass Spectrom. Rev. 2020, 39 (1–2), 105–211. [DOI] [PubMed] [Google Scholar]
- (39).Semialjac M; Schröder D; Schwarz H Chem.–Eur. J. 2003, 9 (18), 4396–4404. [DOI] [PubMed] [Google Scholar]
- (40).Holmes JL Organic Mass Spectrometry 1985, 20 (3), 169–183. [Google Scholar]
- (41).Stein SE; Scott DR J. Am. Soc. Mass Spectrom. 1994, 5 (9), 859–866. [DOI] [PubMed] [Google Scholar]
- (42).Moss CL; Liang W; Li X; Tureček F J. Am. Soc. Mass Spectrom. 2012, 23 (3), 446–459. [DOI] [PubMed] [Google Scholar]
Associated Data
This section collects any data citations, data availability statements, or supplementary materials included in this article.