

Abstract
Polyomavirus small t antigen (ST) impedes late features of retinoic acid (RA)-induced HL-60 myeloid differentiation as well as growth arrest, causing apoptosis instead. HL-60 cells were stably transfected with ST. ST slowed the cell cycle, retarding G2/M in particular. Treated with RA, the ST transfectants continued to proliferate and underwent apoptosis. ST also impeded the normally RA-induced hypophosphorylation of the retinoblastoma tumor suppressor protein consistent with failure of the cells to arrest growth. The RA-treated transfectants expressed CD11b, an early cell surface differentiation marker, but inducible oxidative metabolism, a later and more mature functional differentiation marker, was largely inhibited. Instead, the cells underwent apoptosis. ST affected significant known components of RA signaling that result in G0 growth arrest and differentiation in wild-type HL-60. ST increased the basal amount of activated ERK2, which normally increases when wild-type cells are treated with RA. ST caused increased RARα expression, which is normally down regulated in RA-treated wild-type cells. The effects of ST on RA-induced myeloid differentiation did not extend to monocytic differentiation and G0 arrest induced by 1,25-dihydroxy vitamin D3, whose receptor is also a member of the steroid-thyroid hormone superfamily. In this case, ST abolished the usually induced G0 arrest and retarded, but did not block, differentiation without inducing apoptosis, thus uncoupling growth arrest and differentiation. In sum, the data show that ST disrupted the normal RA-induced program of G0 arrest and differentiation, causing the cells to abort differentiation and undergo apoptosis.
The polyomavirus small t protein is one of three viral antigens encoded by the early region of the polyomavirus genome (for reviews, see references 14 and 40). With simian virus 40 (SV40), the polyomavirus was one of the first DNA-transforming viruses discovered and has been studied extensively. The three viral antigens, the large, middle, and small T proteins, are derived from overlapping coding regions. Of these, the middle T protein has been the most studied due to its ability to deregulate the cell cycle and cause cell transformation. The principal targets of middle T, believed to mediate these effects, are Src-like kinases, phosphatidylinositol (PI) 3-kinase, and phospholipase C-γ (PLC-γ), all of which can regulate and enhance mitogen-activated protein kinase (MAPK) signaling typical of platelet-derived growth factor (PDGF) class peptide growth factors. In addition, middle T also binds to PP2A, which may also facilitate middle T-stimulated MAPK activation and contribute to transformation and cell cycle deregulation. The transforming effects of middle T can be blocked by retinoic acid (RA) through inhibition of PI 3-kinase-dependent activation of the c-fos promoter (10a). The large T antigen binds hypophosphorylated retinoblastoma (RB) protein, disrupting its cell cycle-inhibitory effects, and may thus enhance the cell cycle-stimulatory effects of middle T. The cellular effects of the small t antigen (ST), in contrast to those of middle T, are less well understood. ST shares PP2A binding sequences with middle T. Although ST is nontransforming, it can enhance the ability of middle T to cause cell transformation (2), tumor formation (1), and progression to S phase (5, 33). It thus has a well-known capability to complement the cell cycle effects of middle T. By itself, ST can regulate apoptosis. ST inhibits p53-induced cell cycle arrest and apoptosis (39). It also reverses middle T-dependent tumor necrosis factor alpha-induced apoptosis (6). Consistent with these effects on apoptosis, SV40 small t inhibited SV40 large T-induced apoptosis (22). It is intriguing that ST can regulate PP2A, which is known to regulate the transcriptional activity of retinoic acid receptor α (RARα), and that RA, whose cellular effects depend on MAPK signaling (48, 49, 51), can both regulate the cell cycle and inhibit the transforming activity of middle T, suggesting that ST and RA-signaling effects may conspire to affect the cell cycle and possibly apoptosis. Relevant to this, middle T has already been found to regulate RA signaling that controls RB hypophosphorylation, the cell cycle, and cell differentiation (35, 54).
RA induces G0 cell cycle arrest and myeloid differentiation of HL-60 human myeloblastic leukemia cells, an archetype in vitro model for studying the mechanism of action of RA (7, 13). HL-60 cells are myelo-monocytic progenitor cells capable of either myeloid or monocytic differentiation in response to different inducers. While RA causes myeloid differentiation, 1,25-dihydroxy vitamin D3, whose receptor, like RAR and retinoid X receptor (RXR), is also a member of the steroid thyroid hormone superfamily and causes monocytic differentiation (for a review, see reference 41). Both RA and 1,25-dihydroxy vitamin D3 induce a metabolic cascade with a duration of ca. two cell cycles, culminating in onset of cell differentiation and G0 arrest (43, 45, 46, 53). RA-induced arrest and differentiation of HL-60 cells require the simultaneous activation of both RARα and RXRs (9). The cell cycle of the sublines studied is approximately 24 h, and onset of differentiation and G0 arrest is at approximately 48 h. By 96 h of treatment, the cultures are almost entirely differentiated G0 cells. The early period corresponding to the first cell cycle primes the cells to differentiate without lineage specificity. The late period corresponding to the ca. 24 h after priming and before onset of G0 arrest and differentiation determines whether the cells differentiate along the myeloid or monocytic lineage (43, 46).
In HL-60 cells, RA causes a MEK-dependent MAPK activation, which is needed for G0 arrest and myeloid differentiation (48, 49, 51) but is atypical compared to the prototypical mitogenic signaling characteristic of MAPK activation by peptide growth factors because it is slowly induced, protracted once induced, and utilized by RA to cause G0 arrest and differentiation. Consistent with a MAPK dependence, RA-induced G0 arrest and differentiation are known to be positively regulated by signals from two cell surface receptors, c-FMS (47, 50, 52) and BLR1 (3, 4). c-FMS is a PDGF class transmembrane tyrosine kinase receptor, while BLR1, also known as CXCR1, is a putative seven-pass heterotrimeric G protein-coupled receptor. Both receptors cause MAPK activation in HL-60 cells (3, 51). The polyomavirus middle T antigen affects essentially the same ensemble of signal regulatory molecules as PDGF class receptors such as c-FMS (for reviews, see references 14 and 40), including primarily Src-like kinases (15), PI 3-kinase (11), PLC-γ (38), and PP2A (34). Polyomavirus middle T may act as a scaffold that facilitates assembly of a specific signaling complex. Ectopic expression of the polyomavirus middle T antigen in HL-60 cells activates MAPK signaling (54) and enhances RA-induced differentiation and arrest (35, 54). Surprisingly, ectopic expression of middle T mutants in which the activation of Src-like kinases, PI 3-kinases, and PLC-γ is crippled also enhanced RA-induced differentiation and arrest like middle T (54). These nontransforming mutants are crippled in the three major known activating activities of middle T but retain the PP2A binding domain. The polyomavirus ST also binds PP2A (34), although the effects of ST and middle T on PP2A are distinguishable (29). ST can have various effects on PP2A activity, including activation, deactivation, and redirection of specificity (29, 34). For SV40, the small t antigen-PP2A interaction inhibits PP2A and stimulates MAPK signaling (37). Signal disruption by ectopic expression of polyomavirus ST may thus have a significant effect on RA-induced differentiation and implicate a regulatory role for PP2A in RA signalling.
PP2A is one of four known serine-threonine protein phosphatases (12, 30), with differing specificities in their metal requirements and sensitivity to two protein inhibitors, 1 and 2. The PP2A catalytic subunit, PP2A-C, has a mass of 36 kDa and complexes with an A regulatory subunit and different B regulatory subunits, α, β, γ (17, 20, 30). PP2A-C/A is the basic dimeric enzyme complex, and the B subunit binds A to make the trimeric complex. RA was reported to reduce the expression of PP2A-C in HL-60 cells but not the expression of the A and Bα subunits, which remained relatively constant (32). A number of molecular targets for PP2A are known, including MAPK (19, 23, 36) and RARα (24). Loss of PP2A may impede dephosphorylation of activated MAPK and help sustain elevated levels of activated MAPK. Inhibition of PP2A also enhances RARα and RXRα phosphorylation and increases their ligand-independent transcriptional activating capability in promoter-reporter assays (24). PP2A thus both is regulated by RA and regulates two signaling routes essential to the mechanism of action of RA. It thus appears to be in the network of molecules affecting RA signaling. Motivated by the above known signaling targets of polyomavirus ST and the potential involvement of these in RA-induced cellular effects, ST might have a significant effect on RA-induced G0 arrest and cell differentiation. The experiments presently reported describe those effects.
MATERIALS AND METHODS
Cells and culture conditions.
HL-60 human myeloblastic leukemia cells (13) were continuously cultured in RPMI 1640 medium (GIBCO-BRL, Grand Island, N.Y.) supplemented with 5% fetal calf serum (Intergen, Purchase, N.Y.) as previously described (49, 54). Stock cells were maintained in 10-ml cultures that were initiated at a density of 0.2 × 10⁶ cells/ml for 2 days, twice a week, and then 0.1 × 10⁶ cells/ml for 3 days, once a week, to sustain constant exponential growth. Stable transfectants were cultured analogously, with the addition of 1 mg of active G418 (Geneticin; Sigma Chemical Co., St. Louis, Mo.) per ml to the medium.
Experimental 30-ml cultures were initiated at a cell density of 0.2 × 10⁶ cells/ml with 1.0 × 10⁻⁶ M RA (Sigma Chemical Co.) or 0.5 × 10⁻⁶ M 1,25-dihydroxy vitamin D3 (Solvay Duphar B. V., Weesp, The Netherlands). RA or 1,25-dihydroxy vitamin D3 was added from a 10−3 M stock in ethanol stored at −20°C and protected from light. At the indicated times, cells were harvested to determine cell density, differentiation, cell cycle distribution, apoptosis, or Western analysis. Experiments shown are typical of two or more repeats, all using the same stable transfectant. In total, four independent stable transfectants yielded similar results.
In the experiments where vinblastine was used to block cell cycle transit in G2/M, ST-transfected cells were initiated in 30-ml cultures of 0.2 × 10⁶ cells/ml with or without 10−6 M RA and then incubated for 48 h. Each of these cultures was divided into two cultures, one of which received vinblastine to make a final concentration of 0.1 μM using a 1 mM stock of vinblastine (Sigma Chemical Co.) The cells were harvested 24 h later for cell cycle analysis by flow cytometry as described below.
Assays of growth and differentiation.
Assays of cell growth by measuring cell density and distribution in the cell cycle and assays of cell differentiation detected by CD11b expression or inducible oxidative metabolism were performed as previously described (8, 49, 53). Briefly, cell density in experimental cultures was measured by repeated counts with a hemacytometer. Viability was assessed by exclusion of 0.2% trypan blue dye and was routinely at least 95% in all cultures, except RA-treated ST transfectants where apoptosis was induced and the percentage of trypan-excluding cells was down to approximately 75% by 72 h. The distribution of cells in the cell cycle was determined by flow cytometry using propidium iodide-stained nuclei. Half a million cells were harvested at each indicated time, resuspended in 0.5 ml of hypotonic propidium iodide solution (0.05 mg of propidium iodide per ml, 1 mg of sodium citrate per liter, and 0.1% Triton X-100), and stored refrigerated and protected from light until analyzed. Flow cytometric analysis was done with a multiparameter dual laser fluorescence-activated cell sorter (EPICS; Coulter Electronics, Hialeah, Fla.) using 200 mW of 488 nm excitation from a tunable argon ion laser. Expression of the cell surface differentiation marker, CD11b, was measured by immunofluorescence and flow cytometry. Aliquots of 0.2 × 10⁶ cells were harvested at the indicated times, centrifuged to a pellet, and resuspended in 97.5 μl of phosphate-buffered saline (PBS) wash (PBS with 5% fetal bovine serum [FBS] and 0.2% sodium azide) to which 2.5 μl of fluorescein isothiocyanate (FITC)-conjugated anti-CD11b antibody (MO1-FITC; Coulter Immunology, Hialeah, Fla.) was added. After 30 min at 4°C, the cells were centrifuged to a pellet and washed twice with PBS wash prior to resuspension in 200 μl of PBS wash and analysis by flow cytometry. Flow cytometry was done with 200 mW of 488 nm excitation. Functional differentiation to a mature myelo-monocytic phenotype capable of inducible oxidative metabolism was assayed by phorbol-12-myristate-13-acetate (Sigma Chemical Co.)-induced oxidative metabolism, resulting in intracellular reduction of nitroblue tetrazolium to formazan by superoxide. Cells (0.2 × 10⁶) were harvested at the indicated times and resuspended in 0.2 ml of 2-mg/ml nitroblue tetrazolium in PBS containing 200 ng of phorbol-12-myristate-13-acetate per ml in dimethyl sulfoxide. The cell suspension was incubated for 20 min in a 37°C water bath and then scored using a hemacytometer for the percentage expressing intracellular purple formazan precipitated by superoxide. Over 200 cells were counted per sample, and variation in replicates was routinely within 10%.
Western analysis of RB, MAPK, activated MAPK, polyomavirus ST, RARα, and PP2A.
Western blotting was done using whole cell lysates from cells as previously described (44, 49). At the indicated times, 106 cells were harvested and fixed in 1 ml of 90% methanol at −20°C. The cells were stored at −20°C until analysis by sodium dodecyl sulfate-polyacrylamide gel electrophoresis (SDS-PAGE). Cells were solubilized in 50 μl of loading buffer (6% SDS, 4 M urea, 4 mM EDTA, 125 mM Tris [pH 6.9], 0.25% bromphenol blue, 35 μl of β-mercaptoethanol per ml) by boiling in a water bath for 5 min. SDS-PAGE was done using a 4% stacking gel and a 10% resolving gel with 37.5:1 acrylamide:bis. Samples were electrophoresed for 1,200 V · h, typically 75 V for 16 h. One million cells were loaded per lane. Proteins were electrotransferred (Trans Blot Cell; Bio-Rad Inc., Hercules, Calif.) from the gel to a nitrocellulose membrane. Transfer was done at 0.8 A for 1 h. The resulting membrane was blocked by immersion overnight in 5% powdered milk and 0.05% Tween 20 in PBS (PBS-T) at 4°C. The membranes were probed with antibodies detecting the phosphorylated and unphosphorylated forms of RB, ERK2 and ERK1, the activated ERK2 and ERK1 bearing a TEY motif with T(183) and Y(185) phosphorylation, the polyomavirus ST, RARα, or PP2A. The antibody to detect RB (RB gene product [MAb1] monoclonal antibody; Zymed Laboratories, South San Francisco, Calif.) was used at 0.4 mg/ml of PBS-T with a 1- to 2-h incubation at room temperature. The antibody to detect ERK2 and ERK1 (C-14, catalog no. SC154 rabbit polyclonal antibody; Santa Cruz Biotechnology, Inc., Santa Cruz, Calif.) was used at 0.1 μg/ml in PBS-T with a 1-h incubation at room temperature. The antibody used to detect activated ERK1 and ERK2 (catalog no. V6671 rabbit polyclonal antibody; Promega, Inc., Madison, Wis.) was used at 0.025 μg/ml in 0.1% bovine serum albumin in PBS-T with a 2-h incubation at room temperature. ST was resolved by SDS-PAGE using a 12% gel with a 6% stacker run for 1,200 V · h, typically for 8 to 9 h. The antibody used to detect polyomavirus ST was PN116, a murine monoclonal antibody (18) against the first 75 amino acids of polyomavirus middle T, which is also common to ST. The antibody was used at a 1:50 dilution with an overnight incubation at 4°C in 0.5% bovine serum albumin in PBS-T. It was a generous gift from Brian Schaffhausen. The antibody used to detect RARα was RPα(F) (16), a rabbit polyclonal antibody, which was used at a 1:1,000 dilution with a 1- to 3-h room temperature incubation in PBS-T. The RPα(F) was a generous gift from Pierre Chambon. The antibody used to detect the PP2A catalytic subunit (catalog no. V6311 rabbit polyclonal antibody; Promega Inc.) was used diluted 1:600 in PBS with a 3.5-h room temperature incubation. Detection was performed using a horseradish peroxidase-conjugated secondary anti-murine or -rabbit antibody and enhanced chemiluminescence (ECL Kit; Amersham, Ltd., Arlington Heights, Ill.) following the manufacturer's instructions.
Expression vectors and transfection.
The pZIP-NeoSV(X)1 retroviral expression vector, described by C. L. Cepko, B. E. Roberts, and R. C. Mulligan (9a), in which Moloney leukemia virus long terminal repeats (LTRs) controlled expression of the cDNA insert and the dominant selectable neo marker, was used to ectopically express polyomavirus ST as described before for polyomavirus middle T antigen and its mutants (35, 54). ST cDNA was PCR amplified from the cytomegalovirus-ST plasmid, which was a generous gift of Brian Schaffhausen, using the following outside primers. The forward primer was 5′-ACTTGGATCCGAATTCCTCGACGATC-3′. The 26-mer consists of an initial 4 bases to balance G/C:A/T content for hybridization and the 6-base BamHI recognition sequence, followed by 16 bases of the vector preceding the start, ATG, of the cDNA. The reverse primer was 5′-GCCTCATATGCCTTTGTTCATGGCAG-3′. The 26-mer consists of an initial 4 bases to balance A/T:G/C content and the 6-base NdeI site, followed by 16 bases complementary to the vector sequence beginning 9 bases 3′ of the stop, TAG. This G and its 5 3′ bases make a BamHI site, creating a PCR product that is a BamHI fragment. This was gel purified (Qiaex II gel extraction kit; Qiagen, Inc., Valencia, Calif.) and the BamHI fragment was cloned into a pZIP-NeoSV(X)1 vector that was linearized with BamHI and phosphatase (CIAP, calf intestinal alkaline phosphatase, 25 U/μl; GIBCO) treated for 30 min at 50°C, using 4 μl of CIAP stock diluted 1:50 in reaction buffer added to a 27-μl total volume containing 5 μg of DNA. HL-60 cells were transfected with the resulting expression vector, ST-pZIP-Neo. Transfection was performed by electroporation (Gene Pulser; Bio-Rad Laboratories) as previously described (35, 54). Briefly, 4 × 10⁶ cells and 2 × 10¹² plasmid copies in 0.4 ml of RPMI 1640 were electroporated in a 0.4-cm electrode gap cuvette, using 300 V and 500 μF capacitance, resulting in typical time constants of 10 to 12. The electroporated cell suspension was added to 4.6 ml of RPMI 1640 with 10% FBS and incubated for 48 h at 37°C in 5% CO2. The cells were then recultured in RPMI 1640 supplemented with 5% FBS plus 1 mg of active G418 per ml to select stable transfectants. During this ca. 2-week period, the medium was replaced every 2 or 3 days to reinitiate cultures at 0.2 × 10⁶ cells/ml. Selective pressure was maintained on the pooled surviving cells by continuously culturing in 1 mg of G418 per ml. By 21 days, transfected cells could be maintained as regular stock cultures. A vector control, consisting of stable transfectants derived as above using the empty pZIP-NeoSV(X)1 vector, grew and differentiated in response to RA and 1,25-dihydroxy vitamin D3 indistinguishably from untransfected HL-60 cells (15).
Apoptosis assays.
Apoptosis was ascertained by DNA laddering, flow cytometric sub-G1 DNA, and cytological staining with Hoechst 3342 and propidium iodide. DNA laddering resulting from endonuclease activity associated with apoptosis was detected on 2% agarose gels stained with ethidium bromide. DNA was phenol extracted from HL-60 cells treated with 10−6 M RA for 96 h. Briefly, 5 × 10⁶ cells were lysed for 30 min at 37°C in 200 μl of lysis buffer (0.5× Tris-borate-EDTA [TBE], 0.25% Nonidet P-40, 1 mg of RNase per ml), and then 20 μl of 1-mg/ml proteinase K was added. After 30 min, DNA was phenol extracted. DNA was precipitated by adding 0.1 volume of 3 M sodium acetate and then 2 volumes of 100% ethanol at −20°C. The entire DNA sample was resolved by electrophoresis on a 2% agarose gel run for 170 V · h, typically 10 V for 17.5 h, and visualized by ethidium bromide.
The percentage of sub-G1 DNA cells was determined by flow cytometry. Cells were stained with propidium iodide as described above for cell cycle analysis. The samples were analyzed using 200 mW of 488 nm excitation from an argon ion laser using a multiparameter dual laser fluorescence-activated cell sorter (EPICS; Coulter Electronics). Fluorescence was collected using a forward angle light scatter trigger signal.
Cytological detection of apoptosis was performed using a double-fluorescence staining procedure described previously by Muscarella et al. (31). This technique, now used widely, allows simultaneous detection of both plasma membrane integrity by dye exclusion and the apoptotic phenotype characterized by condensed, segregated chromatin in cells. At the indicated times, 500-μl aliquots of cell suspension (ca. 106 cells) were transferred from cultures into 5-ml culture tubes. One hundred μl of staining solution HO (113 μg of Hoechst 33342 per ml in PBS) and 100 μl of staining solution PI (20 μg of propidium iodide per ml in PBS) were added to the culture tubes, which were then incubated for 15 min at 37°C in the dark. The double fluorescence was detected with a Leitz Aristoplan microscope equipped with long-pass filter cube A. Healthy cells were characterized by diffuse, blue-fluorescent nuclei (due to the HO dye), and the absence of red fluorescence (due to the PI dye) also denoted regular, intact cells. Apoptotic cells showed the stereotypical features of condensed chromatin in multiple, segregated bodies, which brightly fluoresced a very light blue early in apoptosis and then pink later in apoptosis as membrane integrity became compromised and PI leaked into intact, albeit shrunken, cells. Typically, necrotic cells are swollen, have irregular membranes, and fluoresce red due to PI. These cells do not show any condensation and segregation of chromatin (31). At least 200 cells were analyzed by fluorescence microscopy for apoptosis and necrosis. Replicate slides were scored for each culture. No necrotic cells were detected in these studies.
Statistical analysis was performed on data from two experiments. Values presented (Table 1) are means and standard deviations. Statistical analysis was done using the statistical program NCSS 6.0 (Kaysville, Utah). Percentage data were transformed by arc sine prior to statistical analysis to normalize the data. The data were then evaluated by analysis of variance followed by post-hoc testing using Fisher's least-significant-difference test to determine all possible differences among control and treatment groups. All statistical evaluations were performed at a significance level of P <0.05. The data of Table 1 were analyzed in this way, comparing all of the cases at each of the time points to determine if any of the treatments induced apoptosis at that particular time point, i.e., 48 or 72 h. At each time point, represented by a separate column in Table 1, different superscripts indicate statistically significant differences.
TABLE 1.
Percent apoptosis detected by cytology for ST and vector control (pZIP) transfectants
| Cell treatment | % Apoptosis (mean ± SD) detected after:
|
|
|---|---|---|
| 48 h | 72 h | |
| ST-C | 2.5 ± 0.7a | 7.5 ± 2.1ab |
| pZIP-C | 6.5 ± 0.7b | 29.0 ± 4.2c |
| ST-RA | 19.5 ± 2.1c | 40.0 ± 1.4d |
| pZIP-RA | 14.0 ± 1.4d | 12.0 ± 1.4be |
| ST-D3 | 3.5 ± 0.7a | 3.5 ± 0.7a |
| pZIP-D3 | 2.5 ± 0.7a | 6.5 ± 0.7a |
a,b,c,d,e Values in columns with different superscripts are statistically different from one another at P values of <0.05. Those with the same superscripts are not significantly different at each time. Statistical evaluations were performed for each data set at 48 or 72 h.
RESULTS
Stable transfectants expressing ST.
In order to assess the effects of ST on the cell cycle and the ability of HL-60 cells to differentiate, stable transfectants expressing polyomavirus ST were created. HL-60 human myeloblastic leukemia cells were stably transfected by electroporation to express ST. The ST cDNA was under the control of RA- and 1,25-dihydroxy vitamin D3 (D3)-inducible Moloney murine leukemia virus LTRs (35, 54). Stably transfected cells were derived by G418 selection of the pooled transfectants, obviating clone-specific artifacts. The possibility of a bias in the selection process introduced by expression of ST cannot necessarily be ruled out. The vector control consisted of the expression vector with no ST cDNA insert. The resulting ST-transfected, vector control-transfected, and wild-type HL-60 cells were cultured either untreated or treated with 10−6 M RA or 0.5 × 10⁻⁶ M D3 for 48 h and then harvested for Western analysis of ST expression. Figure 1 shows the Western blot of ST stable transfectants, vector control transfectants, and wild-type (parental) HL-60 cells. The ST transfectants expressed ST, which was both RA- and D3-inducible, as expected, for the introduced transgene. In contrast, the vector control stable transfectant and the wild-type HL-60 cells showed no ST expression.
FIG. 1.

Ectopic expression of polyomavirus ST. Western blot of polyomavirus ST expression in vector control (pZIP) or small t (ST) stable transfectants and wild-type (parental) HL-60 cells in the absence (C) or presence of 10−6 M retinoic acid (RA) or 0.5 × 10⁻⁶ M 1,25-dihydroxy vitamin D3 (D3) is shown. RA or D3 treatment was for 48 h. Only the ST transfectants expressed the small t antigen, and expression was enhanced by RA or D3 because expression of the ST cDNA was under the control of MMLV LTRs.
To seek an indication that the ectopic ST was biologically active, signaling molecules known to be affected by ST were analyzed. In particular, ST is known to augment MAPK signaling, presumably by binding and inhibiting PP2A (37). ST or vector control transfectants were cultured without or with RA for 24 h and harvested for Western analysis of activated ERK2. Figure 2A shows the Western blot of activated ERK2 in vector control and ST transfectants. Activated ERK2 was detected by an antibody that recognizes only the dual phosphorylated T183E Y185 motif. ST transfectants had more activated ERK2 than the vector control transfectants. The blot was stripped and reprobed with an antibody that recognizes all ERK2 to verify that there was a consistent amount of ERK2 in all of the lanes (not shown). As expected, the ST transfectants showed enhanced ERK2 activation consistent with a functional ST antigen.
FIG. 2.

Effect of ST on signaling molecules involved with retinoic acid. (A) Western blot of activated ERK2 for vector control (pZIP) or small t (ST) stable transfectants that were untreated (C) or treated (RA) with retinoic acid for 24 h. (B) Western blot of RARα for vector control (pZIP) or small t (ST) stable transfectants that were untreated (C) or treated with retinoic acid (RA) or 1,25-dihydroxy vitamin D3 (D3) for 24 or 72 h.
ST expression also affected another signaling molecule involved in RA signaling, RARα. RA is known to cause down regulation of RARα expression in HL-60 cells (49). ST or vector control transfectants were cultured in the absence or presence of RA or D3 and harvested at the indicated times for Western analysis of RARα expression. Figure 2B shows the resulting Western blots. ST caused increased expression of RARα. RA caused down regulation of RARα expression in ST as well as in vector control transfectants. This was apparent at 24 h and progressively more at 72 h. But at all times the ST transfectants had more RARα than the corresponding vector control transfectants, whose expression behaved like that known for wild-type HL-60 cells (49). Interestingly, the monocytic inducer, D3, had down regulatory effects similar to those of RA in vector control and ST transfectants, although, as will be shown below, ST affected D3-induced differentiation and cell cycle arrest differently. Ectopic expression of ST thus affected at least two signaling molecules, ERK2 and RARα, known to propel the cellular effects of RA.
Interestingly, similar experiments showed that two other prominent signaling molecules connected with MAPK signal transduction are not affected by ectopic ST expression. ST caused no significant change in PP2A expression (data not shown). Nor did RA cause any significant down regulation of PP2A expression in the subline of HL-60 cells used here, although it was reported in another instance for HL-60 cells (32). Furthermore, Western analysis of RAF expression showed that ST did not affect RAF phosphorylation, which increases with RA treatment as reported previously (51), or expression levels (data not shown).
Effects on cell growth.
In order to determine the effect of ST on the cell cycle of HL-60 cells, the cell cycle kinetics of the ST and vector control stable transfectants were analyzed. The ST- and vector control-transfected cells were cultured under selective pressure in G418 for 2 months, during which the cell numbers were recorded when cells were recultured on a schedule of 48, 48, and 72 h each week. The average doubling time for ST-transfected cells was approximately 31 h. In contrast, the doubling time of vector control cells was approximately 23.5 h, which is typical of the parental wild-type HL-60 cells. The percentage of cells in the G1, S, and G2/M cell cycle phases was determined by analyzing exponentially growing cells stained with propidium iodide by flow cytometry. The typical percentages of exponentially growing ST-transfected cells in G1, S, and G2/M are approximately 50, 31, and 19%, respectively. The typical percentages of vector control-transfected cells in G1, S, and G2/M are approximately 49, 37.5, and 13.5%, respectively. The durations of the G1, S, and G2/M phases were approximated from the above data as previously described (42) by the following equations: G1 = −k−1 ln(1 − FG1/2), S = −k−1 ln[1 − (FG1 + FS)/2] − G1, and G2+M = TD − (G1 + S), where k = 1n 2/TD, TD is the generation time, FG1 is the fraction of cells in G1, FS is the fraction of cells in S, G1 is the duration of G1, S is the duration of S, and G2+M is the duration of G2 plus M. The calculated durations of G1, S, and G2+M for ST-transfected cells are 12.9, 10.3, and 7.8 h, respectively. The calculated durations of G1, S, and G2+M for vector control-transfected cells are 9.5, 9.7, and 4.3 h, respectively. The primary effect of ST on the cell cycle was to prolong G2/M. G1 was also somewhat dilated, but S was hardly affected. Ectopic expression of ST thus increased the duration of the cell cycle, particularly increasing the duration of G2/M.
Effects on RA-induced differentiation.
In order to determine if ST expression affected the ability of cells to differentiate in response to RA, the percentage of cells differentiating during treatment with RA was measured. ST or vector control transfectants were initiated in culture in the absence or presence of RA. The percentage of functionally differentiated cells was measured by inducible oxidative metabolism, a functional marker for late-stage-differentiated myelo-monocytic cells. Figure 3A shows the percentage of functionally differentiated ST- or vector control-transfected cells cultured in the absence or presence of RA for the indicated times. The vector control-transfected cells differentiated with kinetics characteristic of wild-type (parental) HL-60 cells (49). The onset of differentiation occurred by 48 h and the percentage increased progressively thereafter. Untreated vector control cells did not differentiate. Untreated ST transfectants also did not differentiate; hence, the expression of ST had no effect by itself on functional differentiation. Differentiation of ST transfectants was grossly inhibited, with only minor differentiation occurring after prolonged culture for 96 h. Expression of ST thus greatly inhibited or at least grossly delayed RA-induced functional differentiation.
FIG. 3.

Effect of ST on RA-induced differentiation and cell cycle arrest. (A) Functional differentiation measured by the percentage of cells able to reduce nitroblue tetrazolium (NBT) as a function of time (in hours) in culture in the absence (circle) or presence (triangle) of retinoic acid for vector control (open symbol) or ST (closed symbol) transfectants. (B) Differentiation measured by the percentage of cells expressing the CD11b cell surface differentiation marker as a function of time (in hours) in culture in the absence (circle) or presence (triangle) of retinoic acid for vector control (open symbol) or ST (closed symbol) transfectants. Expression at zero hour was minimal, as shown for controls without RA. (C) Percentage of cells in G1/0 as a function of time (in hours) in culture in the absence (circle) or presence (triangle) of RA for vector control (open symbol) or ST (closed symbol) transfectants. G1/0 specific cell cycle arrest is evidenced by enrichment in the relative number of G1/0 DNA cells. The percentages are derived from DNA histograms of propidium iodide-stained cells using the flow cytometer computer as done previously (49). The fluorescence intensity of the G1 peak for ST and vector control transfectants in both treated and untreated cultures was indistinguishable from that of wild-type HL-60 or normal peripheral blood mononuclear cells, indicating that the total DNA content for G1/0 cells was approximately 2n and that there was no indication of potentially viral antigen-induced endoreduplication. (D) Percentage of cells in G2/M as a function of time (hours) in culture in the absence (circle) or presence (triangle) of retinoic acid for vector control (open symbol) or ST (closed symbol) transfectants. In ST transfectants treated with RA, the percentages of G2/M cells are increased compared to untreated cells, whereas vector control transfectants treated with RA decrease their percentages of G2/M cells compared to untreated cells.
Because inducible oxidative metabolism is a late-stage differentiation marker, expression of an early-differentiation marker, CD11b, was also analyzed to determine if early differentiation was blocked as well. CD11b is a cell surface differentiation marker induced early by RA in wild-type HL-60 cells. Clear CD11b-positive HL-60 cells are typically apparent by 24 h. ST or vector control transfectants were initiated in culture in the absence or presence of RA. The percentage of cells expressing CD11b was determined by immunofluorescence and flow cytometry. Figure 3B shows the percentage of CD11b-positive cells for ST- or vector control-transfected cells cultured in the absence or presence of RA for the indicated times. Untreated vector control or ST transfectants were negative for CD11b expression. In vector control transfectants, RA induced expression of CD11b by 24 h. By 96 h, almost all cells expressed CD11b. In comparison, ST-transfected cells consistently showed a higher percentage of CD11b-positive cells until the values for the two cell lines converged at 96 h when all cells were positive. ST expression thus enhanced RA-induced CD11b expression, an early marker of cellular differentiation in response to RA. While RA induction of this early cell surface marker was enhanced, the late functional differentiation marker was greatly inhibited. Thus, while ST promoted at least this early aspect of RA-induced differentiation, it caused the RA-induced differentiation program to subsequently abort before the cells functionally differentiated.
Effects on RA-induced cell cycle arrest.
In order to determine if ST affects the usual RA-induced G0 arrest, ST- and vector control-transfected cells were initiated in culture in the absence or presence of RA and assayed for their cell cycle distribution by flow cytometry at the indicated times. G0 cell cycle arrest would be revealed by enrichment in the percentage of G1/0 DNA cells. Figure 3C shows the percentages of cells with G1/0 DNA at the indicated times. For RA-treated vector control transfectants, the kinetics of RA-induced G1/0 arrest are characteristic of wild-type HL-60 cells (49). Onset of enrichment in the percentage of G1/0 DNA cells occurred by 48 h, and the percentage progressively increased thereafter until the population was largely G1/0 cells. In contrast, the RA-treated ST transfectants showed no evidence of such a G1/0 block. There was a slight decrease in the relative number of G1 cells, indicating a redistribution of cells in the cell cycle. In part, this was due to an increase in the relative percentage of G2/M cells following RA treatment. As shown in Fig. 3D, for ST-transfected cells RA caused an enrichment in the relative percentage of G2/M cells. Since ST causes G2/M dilation as described earlier, this likely reflects the RA-induced increase in ST expression, resulting in a more pronounced lengthening of G2/M. The G2/M percentages of untreated cells decreased at late times in culture probably because of prolonged culture and nutritional exhaustion. The pronounced decrease for RA-treated vector control transfectants reflects the accumulation of cells in G1/0. It should be noted that although in some instances viral antigens can cause endoreduplication and shift cellular DNA content, the flow-cytometric DNA histograms of wild-type HL-60, vector control, and ST transfectants in both treated and untreated cultures had indistinguishable G1/0 DNA fluorescence intensities from normal 2n DNA human peripheral blood mononuclear cells in G0 (data not shown); hence, there was no detectable ST-induced endoreduplication in this assay. Furthermore, the DNA histogram shown in Fig. 5 (to be discussed below) shows that RA-treated ST cells have no endoreduplication. ST thus prevented the usual RA-induced G1/0 arrest of HL-60 cells.
FIG. 5.

Continued cell cycling of RA-treated ST transfectants. DNA histograms for small t transfectants (ST C, upper left), small t transfectants treated with vinblastine (ST C+, upper right), RA-treated small t transfectants (ST RA, lower left), and RA-treated small t transfectants treated with vinblastine (ST RA+, lower right). Cells were cultured for 48 h in the absence or presence of retinoic acid and then a further 24 h in the absence or presence of vinblastine to generate the four cases shown. The horizontal axis is propidium iodide fluorescence, which is proportional to nuclear DNA content, and the vertical axis is the relative number of cells. The left peak, labeled G1, represents cells with G1 DNA content, whereas the right peak, labeled G2/M, represents cells with G2/M DNA content. Cells with intermediate DNA content are in S phase. The DNA histograms show no evidence of virally induced endoreduplication by cells with greater than 4n DNA content.
Although the RA-treated ST transfectants failed to accumulate in G1/0, the formal possibility exists that they stopped without cell cycle phase specificity. This would represent cell cycle phase-independent growth arrest, such as was reported for retinoid-treated NB4 human promyelocytic leukemia cells (8). In that case, non-G1/0-restricted cell cycle arrest was still characterized by hypophosphorylation of the RB tumor suppressor protein (28). In HL-60 and NB4 cells, the RB protein in proliferating cells is characteristically hyperphosphorylated (8, 9, 49). To ascertain the extent of RB hypophosphorylation as an indicator of proliferative status, vector control- or ST-transfected cells were cultured in the absence or presence of RA or D3 for 96 h and harvested for Western analysis of RB protein. Figure 4 shows the Western blot. Phosphorylation of the RB protein retards its gel mobility, making the hypophosphorylated RB protein evident as a faster-migrating band. RA- and D3-treated vector control transfectants showed the hypophosphorylated RB protein characteristic of growth arrest. In contrast, the RA- or D3-treated ST transfectants still showed abundant hyperphosphorylated RB protein. ST had thus blocked the usual RA-induced hypophosphorylation of the RB protein.
FIG. 4.
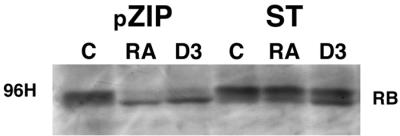
Effect of ST on induced RB protein hypophosphorylation. Western blot of RB tumor suppressor protein for vector control (pZIP) or small t (ST) stable transfectants that were untreated (C) or treated with retinoic acid (RA) or 1,25-dihydroxy vitamin D3 (D3) for 96 h is shown. Phosphorylation of the RB protein retards its relative gel mobility, making the hypophosphorylated RB protein apparent as a faster-migrating band. RB in RA- or D3-treated ST transfectants failed to shift to the hypophosphorylated form characteristic of growth arrest.
To determine if cells in which RA-induced RB hypophosphorylation was blocked would then continue to cycle, the cells were treated with vinblastine and analyzed for G2/M accumulation. ST transfectants were cultured in the absence or presence of RA for 48 h, which is when the onset of G0 arrest typically occurs for HL-60 cells not expressing ST. The mitotic blocker, vinblastine, was then added for another 24 h, which is sufficient time for most G1 cells to enter G2 if they are cycling. The cell cycle distribution of the cells was analyzed by flow cytometry. Cycling cells would accumulate in G2/M, causing an enrichment in G2/M cells, but noncycling cells would not. Figure 5 shows the resulting DNA histograms. ST-transfected cells without RA accumulated in G2/M after vinblastine treatment. The relative enrichment in G2/M cells reflects the kinetics of the cycling cells. In contrast, parallel cells not treated with vinblastine showed the distribution characteristic of cycling cells. RA-treated ST-transfected cells showed a similar accumulation in G2/M after vinblastine treatment, suggesting that they were cycling with kinetics not grossly different from those of untreated cells. ST thus prevents RA from inducing growth arrest.
RA induces apoptosis due to ST.
To determine if population size increases paralleled the continued cell cycling of RA-treated ST transfectants, ST and vector control transfectants were initiated in culture in the absence or presence of RA and the cell density was assayed periodically. Figure 6 shows the resulting growth curves. For RA-treated ST transfectants, cell density underwent one doubling and then remained approximately constant. In contrast, untreated ST transfectants continued to grow. The cell density of vector control transfectants grew throughout the period of culture, except when arrested at late times due to RA. Since RA-treated ST transfectants were still transiting the cell cycle, their approximately constant cell density after one doubling indicates that on average, approximately one of two daughters underwent apoptosis in order to maintain a roughly constant cell density in culture.
FIG. 6.

Inhibited numerical population growth of RA-treated ST transfectants. Relative cell density [N(t)/N(0)], cell density at time t divided by initial cell density at time zero hour, as a function of time (in hours) in culture in the absence (circle) or presence (triangle) of retinoic acid for vector control (open symbol) or ST (closed symbol) transfectants is shown. Cell density of RA-treated ST transfectants reaches a plateau after approximately one doubling.
RA-induced apoptosis in ST transfectants was also evidenced by the accumulation of nucleosomal DNA ladder formation and sub-G1 DNA cells and the appearance of segregated, condensed chromatin. ST or vector control transfectants were cultured in the absence or presence of RA and harvested, and their DNA was resolved on 2% agarose gels by electrophoresis. Figure 7 shows the resulting ethidium bromide-stained gel. RA-treated ST transfectants showed the DNA laddering characteristic of apoptotic cells. In contrast, no laddering was apparent for DNA extracted from either untreated ST transfectants or RA-treated vector control transfectants. As a positive control, untreated vector control transfectants allowed to undergo apoptosis due to nutritional insufficiency at high cell density after prolonged culture showed apoptotic DNA laddering. Apoptosis was also assayed by the appearance of a sub-G1 DNA subpopulation using flow cytometry of propidium iodide-stained cells. ST or vector control transfectants were cultured in the absence or presence of RA and harvested periodically for flow cytometric analysis of the percentage of cells with sub-G1 DNA. Figure 8 shows the percentage of cells with sub-G1 DNA at the indicated times in culture. RA-treated ST transfectants showed a progressively increasing percentage of cells with sub-G1 DNA. The onset occurred by 48 h, corresponding to the time when cell numbers of the RA-treated cells plateaued, and the percentage increased progressively thereafter. By 96 h, the sub-G1 subpopulation was significant and included fragments also detected in cytological preparations. Untreated ST transfectants and RA-treated vector control transfectants did not show an accumulation of sub-G1 DNA cells. The untreated vector control cells showed a small increase as prolonged culture and high cell densities at 96 h nutritionally depleted the cultures. This corroborated the appearance of DNA laddering noted above. Apoptosis was finally also assayed cytologically by the appearance of condensed, segregated chromatin detected by combined Hoechst 33342 and propidium iodide staining, using the fluorescence microscopy assay of Muscarella et al. (31). Cells were cultured as above and harvested for staining with Hoechst 33342 and propidium iodide. Fluorescence microscopy was used to determine the percentages of apoptotic cells at the indicated times. Viable cells appeared intact and fluoresced blue, due to the Hoechst dye, with diffuse blue staining of the nuclei. Necrotic cells were irregular and fluoresced red due to a compromised membrane that allowed propidium iodide into the cell. Apoptotic cells showed condensed, segregated chromatin that fluoresced blue or pink later in apoptosis (Fig. 9). Table 1 shows the percentages of cytologically detected apoptotic cells at the indicated times. The RA-treated ST transfectants showed an increase in apoptotic cells, but the RA-untreated ST transfectants and RA-treated vector control transfectants did not, confirming the above assays of apoptosis. No necrotic cells were detected.
FIG. 7.
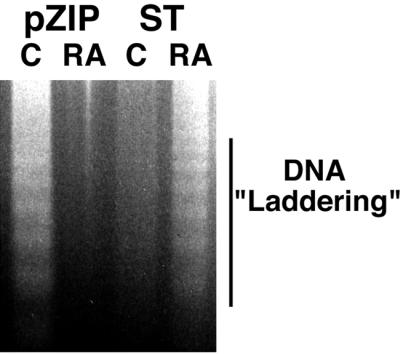
Apoptotic DNA laddering in RA-treated ST transfectants. Ethidium bromide-stained agarose gel resolving DNA from high-density vector control transfectants (pZIP) that were untreated (C) (lane 1), vector control transfectants treated with RA (RA) for 96 h (lane 2), small t transfectants (ST) that were untreated (C) (lane 3), ST transfectants treated with RA (RA) for 96 h (lane 4). ST transfectants treated with RA showed DNA laddering characteristic of apoptosis. High-density nutritionally compromised vector control transfectants (lane 1) were used as a positive control for apoptosis. These cells were deliberately induced to undergo apoptosis by not being fed or recultured for a week. However, nutritional insufficiency could not be responsible for the apoptosis of RA-treated ST cells, since the control ST cells and RA-treated pZIP vector control cells were at higher density (Fig. 6) but without apoptosis.
FIG. 8.

Apoptotic sub-G1 DNA cells. Apoptosis was measured by the percentage of cells with sub-G1 DNA as a function of time (in hours) in culture in the absence (circle) or presence (triangle) of RA for vector control (open symbol) or ST (closed symbol) transfectants. ST transfectants treated with RA showed accumulation of sub-G1 cells, indicating apoptosis. No accumulation was induced in vector control cells except for a small increase at the latest time point for untreated controls, which, unlike RA-treated cells, continued to proliferate and reached a high cell density severalfold greater than RA-treated cells.
FIG. 9.

Apoptotic cytology. Apoptosis of RA-treated ST-transfected HL-60 cells can be detected cytologically. Two cells show condensed, segregated chromatin revealed by Hoechst 33342 staining. The third cell is viable and shows a normal nucleus, stained with Hoechst 33342 but not propidium iodide, which the viable cell excludes. ST transfectants treated with RA showed accumulation of apoptotic cells, whereas untreated ST transfectants and vector control cells did not.
ST expression thus resulted in apoptosis after RA treatment. This was determined by several independent means, including continued cell cycling without an increase in cell number, appearance of DNA laddering, appearance of a sub-G1 DNA subpopulation, and cytology of Hoechst 33342- and propidium iodide-stained cells.
ST effects on RA, a myeloid inducer, do not extend to D3, a monocytic inducer.
Since HL-60 cells undergo myeloid differentiation in response to RA and also monocytic differentiation and G0 arrest in response to D3, the effects of ST on D3-induced differentiation and cell cycle arrest were analyzed to determine if the effects of ST extended from RA-induced myeloid to D3-induced monocytic differentiation. ST and vector control transfectants were cultured in the absence or presence of D3 and harvested to determine the percentages of functionally differentiated cells at the indicated times. Functional differentiation was determined by inducible oxidative metabolism, a functional differentiation marker for mature myelo-monocytic cells. Figure 10A shows the percentages of functionally differentiated cells at the indicated times. Vector control transfectants treated with D3 differentiated with kinetics characteristic of wild-type HL-60 cells, with onset at 48 h and progressively increasing percentages thereafter. D3-treated ST transfectants also differentiated, but with slower kinetics, lagging by over 24 h. Untreated ST or vector control cells did not differentiate.
FIG. 10.

Effects of ST on D3-induced differentiation and cell cycle arrest. (A) Functional differentiation measured by the percentage of cells able to reduce nitroblue tetrazolium (NBT) as a function of time (in hours) in culture in the absence (circle) or presence (triangle) of 1,25-dihydroxy vitamin D3 for vector control (open symbol) or ST (closed symbol) transfectants. (B) Functional differentiation measured by the percentage of cells able to reduce nitroblue tetrazolium (NBT) as a function of time (measured in cell cycle durations specific for the cell line) in culture in the absence (circle) or presence (triangle) of 1,25-dihydroxy vitamin D3 for vector control (open symbol) or ST (closed symbol) transfectants. (C) Percentage of cells in G1/0 as a function of time (in hours) in culture in the absence (circle) or presence (triangle) of 1,25-dihydroxy vitamin D3 for vector control (open symbol) or ST (closed symbol) transfectants. G1/0, specific cell cycle arrest is evidenced by enrichment in the relative number of G1/0 DNA cells. Flow cytometric DNA histograms showed no evidence of endoreduplication in any of the cultures. (D) Relative cell density [N(t)/N(0)], cell density at time t divided by initial cell density at time zero hour, as a function of time (in hours) in culture in the absence (circle) or presence (triangle) of 1,25-dihydroxy vitamin D3 for vector control (open symbol) or ST (closed symbol) transfectants. Growth of 1,25-dihydroxy vitamin D3-treated vector control transfectants was inhibited relative to that of untreated ones, but growth of 1,25-dihydroxy vitamin D3-treated ST transfectants was not inhibited relative to that of untreated ST transfectants.
Since the cell cycle of ST transfectants is slower than that of vector control transfectants, the slower kinetics of the D3-induced differentiation of ST transfectants may reflect their slower cell cycle clock. To normalize the differences between the cell cycle durations of the ST and vector control transfectants, the percentages of functionally differentiated cells were reanalyzed with the percentages plotted with respect to the cell cycle duration specific for each transfectant. Figure 10B shows the result. The D3-induced differentiation of ST transfectants was still delayed relative to vector control transfectants, although not as greatly.
To determine if ST inhibited the usual D3-induced G1/0 cell cycle arrest of HL-60 cells, ST and vector control cells cultured as above for analysis of differentiation were analyzed for the percentages of cells with G1/0 DNA by flow cytometry. D3-induced cell cycle arrest would be evidenced by enrichment in the relative number of cells with G1/0 DNA. Figure 10C shows the percentages of cells with G1/0 DNA at the indicated times. D3-treated vector control transfectants show an enrichment in G1/0 cells characteristic of cell cycle arrest, but D3-treated ST transfectants do not. The cell density of these cultures with respect to time is shown in Fig. 10D. Untreated vector control transfectants grew exponentially with a doubling time of approximately 24 h for the first 72 h, slowing thereafter with high-cell-density-induced nutritional depletion. D3-treated vector control transfectants showed growth inhibition relative to untreated cells. Untreated ST transfectants proliferated with a slower doubling time than vector control transfectants, but the D3-treated ST transfectants grew at essentially the same rate as untreated ST transfectants. ST expression thus prevented D3-induced growth arrest. There was also no D3-induced apoptosis in vector control or ST transfectants. Table 2 shows the percentage of apoptotic cells detected by sub-G1 DNA cells. ST expression thus allowed D3 to induce functional differentiation, albeit delayed, but not growth arrest. ST thus effectively uncoupled the usual D3-induced program of differentiation from G0 specific growth arrest.
TABLE 2.
Percentage of cells in sub-G1 population for D3-treated vector control (pZIP) or ST transfectants.
| Duration of treatment (h) | % Cells in sub-G1 population for:
|
|
|---|---|---|
| pZIP-D3 | ST-D3 | |
| 0 | 0.94 | 0.34 |
| 24 | 1.1 | 0.6 |
| 48 | 1.7 | 1.6 |
| 72 | 1.3 | 0.7 |
| 96 | 1.1 | 1.1 |
DISCUSSION
Expression of the polyomavirus ST in HL-60 human myeloblastic leukemia cells affected their cell cycle and ability to differentiate. RA- or D3-induced differentiation of HL-60 cells is known to depend on MAPK signaling (48, 49, 51, 52, 54), which can be regulated by PP2A. ST binds PP2A and can alter its function in potentially a variety of ways, including inhibition leading to enhanced MAPK activation. The present data show that ectopic expression of ST enhances ERK2 activation and redirects RA-induced differentiation and G0 arrest to apoptosis. In contrast to RA treatment, in which ST largely inhibited both induced differentiation and cell cycle arrest, D3 treatment was able to induce differentiation, albeit slightly retarded, without growth arrest. It thus appears that RA-induced differentiation and cell cycle arrest may both be regulated by PP2A, but only D3-induced growth arrest is. RA- and D3-induced cellular effects thus appear to depend differently in this way on PP2A. The ability of ST to disrupt RA-induced cellular effects supports a functional role for MAPK signaling in RA-induced differentiation and cell cycle arrest. ST has the striking effect of redirecting the cellular outcome of RA treatment from differentiation and cell cycle arrest to apoptosis, suggesting a critical role for MAPK signaling in determining the cellular outcome in response to RA.
ST affected signaling molecules, in particular ERK2 and RARα, which are known to be used by RA to induce HL-60 cell differentiation and cell cycle arrest. ST caused an increase in the amount of activated ERK2, which was not attributable to an increase in the total amount of ERK2. This is consistent with previous reports that SV40 ST enhanced MAPK signaling by binding and inhibiting PP2A (34). However, it should be noted that the present study does not present biochemical evidence for the association of ST and PP2A in HL-60 cells. Polyomavirus ST can also have potentially diverse effects that are not always easily reconcilable with a simple model of just binding and inhibition of PP2A (29). In the present data, ST also increased RARα expression levels. RA down regulated RARα expression in ST transfectants and vector transfectants, as reported for wild-type HL-60 cells (49). But ST transfectants still sustained higher levels of RARα expression than vector control transfectants even during RA treatment. RARα transcriptional activity has previously been reported to depend on PP2A-regulated phosphorylation of the RAR receptor, where inhibition of PP2A resulted in further RARα phosphorylation and enhanced transcriptional activity using a promoter-reporter assay (24). The present data suggest the possibility of PP2A-regulated RARα expression, as well as phosphorylation.
Although ST blocked RA-induced functional differentiation, it actually enhanced RA-induced CD11b expression. Interestingly, ST caused enhanced ERK2 activation, which is an early signal molecule change induced by RA in HL-60 cells. This is consistent with a previously suggested early dependence on MAPK signaling for RA-induced HL-60 cell differentiation (49). While functional differentiation characterized by inducible oxidative metabolism is a late-stage differentiation marker for mature myelo-monocytic differentiation of HL-60 cells, CD11b is an early cell surface differentiation marker. RA may thus still induce early parts of the cellular myeloid differentiation program, which is accelerated and then aborts due to ST. The supposition that ST-targeted PP2A inhibition enhances RA-induced CD11b expression is consistent with a previous report that okadaic acid, a PP2A inhibitor, enhanced RA-induced differentiation (28). It has been confirmed that at nanomolar concentrations okadaic acid increases ERK2 activation and causes enhanced cellular differentiation in response to RA (A. Yen, S. Varvayanis, S. Chang, and S. L. Won, unpublished data). Okadaic acid (2 nM) used with RA caused enhanced hypophosphorylation of the RB protein, G1/0 enrichment, and functional differentiation. By itself, the okadaic acid did not cause RB hypophosphorylation or differentiation, but it did retard cell growth and enrich the percentage of G2/M cells. Okadaic acid and ST thus have certain cellular effects in common. However, okadaic acid facilitated RA-induced functional differentiation, whereas ST did not. This may be attributable to targets of okadaic acid or ST other than PP2A which influence the cellular outcome. While the ST and okadaic acid data both implicate PP2A in regulating cellular response to RA, they also indicate that there may be potentially complex interactions with other critical regulatory molecules affected by okadaic acid or ST. Some of these may differentially affect early or late events in the RA-induced events leading to differentiation.
The present data present at least one obvious enigma. The cell density of RA-treated ST transfectants doubled and then reached a plateau. However, cells continued to transit the cell cycle. On average, one of two daughters must undergo apoptosis to sustain a constant cell density. The mechanism whereby one daughter continues to cycle but one undergoes apoptosis is unclear. Presumably, there must be some asymmetry between the two daughters, but the molecular basis thereof is enigmatic. Since the cell density doubled once before being arrested by apoptosis, an RA-induced species appears to be involved. One can speculate that this species must interact with ST or a downstream consequence of ST expression. The origins of asymmetric cell division have been of enduring interest in developmental biology and continue to be studied in a variety of models including Bacillus subtilis (25), Saccharomyces cerevisiae (26), Caenorhabditis elegans (10), and Drosophila (21), for which unequal apportionment of cell size after division and asymmetric distribution of chromosomes, transcription factors, or other factors have been indicated mechanistically. Molecular processes implicated have included phosphorylation signals, DNA methylation, protein targeting, and selective protein degradation (27), any of which might be not implausibly affected by ST.
In sum, the data show that ST prolongs G2/M and also affects critical processes that redirect the cellular outcome of RA signaling. ST affects signaling molecules that mediate the cellular effects of RA. The result is to redirect the cellular response to RA from differentiation and cell cycle arrest to apoptosis. Interestingly, in the case of D3-induced monocytic differentiation, ST uncouples induced differentiation from growth arrest, blocking D3-induced growth arrest but not differentiation. ST thus affects the mechanism by which induced differentiation and growth arrest are normally coupled.
ACKNOWLEDGMENTS
We are indebted to Joel Baines for critically reading the manuscript.
This study was supported in part by grants from the NIH (USPHS) and USDA.
REFERENCES
- 1.Asselin C, Gelinas C, Bastin M. Role of the three polyomavirus early proteins in tumorigenesis. Mol Cell Biol. 1983;3:1451–1459. doi: 10.1128/mcb.3.8.1451. [DOI] [PMC free article] [PubMed] [Google Scholar]
- 2.Asselin C, Vass-Marengo J, Bastin M. Mutation in the polyomavirus genome that activates the properties of large T associated with neoplastic transformation. J Virol. 1986;57:165–172. doi: 10.1128/jvi.57.1.165-172.1986. [DOI] [PMC free article] [PubMed] [Google Scholar]
- 3.Battle T, Levine R A, Yen A. Retinoic acid-induced blr1 expression promotes ERK2 activation and cell differentiation in HL-60 cells. Exp Cell Res. 2000;254:287–298. doi: 10.1006/excr.1999.4766. [DOI] [PubMed] [Google Scholar]
- 4.Battle T E, Roberson M S, Zhang T, Varvayanis S, Yen A. Retinoic acid-induced blr1 expression requires RARα, RXR, and MAPK activation and uses ERK2 but not JNK/SAPK to accelerate cell differentiation. Eur J Cell Biol. 2000;80:59–67. doi: 10.1078/0171-9335-00141. [DOI] [PubMed] [Google Scholar]
- 5.Berger H, Wintersberger E. Polyomavirus small T antigen enhances replication of viral genomes in 3T6 mouse fibroblasts. J Virol. 1986;60:768–770. doi: 10.1128/jvi.60.2.768-770.1986. [DOI] [PMC free article] [PubMed] [Google Scholar]
- 6.Bergqvist A, Söderbärg K, Magnusson G. Altered susceptibility to tumor necrosis factor alpha-induced apoptosis of mouse cells expressing polyomavirus middle and small T antigens. J Virol. 1997;71:276–283. doi: 10.1128/jvi.71.1.276-283.1997. [DOI] [PMC free article] [PubMed] [Google Scholar]
- 7.Breitman T R, Selonick S E, Collins S J. Induction of differentiation of the human promyelocytic leukemia cell line (HL-60) by retinoic acid. Proc Natl Acad Sci USA. 1987;77:2936–2940. doi: 10.1073/pnas.77.5.2936. [DOI] [PMC free article] [PubMed] [Google Scholar]
- 8.Brooks S C, III, Sturgill R, Choi J, Yen A. An RXR-selective analog attenuates the RAR alpha-selective analog-induced differentiation and non-G1-restricted growth arrest of NB4 cells. Exp Cell Res. 1997;234:259–269. doi: 10.1006/excr.1997.3620. [DOI] [PubMed] [Google Scholar]
- 9.Brooks S C, III, Kazmer S, Levin A A, Yen A. Myeloid differentiation and RB phosphorylation changes in HL-60 cells induced by RAR- and RXR-selective retinoic acid analogs. Blood. 1996;87:227–237. [PubMed] [Google Scholar]
- 9a.Cepko C L, Roberts B E, Mulligan R C. Construction and application of a highly transmissible murine retrovirus shuttle vector. Cell. 1984;37:1053–1062. doi: 10.1016/0092-8674(84)90440-9. [DOI] [PubMed] [Google Scholar]
- 10.Chamberlin H M, Sternberg P W. Mutations in the Caenorhabditis elegans gene vab-3 reveal distinct roles in fate specification and unequal cytokinesis in an asymmetric cell division. Dev Biol. 1995;170:679–689. doi: 10.1006/dbio.1995.1246. [DOI] [PubMed] [Google Scholar]
- 10a.Chen Y, Freund R, Listerud M, Wang Z, Talmage D A. Retinoic acid inhibits transformation by preventing phosphatidylinositol 3-kinase dependent activation of the c-fos promoter. Oncogene. 1999;18:139–148. doi: 10.1038/sj.onc.1202272. [DOI] [PubMed] [Google Scholar]
- 11.Cohen B, Liu Y, Druker B, Roberts T M, Schaffhausen B S. Characterization of pp85, a target of oncogenes and growth factor receptors. Mol Cell Biol. 1990;10:2909–2915. doi: 10.1128/mcb.10.6.2909. [DOI] [PMC free article] [PubMed] [Google Scholar]
- 12.Cohen P. The structure and regulation of protein phosphatases. Annu Rev Biochem. 1989;58:453–508. doi: 10.1146/annurev.bi.58.070189.002321. [DOI] [PubMed] [Google Scholar]
- 13.Collins S J, Gallo R C, Gallagher R E. Continuous growth and differentiation of human myeloid leukemic cells in suspension culture. Nature. 1977;270:347–349. doi: 10.1038/270347a0. [DOI] [PubMed] [Google Scholar]
- 14.Cooper G M. Oncogenes. 2nd ed. Boston, Mass: Jones and Bartlett; 1995. [Google Scholar]
- 15.Courtneidge S A, Smith A E. The complex of polyoma virus middle T antigen and pp60c-src. EMBO J. 1984;3:585–591. doi: 10.1002/j.1460-2075.1984.tb01852.x. [DOI] [PMC free article] [PubMed] [Google Scholar]
- 16.Gaub M P, Rochette-Egy C, Lutz Y, Ali S, Matthes H, Schever I, Chambon P. Immunodetection of multiple species of retinoic acid receptor alpha: evidence for phosphorylation. Exp Cell Res. 1992;201:335–346. doi: 10.1016/0014-4827(92)90282-d. [DOI] [PubMed] [Google Scholar]
- 17.Hendrix P, Turowski P M, Mayer-Jackel R E, Goris J, Hofsteenge J, Merlevede W, Hemmings B A. Analysis of subunit isoforms in protein phosphatase 2A holoenzymes from rabbit and Xenopus. J Biol Chem. 1993;268:7330–7337. [PubMed] [Google Scholar]
- 18.Holman P S, Gjoerup O V, Davin T, Schaffhausen B S. Characterization of an immortalizing N-terminal domain of polyomavirus large T antigen. J Virol. 1994;68:668–673. doi: 10.1128/jvi.68.2.668-673.1994. [DOI] [PMC free article] [PubMed] [Google Scholar]
- 19.Howe A K, Gaillard S, Bennett J S, Rundell K. Cell cycle progression in monkey cells expressing simian virus 40 small t antigen from adenovirus vectors. J Virol. 1998;72:9637–9644. doi: 10.1128/jvi.72.12.9637-9644.1998. [DOI] [PMC free article] [PubMed] [Google Scholar]
- 20.Kamibayashi C, Estes R, Slaughter C, Mumby M C. Subunit interactions control protein phosphatase 2A: effect of limited proteolysis, n-ethylmaleimide, and heparin on the interaction of the B subunit. J Biol Chem. 1991;266:13251–13260. [PubMed] [Google Scholar]
- 21.Knoblich J A, Jan L Y, Jan Y N. Deletion analysis of the Drosophila Inscuteable protein reveals domains for cortical localization and asymmetric localization. Curr Biol. 1999;9:155–158. doi: 10.1016/s0960-9822(99)80070-0. [DOI] [PubMed] [Google Scholar]
- 22.Kolzau T, Hansen R S, Zahra D, Reddel R R, Braithwaite A W. Inhibition of SV40 large T antigen induced apoptosis by small T antigen. Oncogene. 1999;18:5598–5603. doi: 10.1038/sj.onc.1202942. [DOI] [PubMed] [Google Scholar]
- 23.Lebrin F, Bianchini L, Rabilloud T, Chambaz E M, Goldberg Y. CK2α-protein phosphatase 2A molecular complex: possible interaction with the MAP kinase pathway. Mol Cell Biochem. 1999;191:207–212. [PubMed] [Google Scholar]
- 24.Lefebvre P, Gaub M P, Tahayato A, Rochette-Egly C, Formstecher P. Protein phosphatases 1 and 2A regulate the transcriptional and DNA binding activities of retinoic acid receptors. J Biol Chem. 1995;270:10806–10816. doi: 10.1074/jbc.270.18.10806. [DOI] [PubMed] [Google Scholar]
- 25.Lewis P J, Partridge S R, Errington J. ς factors, asymmetry, and the determination of cell fate in Bacillus subtilis. Proc Natl Acad Sci USA. 1994;91:3849–3853. doi: 10.1073/pnas.91.9.3849. [DOI] [PMC free article] [PubMed] [Google Scholar]
- 26.Losick R, Dworkin J. Linking asymmetric division to cell fate: teaching an old microbe new tricks. Genes Dev. 1999;13:377–381. doi: 10.1101/gad.13.4.377. [DOI] [PubMed] [Google Scholar]
- 27.Marczynski G T, Shapiro L. The control of asymmetric gene expression during Caulobacter cell differentiation. Arch Microbiol. 1995;163:313–321. doi: 10.1007/BF00404203. [DOI] [PubMed] [Google Scholar]
- 28.Morita K, Nishikawa M, Kobayashi K, Deguchi K, Ito M, Nakano T, Shima H, Nagao M, Kuno T, Tanaka C, et al. Augmentation of retinoic acid-induced granulocytic differentiation in HL-60 leukemia cells by serine/threonine protein phosphatase inhibitors. FEBS Lett. 1992;314:340–344. doi: 10.1016/0014-5793(92)81501-c. [DOI] [PubMed] [Google Scholar]
- 29.Mullane K P, Ratnofsky M, Cullere X, Schaffhausen B. Signaling from polyomavirus middle T and small T defines different roles for protein phosphatase 2A. Mol Cell Biol. 1998;18:7556–7564. doi: 10.1128/mcb.18.12.7556. [DOI] [PMC free article] [PubMed] [Google Scholar]
- 30.Mumby M C, Walter G. Protein serine/threonine phosphatases: structure, regulation, and functions in cell growth. Physiol Rev. 1993;73:673–699. doi: 10.1152/physrev.1993.73.4.673. [DOI] [PubMed] [Google Scholar]
- 31.Muscarella D E, Rachlinski M K, Sotiriadis J, Bloom S E. Contribution of gene-specific lesions, DNA-replication-associated damage, and subsequent transcriptional inhibition in topoisomerase inhibitor-mediated apoptosis in lymphoma cells. Exp Cell Res. 1998;238:155–167. doi: 10.1006/excr.1997.3832. [DOI] [PubMed] [Google Scholar]
- 32.Nishikawa M, Omay S B, Toyoda H, Tawara I, Shima H, Nagao M, Hemmings B A, Mumby M C, Deguchi K. Expression of the catalytic and regulatory subunits of protein phosphatase type 2A may be differentially modulated during retinoic acid-induced granulocytic differentiation of HL-60 cells. Cancer Res. 1994;54:4879–4884. [PubMed] [Google Scholar]
- 33.Ogris E, Mudrak I, Wintersberger E. Polyomavirus large and small T antigens cooperate in induction of the S phase in serum-starved 3T3 mouse fibroblasts. J Virol. 1992;66:53–61. doi: 10.1128/jvi.66.1.53-61.1992. [DOI] [PMC free article] [PubMed] [Google Scholar]
- 34.Pallas D C, Shahrik L K, Martin B L, Jaspers S, Miller T B, Brautigan D L, Roberts T M. Polyoma small and middle-T antigens and SV40 small T antigen form stable complexes with protein phosphatase 2A. Cell. 1990;60:167–176. doi: 10.1016/0092-8674(90)90726-u. [DOI] [PubMed] [Google Scholar]
- 35.Platko J D, Forbes M E, Varvayanis S, Williams M N, Brooks III S C, Cherington V, Yen A. Polyoma middle T antigen in HL-60 cells accelerates hematopoietic myeloid cell differentiation. Exp Cell Res. 1998;238:42–50. doi: 10.1006/excr.1997.3782. [DOI] [PubMed] [Google Scholar]
- 36.Roder H M, Hoffman F J, Schroeder W. Phosphatase resistance of ERK2 brain kinase PK40–34K2. J Neurochem. 1995;64:2203–2212. doi: 10.1046/j.1471-4159.1995.64052203.x. [DOI] [PubMed] [Google Scholar]
- 37.Sontag E, Fedorov S, Kamibayashi C, Robbins D, Cobb M, Mumby M. The interaction of SV40 small tumor antigen with protein phosphatase 2A stimulates the map kinase pathway and induces cell proliferation. Cell. 1993;75:887–897. doi: 10.1016/0092-8674(93)90533-v. [DOI] [PubMed] [Google Scholar]
- 38.Su W, Liu W, Schaffhausen B S, Roberts T M. Association of polyomavirus middle tumor antigen with phospholipase C-γ 1. J Biol Chem. 1995;270:12331–12334. doi: 10.1074/jbc.270.21.12331. [DOI] [PubMed] [Google Scholar]
- 39.Wang Q, Wiman K G. Polyoma virus middle T and small T antigens cooperate to antagonize p53-induced cell cycle arrest and apoptosis. Cell Growth Differ. 2000;11:31–39. [PubMed] [Google Scholar]
- 40.Weinberg R. Oncogenes and the molecular origins of cancer. In: Eckhart W, editor. Oncogenes of DNA tumor viruses. Cold Spring Harbor, N.Y: Cold Spring Harbor Laboratory Press; 1989. pp. 223–238. [Google Scholar]
- 41.Yen A. HL-60 cells as a model of growth control and differentiation: the significance of variant cells. Hematol Rev. 1990;4:5–46. [Google Scholar]
- 42.Yen A, Pardee A B. Exponential 3T3 cells escape in mid-G1 from their high serum requirement. Exp Cell Res. 1978;116:103–111. doi: 10.1016/0014-4827(78)90068-x. [DOI] [PubMed] [Google Scholar]
- 43.Yen A, Forbes M E. C-myc down regulation and precommitment in HL-60 cells due to bromodeoxyuridine. Cancer Res. 1990;50:1411–1420. [PubMed] [Google Scholar]
- 44.Yen A, Varvayanis S. Late dephosphorylation of the RB protein in G2 during the process of induced cell differentiation. Exp Cell Res. 1994;214:250–257. doi: 10.1006/excr.1994.1255. [DOI] [PubMed] [Google Scholar]
- 45.Yen A, Brown D, Fishbaugh J. Precommitment states induced during HL-60 myeloid differentiation: possible similarities of retinoic acid and DMSO induced early events. Exp Cell Res. 1987;173:80–84. doi: 10.1016/0014-4827(87)90333-8. [DOI] [PubMed] [Google Scholar]
- 46.Yen A, Forbes M, deGala G, Fishbaugh J. Control of HL-60 cell differentiation lineage specificity: a late event occurring after precommitment. Cancer Res. 1987;47:129–134. [PubMed] [Google Scholar]
- 47.Yen A, Forbes M E, Varvayanis S, Tykocinski M L, Groger R K, Platko J D. C-FMS dependent HL-60 cell differentiation and regulation of RB gene expression. J Cell Physiol. 1993;157:379–391. doi: 10.1002/jcp.1041570222. [DOI] [PubMed] [Google Scholar]
- 48.Yen A, Roberson M S, Varvayanis S. Retinoic acid selectively activates the ERK2 but not JNK/SAPK or p38 MAP kinases when inducing myeloid differentiation. In Vitro Cell Dev Biol Anim. 1999;35:527–532. doi: 10.1007/s11626-999-0063-z. [DOI] [PubMed] [Google Scholar]
- 49.Yen A, Roberson M S, Varvayanis S, Lee A T. Retinoic acid induces mitogen-activated protein (MAP) extracellular signal-regulated kinase (ERK) kinase-dependent MAP kinase activation needed to elicit HL-60 cell differentiation and growth arrest. Cancer Res. 1998;58:3163–3172. [PubMed] [Google Scholar]
- 50.Yen A, Sturgill R, Varvayanis S. Increasing c-FMS expression decreases retinoic acid concentration needed to cause cell differentiation and RB hypophosphorylation. Cancer Res. 1997;57:2020–2028. [PubMed] [Google Scholar]
- 51.Yen A, Sturgill R, Varvayanis S. Retinoic acid increases amount of phosphorylated RAF; ectopic expression of cFMS reveals that retinoic acid-induced differentiation is more strongly dependent on ERK2 signaling than induced G0 arrest is. In Vitro Cell Dev Biol Anim. 2000;36:249–255. doi: 10.1290/1071-2690(2000)036<0249:raiaop>2.0.co;2. [DOI] [PubMed] [Google Scholar]
- 52.Yen A, Sturgill R, Varvayanis S, Chern R. FMS (CSF-1 receptor) prolongs cell cycle, promotes retinoic acid induced hypophosphorylation of RB protein, G1 arrest and cell differentiation. Exp Cell Res. 1996;229:111–125. doi: 10.1006/excr.1996.0349. [DOI] [PubMed] [Google Scholar]
- 53.Yen A, Reece S L, Albright K L. Dependence of HL-60 myeloid cell differentiation on continuous and split retinoic acid exposures: pre-commitment memory associated with altered nuclear structure. J Cell Physiol. 1984;118:227–286. doi: 10.1002/jcp.1041180310. [DOI] [PubMed] [Google Scholar]
- 54.Yen A, Cherington V, Schaffhausen B, Marks K, Varvayanis S. Transformation defective polyoma middle T antigen mutants defective in PLCγ, PI-3 or SRC kinase activation enhance ERK2 activation and promote retinoic acid-induced cell differentiation like wild type middle. T. Exp Cell Res. 1999;248:538–551. doi: 10.1006/excr.1999.4423. [DOI] [PubMed] [Google Scholar]