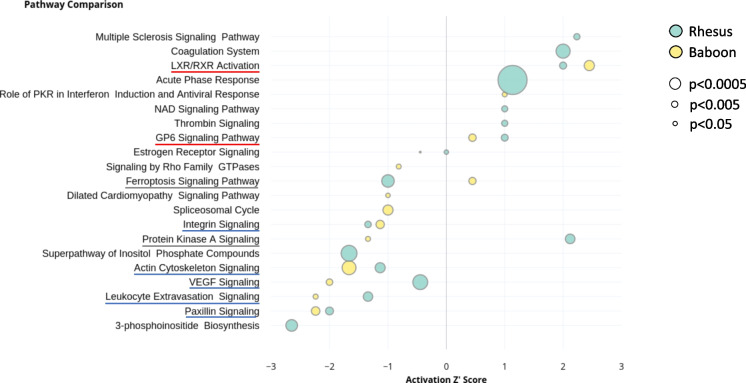
Fig. 2.
Comparison of top 21 canonical pathways in aged rhesus macaques and aged olive baboons. Rhesus macaques (cyan) and olive baboons (yellow) activation Z-scores (an inferred measurement of the pathway activation stated based on measured levels and IPA knowledge) is shown by bubble position on the X-axis, pathway names in the Y-axis, where p-values are represented by bubble size. Highly overlapping pathways were removed from analysis and only the most comprehensive pathway is displayed. Enriched pathways in both rhesus macaques and olive baboons are underlined in red (increased activation), blue (reduced activation), or grey (divergent)

