

Abstract
Ezetimibe is a potent inhibitor of cholesterol absorption that has been approved for the treatment of hypercholesterolemia, but its molecular target has been elusive. Using a genetic approach, we recently identified Niemann-Pick C1-Like 1 (NPC1L1) as a critical mediator of cholesterol absorption and an essential component of the ezetimibe-sensitive pathway. To determine whether NPC1L1 is the direct molecular target of ezetimibe, we have developed a binding assay and shown that labeled ezetimibe glucuronide binds specifically to a single site in brush border membranes and to human embryonic kidney 293 cells expressing NPC1L1. Moreover, the binding affinities of ezetimibe and several key analogs to recombinant NPC1L1 are virtually identical to those observed for native enterocyte membranes. KD values of ezetimibe glucuronide for mouse, rat, rhesus monkey, and human NPC1L1 are 12,000, 540, 40, and 220 nM, respectively. Last, ezetimibe no longer binds to membranes from NPC1L1 knockout mice. These results unequivocally establish NPC1L1 as the direct target of ezetimibe and should facilitate efforts to identify the molecular mechanism of cholesterol transport.
Keywords: cholesterol, intestinal brush border membranes
Blood cholesterol levels are regulated by several processes, including de novo synthesis, cholesterol absorption, and biliary clearance and excretion. Absorption of dietary and biliary cholesterol occurs in the proximal jejunum of the small intestine (1). Ezetimibe is a potent cholesterol and phytosterol uptake inhibitor (2, 3) and is used for the treatment of hypercholesterolemia. Ezetimibe effectively lowers circulating plasma cholesterol in humans by 15-20% (4-6), and coadministration of ezetimibe with 3-hydroxy-3-methylglutaryl CoA (HMG-CoA) reductase inhibitors (statins), inhibitors of cholesterol synthesis, results in additive effects on cholesterol reduction (7-11).
For the past decade, there have been intense efforts to determine the molecular target of ezetimibe. Uptake and sorting of cholesterol and phytosterols by intestinal enterocytes is a complex process (for a synopsis, see ref. 12). This phenomenon is believed to involve a variety of mediators, including the ATP-binding cassette (ABC) transporters ABCA1, ABCG5, and G8, and the scavenger receptor B1 (SRB1), but knockouts have ruled out each of these proteins as promoting net sterol uptake from the intestine (13-16). Other multidrug-resistance transporters in the ABC and RND (resistance-nodulation-division) superfamilies have also been proposed to be gatekeepers of intracellular sterol and lipid homeostasis in mammals, but their specific molecular functions remain uncertain (for a review, see ref. 17).
Recently, we demonstrated that Niemann-Pick C1-Like 1 (NPC1L1) (18) is essential in the ezetimibe responsive pathway of cholesterol absorption (19). This protein was identified as a potential candidate gene by a search of expressed sequence tag databases by using the following criteria: presence of a sterol-sensing domain (SSD), a plasma membrane secretion signal, and enriched expression in intestinal enterocytes. Mice deficient in NPC1L1 had ≈70% reduction in sterol absorption, with the residual being insensitive to ezetimibe (19). These findings convincingly demonstrated that NPC1L1 is central to cholesterol uptake in enterocytes and is in a pathway sensitive to ezetimibe, but did not establish the molecular basis.
To determine whether NPC1L1 is the direct molecular target of ezetimibe, we have established a radioligand binding assay for ezetimibe using enterocyte brush border membranes (BBMs) from several species. Binding affinities were determined for ezetimibe and several key analogs to native membranes, membranes from cells expressing recombinant NPC1L1, and enterocyte BBMs from NPC1L1-deficient mice. Together, the results definitively establish NPC1L1 as the direct target of ezetimibe in vivo.
Methods
Materials. The [3H]ezetimibe glucuronide (EZE-gluc) [1-([2,6-3H]-4-fluorophenyl)-(3R)-[3-(4-fluorophenyl)-(3S)-hydroxypropyl]-(4S)-([3,5-3H]-4-hydroxyphenyl)-2-azetidinone; 34.5 Ci/mmol; 1 Ci = 37 GBq and its analogs were prepared at Merck Research Laboratories. Digitonin was purchased from Wako Pure Chemical (Osaka).
Preparation of BBMs. Membranes were prepared from Rhesus macaque (Macaca mulatta), rat (male Sprague-Dawley), and mouse (male C57BL/6N) intestines by using a Mg2+ precipitation method as described with some modifications (20-22). The proximal intestines from freshly killed animals were cut into ≈10-cm segments, washed with ice-cold saline buffer (buffer A: 26 mM NaHCO3/0.96 mM NaH2PO4/5 mM Hepes/5.5 mM glucose/117 mM NaCl/5.4 mM KCl, pH 7.40), placed on cold glass plates, and opened longitudinally, and the mucosa was scraped with glass microscope slips. The mucosa could be used fresh or frozen with identical results. To prepare the membranes, the mucosal scrapings were resuspended in 20 volumes of cold buffer consisting of 300 mM d-mannitol/5 mM EGTA/12 mM Tris (pH 7.40) with HCl, containing 0.1 mM PMSF and a 1% dilution of a protease inhibitor mixture (set 1, Calbiochem). They were homogenized by using a Polytron at medium speed on ice until inspection with a microscope indicated complete cell lysis. Then, solid MgCl2 was added slowly with stirring to a final concentration of 10 mM, and the solution was kept stirring on ice for 15 min. Cellular debris was removed by centrifugation for 15 min at 3,000 × g, and the membranes were recovered by centrifugation for 60 min at 48,000 × g. The membranes were further rinsed by resuspension in a buffer containing 50 mM d-mannitol, 5 mM EGTA, and 2 mM Tris at pH 7.40 and centrifugation for 60 min at 48,000 × g. The final pellet was resuspended in 120 mM NaCl and 20 mM Tris at pH 7.40 to a concentration of 10-20 mg/ml protein, aliquoted, frozen in liquid nitrogen, and stored at -80°C. The activity was stable indefinitely and could be freeze-thawed with minimal loss of activity.
Membrane protein was measured by the Bradford assay (23) using BSA as standard. The enrichment in BBMs was assessed by using γ-glutamyltransferase as a marker enzyme (21), which indicated 6-fold enrichment over the initial homogenate.
Transient Expression of NPC1L1. Plasmid pCR3.1 expressing rat NPC1L1 (GenBank accession no. AY437867) or pCDNA3.1(-) expressing human NPC1L1 (GenBank AY437865) were prepared by using standard molecular biology protocols. Human embryonic kidney (HEK) 293 cells (American Type Culture Collection) were seeded at 10 × 106 cells per T-225 flask (Corning) in DMEM containing 10% FCS, 4.5 g/liter d-glucose and l-glutamine at 18 h before transfection. They were transiently transfected with 25 μg of DNA by using FuGENE transfection reagent (Roche Biochemical) at a FuGENE/DNA ratio of 6:1. After transfection, the cells were incubated at 37°C and 5% CO2 for 48 h and then harvested by using PBS-based cell dissociation buffer (GIBCO), pelleted at 500 × g, snap frozen on dry ice, and stored at -80°C.
Membrane Preparation from HEK 293 Cells. Membranes were prepared by resuspending the frozen cell pellets in 10 volumes of 20 mM Hepes/Tris buffer at pH 7.40 containing 8% sucrose, and sonicating the suspensions with a probe sonicator on ice until most of the cells were lysed. To isolate the membranes, the sonicates were centrifuged at 1,600 × g for 10 min to remove cell debris, and then the supernatants were centrifuged at 125,000 × g for 3 h to recover the membranes. The recombinant NPC1L1 appears to localize in particularly small vesicles, such that complete recovery requires this prolonged centrifugation time. The recovered membranes were resuspended in 20 mM Hepes/Tris buffer at pH 7.40 containing 160 mM NaCl and 5% glycerol, and stored at 10-20 mg/ml protein at -80°C. The recovery amounted to 80% of the binding in the initial homogenate.
[3H]EZE-gluc Binding Assay. Assays were conducted in 12 × 75 mm glass test tubes and total volume 20-100 μl. In general, frozen membranes were diluted in buffer A alone or buffer A containing 0.03% taurocholate and 0.05% digitonin to a final concentration of 0.5-5 mg/ml. Final concentrations of [3H]EZE-gluc 1 were typically 25-50 nM and were delivered as DMSO or CH3CN solutions. Competing ligands were likewise added as DMSO solutions to give a total 1-5% organic solvent content. Nonspecific binding was defined by competition with 100-500 μM EZE-gluc. At least three components of buffer A (the bicarbonate and phosphate salts and glucose) were later found to be inconsequential and were routinely omitted. Reactions were incubated until equilibrium was achieved (1 h for rat or 3 h for rhesus membranes).
Bound ligand was recovered by single-tube vacuum filtration on GF/C glass fiber filters (Whatman). The filters were pre-treated by soaking with 0.5% polyethylenimine to reduce nonspecific binding. Filtration was accomplished by adding 2.5 ml of ice cold buffer (120 mM NaCl/0.1% sodium cholate/20 mM Mes, pH 6.70) to the assay tube, pouring the mixture through the filter, and then rinsing the tube and filter twice more with another 2 × 2.5-ml buffer. The filters were counted in 7-ml vials by using Ultima Gold MV liquid scintillation fluid (Packard). Where triplicate assays were performed, the standard error was typically <4%. As an example, assay of rat BBMs at 2 mg/ml in the presence of 400,000 dpm (50 nM) [3H]EZE-gluc gave 15,000 dpm specific binding and 3,000 dpm nonspecific binding. The filters contributed most of the nonspecific binding (2,000 dpm).
Effect of Detergents on [3H]EZE-gluc Binding. A practical problem encountered in work with the recombinant NPC1L1 was that the number of binding sites in transfected NPC1L1-293 cell membrane preparations initially appeared quite low. This unexpected result prompted investigation of the influence of several detergents on apparent binding affinity below their critical micelle concentrations. Among the most effective were taurocholate and digitonin, particularly in combination. In the most dramatic case, a combination of 0.03% taurocholate and 0.05% digitonin increased apparent binding by 5-fold to native rat BBM preparations, and as much as 25-fold to recombinant rat and human NPC1L1-293 cell membranes, as shown in Fig. 1. The effect is primarily on Bmax rather than KD, and it also depends on membrane concentration. Although most of the initial work with native membrane preparations did not employ these detergents, they greatly facilitated Ki comparisons between recombinant and native NPC1L1 (see Figs. 5 and 6 and Table 2).
Fig. 1.

Influence of taurocholate and digitonin on [3H]EZE-gluc binding. Equal amounts (25 μg of protein) of rat BBM, or membranes from HEK 293 cells transiently expressing recombinant rat and human NPC1L1, were incubated with 25 nM 1 in a final volume of 20 μl until equilibrium was achieved. The incubation conditions were buffer A with and without sodium taurocholate and digitonin to a final concentration of 0.03% and 0.05%, respectively. Total binding (black), nonspecific binding in the presence of 100 μM unlabeled EZE-gluc (red), and specific binding (green) are shown.
Fig. 5.

Comparison of binding affinities for recombinant NPC1L1-293 cell membranes and native BBMs. Plots show determination of Ki values for selected analogs of EZE-gluc against recombinant rat and human NPC1L1 membranes prepared from transiently transfected HEK 293 cells compared with native rat and rhesus BBMs. The binding assays were conducted in a final volume of 20 μl in the presence of 0.03% sodium taurocholate and 0.05% digitonin until equilibrium was achieved. The structures and Ki values are shown in Table 2. Membrane sources are as follows: native rat (A), recombinant rat (B), native rhesus monkey (C), recombinant human (D). Conditions were as follows: 1.25 mg/ml protein and 100 nM 1 for A, B, and D, and 1.25 mg/ml protein and 20 nM 1 for C. Observed total and nonspecific binding in the absence of inhibition were 7,700 and 1,100 (A), 33,000 and 1,100 (B), 7,300 and 367 (C), and 19,200 and 1,000 (D) dpm. Analogs were 1, EZE-gluc (red squares); ent-1, the glucuronide of the enantiomer of ezetimibe (open black circles); 2 (blue circles); 3 (open red squares); 4 (open black triangles); and 5 (blue triangles), as defined in Table 2.
Fig. 6.

Loss of binding affinity in NPC1L1-deficient mice. (A) Enterocyte BBMs were prepared from NPC1L1-deficient male mice and same sex WT littermates, and they were tested for binding of 1. Conditions for binding were 5 mg/ml protein and 500 nM 1 in a volume of 20 μl and in the presence of 0.03% sodium taurocholate and 0.05% digitonin. Total (black), nonspecific in the presence of 500 μM cold EZE-gluc (red), and specific (green) binding are indicated, respectively, and error bars represent triplicate measurements. Membranes from WT mice are given on the left, and membranes from NPC1L1-deficient mice are given on the right. Although specific binding is readily detectable in WT mice, it is absent in NPC1L1 deficient mice. (B) Competition of unlabeled EZE-gluc against 1. Membranes from WT mice (red squares) gave Ki = 12,000 nM, whereas specific binding was virtually undetectable in membranes from the knockout animals (black circles). Conditions were those described in A.
Table 2. Comparison of Ki values for recombinant NPC1L1 and native enterocyte BBMs.
 | ||||||
|---|---|---|---|---|---|---|
|
Ki, nM
|
||||||
| Analog | X | Y | Rat BBM | Rat NPC1L1 | Human NPC1L1 | Monkey BBM |
| 1 | OH (S) | H | 390 | 210 | 220 | 15 |
| ent-1† | OH (R) | H | 130,000 | 74,000 | 130,000 | 22,000 |
| 2 | H | H | 1,600 | 820 | 1,000 | 150 |
| 3 | =O | H | 33,000 | 23,000 | 14,000 | 3,300 |
| 4 | OH (R) | H | 2,800 | 1,700 | 1,300 | 120 |
| 5 | OH (S) | OH | 280 | 360 | 210 | 60 |
Six analogs of EZE-gluc are compared for their potency against rat and human recombinant NPC1L1 and native rat and monkey BBM preparations. The ent-EZE-gluc has the stereochemical configuration 3S, 4R and is the glucuronide of the enantiomer of ezetimibe. The titrations supporting these data are shown in Fig. 5. These determinations were conducted in buffer containing 0.03% taurocholate and 0.05% digitonin, levels below the critical micelle concentrations of these detergents. These conditions enhanced apparent binding by as much as 25-fold for the recombinant preparations (principally a Bmax effect), and greatly facilitated a quantitative comparison of Ki values for 1 and its analogs (see Methods).
Glucuronide of the enantiomer of ezetimibe has stereochemical configuration 3S, 4R
The molecular basis for this dramatic enhancement by detergents is obscure. The individual effects of taurocholate and digitonin appear to be additive. At concentrations below their critical micelle concentration, these detergents do not appreciably solubilize membrane proteins, but they do disrupt the permeability barrier of vesicles. Because their effect is principally to increase the number of binding sites (Bmax), perhaps they act by disrupting the membranes enough to allow EZE-gluc to gain access to transporter facing the inside, or otherwise hidden in the interior of the multilamellar membrane vesicles.
Data Analysis. After correction for nonspecific binding, saturation-binding data were fit by nonlinear regression (sigma plot) to the single-site expression [B] = Bmax × [L]/([L] + KD). Linear Scatchard plots are shown. Data on Ki from competition experiments were analyzed by nonlinear regression to the expression  and corrected where required for radioligand competition as
 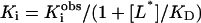 .
.
First-order rate constants (kobs and koff) were determined by nonlinear regression to the first-order rate equation A = Aoe-kt. Kinetic data for kon were analyzed according to Weiland and Molinoff (24) by using the equation kon = kobs([LR]e/([L][LR]max)), where [L] is the concentration of ligand, [LR]e is the concentration of the complex at equilibrium, [LR]max is the maximum number of receptors present, and kobs is the apparent first-order rate constant.
Results and Discussion
After in vivo administration, ezetimibe is rapidly glucuronidated and recycled by the enterohepatic circulation to its target site in the intestine. This glucuronide metabolite is at least as potent as ezetimibe with respect to inhibition of cholesterol uptake (2, 25) and has more suitable physical properties for in vitro binding studies. Accordingly, evidence for specific binding to native enterocyte extracts was sought by using [3H]EZE-gluc 1 (Structure 1).
Structure 1.

[3H]EZE-gluc 1.
Results of initial binding studies using a traditional rapid-filtration assay on glass-fiber filters showed marginal specific binding to homogenates of scrapings from rat intestine. Subsequently, preparation of BBMs from these homogenates markedly improved the specific binding and showed that it exclusively resides in the membrane fraction. This assay and the BBM preparations are described in detail in Methods.
Binding studies using [3H]EZE-gluc subsequently were extended to enterocyte BBM preparations from mouse and rhesus monkey, as well as rat (Table 1). The binding affinity is relatively weak in rat membranes (KD = 542 nM) and weaker in murine membranes (KD = 10,000 nM). In contrast, binding affinity in rhesus monkey membranes is ≈10-fold more potent than for rat (KD = 41 nM).
Table 1. Comparison of ezetimibe binding affinity and cross-species efficacy.
| Species | KD, nM | ED50, mg/Kg |
|---|---|---|
| Mouse | 12,000 | 0.5000 |
| Rat | 542 | 0.0300 |
| Monkey | 41 | 0.0005 |
The KD values refer to [3H]EZE-gluc binding to enterocyte BBM preparations, as determined in the absence of detergents. The in vivo ED50 values are from cholesterol absorption and cholesterol feeding studies with ezetimibe in rat (2), monkey (2), and mouse (22). The correlation suggests the binding data are measuring the target of ezetimibe in vivo.
The binding of [3H]EZE-gluc to rat and monkey BBMs was examined in detail, including determination of the number of binding sites, on and off rates, and competition by unlabeled compound (Fig. 2). The Scatchard analyses and the specific/nonspecific binding windows are shown in Fig. 2 A, B, F, and G. The observed binding was specific, saturable, and consistent with a single molecular site. The number of binding sites varied from 5-20 pmol/mg membrane protein, depending on species and preparation.
Fig. 2.

Scatchard analyses, kinetics studies, and competition studies for [3H]EZE-gluc 1 binding to rat and monkey enterocyte BBMs. (A) Saturation binding of 1 to rat BBMs. Observed total (filled circles) and nonspecific (open circles) binding, determined in the presence of 100 μM unlabeled EZE-gluc, are shown; specific binding (red squares) was assessed from the difference between total and nonspecific binding. Binding was measured at 2.5 mg/ml protein in a volume of 100 μl after 1 h of incubation. Data were fit by nonlinear regression as described in Methods. (B) Linear Scatchard representation, showing that the binding data identify a single high-affinity site with KD = 542 nM and Bmax = 20.7 pmol/mg protein. (C) Plot shows apparent rate of specific binding of 1 to rat BBM vesicles. Conditions were 25 nM 1 and3mg/ml protein at 25°C. The second-order rate constant kon (0.55 × 10⁻⁴ M-1 s-1) was calculated from kobs (0.004 s-1) as described in Methods.(D) Plot shows rate of dissociation of 1 from the same preparation. After the complex was formed by incubating 25 nM 1 and3mg/ml protein for 1 h, dissociation was initiated by competition with 100 μM unlabeled EZE-gluc. The curve is theoretical for koff = 0.0024 s-1. (E) Equilibrium determination of KD for EZE-gluc by competition of unlabeled compound against 1. Membranes (1.5 mg/ml protein) were incubated with 1 (50 nM) and the indicated concentrations of EZE-gluc for 1 h to ensure equilibrium. KD at equilibrium is 600 nM. (F-J) Corresponding measurements for rhesus monkey, which were conducted with 0.5-1.25 mg/ml protein and 22-50 nM 1, with incubation times of >3 h. Corresponding constants were KD = 41 nM, Bmax = 5.5 pmol/mg protein, kobs = 0.00028 s-1, kon = 3.9 × 10³ M-1 s-1, koff = 1.23 × 10⁻⁴ s-1, and equilibrium KD = 38.6 nM.
The rates for binding and dissociation were also determined and found to be slow relative to those typically observed for protein-ligand interactions. The rate constants for association to rat and monkey BBMs are kon = 5.54 and 3.90 × 10³ M-1 s-1(Fig. 2 C, D, H, and I). These are 10,000-fold smaller than the diffusion-controlled limit of 108-109 M-1 s-1. Similarly, these complexes are unusually long-lived, dissociating with rate constants of koff = 2.4 × 10⁻³ s-1 and 1.2 × 10⁻⁴ s-1 at 25°C, equivalent to half-lives of 5 and 96 min for the rat and monkey complexes, respectively. In comparison, half-lives are normally <1 s for dissociation of common diffusion-controlled 100 nM KD ligands. These rate constants predict KD values (KD = koff/kon) of 440 and 32 nM, respectively, which agree well with those measured by equilibrium titration (Fig. 2 E and J) and saturation (Fig. 2 B and G). Such slow-forming, long-lived complexes suggest that conformational changes in the protein are rate-limiting.
The binding affinities of 1 to BBMs correlate well across species with the sensitivity to ezetimibe inhibition of cholesterol uptake in vivo (mouse < rat < monkey) (2, 26-27), consistent with the hypothesis that the assay is relevant to the target of ezetimibe in vivo (Table 1). As evidence that this interaction is very specific, the glucuronide of the enantiomer of ezetimibe was prepared and found to be completely inactive in vitro (Ki > 100 × KD for EZE-gluc in all species) and in vivo (data not shown) in a rat acute cholesterol-absorption model.
To obtain further evidence that the binding assay was detecting the target of ezetimibe in vivo, the specific binding affinity of 1 was measured along the intestinal axis. Previous studies have established that cholesterol absorption occurs primarily in the jejunum and is substantially lower in the ileum and duodenum (1). The binding studies of [3H]ezetimibe glucuronide to both rat and rhesus confirmed this prediction, with the highest concentration of binding sites peaking in the proximal jejunum. The distribution is illustrated in Fig. 3. Together, the above results strongly suggest that the observed binding is due to the target of ezetimibe in vivo.
Fig. 3.

Intestinal distribution of ezetimibe binding sites. (A) Rhesus BBMV. The last 10 cm (ileum) of one small intestine was separated and the remaining intestine was divided into three segments (proximal, middle, and distal) of equal length (70 cm each). (B) Rat BBMV. The last 10 cm (containing the ileum) of small intestines from 25 rats were separated, and the remaining intestines were divided into three segments (proximal, middle, distal) of equal length (36 cm each). Aliquots of BBMs (75 or 200 μg protein per assay for rhesus or rat, respectively) were incubated with 50 nM [3H]EZE-gluc in the absence and presence of 100 μM unlabeled EZE-gluc until equilibrium was achieved.
Pursuing the recent evidence indicating that NPC1L1 is an essential component of the pathway inhibited by ezetimibe, recombinant human NPC1L1 was expressed in HEK 293 cells (Fig. 4A). Preliminary binding studies using 1 revealed specific binding to membrane preparations from cells expressing NPC1L1 and no specific binding to membranes from mock transfected cells (data not shown). Binding to NPC1L1 expressing cells was also observed with a BODIPY-labeled fluorescent EZE-gluc analog (SCH354909) (15) (Fig. 4Ba). Binding of SCH354909 was clearly evident at the cell surface membrane of the NPC1L1-expressing cells and was abolished in the presence of excess unlabeled EZE-gluc (Fig. 4Bc). No binding was observed in WT HEK 293 cells (Fig. 4 B b and d). These results demonstrated that EZE-gluc binds specifically to NPC1L1.
Fig. 4.

Expression of human NPC1L1 in HEK 293 cells. (A) Detection of NPC1L1 in a stably transfected HEK 293 cell line (NPC1L1-293). Cell lysates from HEK 293 cells expressing NPC1L1 and WT cells were analyzed by gel electrophoresis and Western blotting with an anti-NPC1L1 antibody A1801 (19). An excess of NPC1L1-specific peptide was included to assess specificity of the antibody for NPC1L1. (B) Confocal microscope images of a fluorescent EZE-gluc analog (SCH354909) bound to the surface of NPC1L1-293 cells. Binding of SCH354909 to NPC1L1-293 cells (a), nonspecific binding of SCH354909 to NPC1L1-293 cells in the presence of 100μM unlabeled EZE-gluc (b), and binding of SCH354909 to WT HEK 293 cells (c), and nonspecific binding of SCH354909 to WT HEK 293 cells in the presence of 100 μM unlabeled EZE-gluc (d) are shown. In each case, plated cells were incubated in culture media with 500 nM SCH354909 (15) for 4 h at 37°C. Cells were subsequently washed with PBS and fluorescence was detected by using confocal microscopy.
To obtain evidence that NPC1L1 is the direct binding target of ezetimibe in vivo, binding affinities of 1 and several key analogs were determined for recombinant rat and human NPC1L1 expressed in HEK 293 cell membranes and compared with those for native rat and rhesus intestinal enterocyte BBMs. A series of ezetimibe analogs was selected with subtle structural diversity but with binding affinities to native BBMs that covered a range of 1,000-fold. As shown in Fig. 5 and Table 2, the KD values for recombinant rat NPC1L1 and native rat BBMs are virtually identical, strongly suggesting that NPC1L1 is the molecular target of ezetimibe in vivo. In the case of membranes from cells expressing recombinant human NPC1L1, the binding affinities also parallel those observed in rat membranes, whereas binding affinities for native monkey BBMs are uniformly ≈10-fold more potent. This result is consistent with the finding that ezetimibe is an order of magnitude more potent in monkeys than in humans or rats (2, 28).
Conclusive evidence that NPC1L1 is the target of ezetimibe was provided by studies with tissues from NPC1L1-deficient mice. Enterocyte BBMs prepared from NPC1L1-deficient mice showed no detectable specific binding affinity for 1, whereas membranes from age-matched WT mice showed a high level of specific binding with KD = 12 μM (Fig. 6).
Recently, an intracellular annexin 2/caveolin 1 complex (29) and an enterocyte cell surface aminopeptidase N (30) have been suggested as potential targets for ezetimibe. However, these studies did not include a quantitative comparison of binding between recombinant proteins and BBMs, nor did they report deletion of the putative target in genetically modified mice. SR-BI (scavenger receptor type B1) was also identified as a potential target by using an expression cloning strategy employing ezetimibe binding to candidate proteins; this hypothesis was readily dismissed when neither cholesterol absorption nor ezetimibe activity were affected in SR-BI-deficient mice (16). Conversely, this article demonstrates that ezetimibe binds to native intestinal membranes and cells expressing recombinant NPC1L1 with comparable affinity and does not bind to membranes from NPC1L1-deficient mice, indicating a specific binding interaction between NPC1L1 and ezetimibe. Together with the previously published findings that mice deficient in NPC1L1 are defective in intestinal cholesterol uptake and are no longer responsive to ezetimibe (19), these data definitively establish NPC1L1 as the direct target of ezetimibe.
Further insights into the molecular mechanism of cholesterol transport by NPC1L1 will be required to fully understand how ezetimibe binding blocks intestinal cholesterol absorption. Although it is clear that ezetimibe binding to NPC1L1 is sufficient to block cholesterol uptake, it is reasonable to speculate that NPC1L1 functions within a multiprotein complex to transport cholesterol.
A better understanding of the putative molecular interaction between NPC1L1 and cholesterol may facilitate an understanding of the transport process. In this regard, one of the most interesting features of NPC1L1 is that it contains the SSD originally observed in SCAP [sterol regulatory element binding protein (SREBP) cleavage-activating protein]. SCAP controls activation of SREBP, a transcription factor which controls >35 genes related to lipid and cholesterol homeostasis (31). The SSD, consisting of ≈180 aa in a packet of five putative membrane-spanning helices, also serves a regulatory function in two key enzymes on the cholesterol biosynthesis pathway and is present in the receptor Patched. Recently, high-affinity binding of cholesterol to the SSD on SCAP has been demonstrated (32), suggesting that cholesterol may similarly bind to the SSD of NPC1L1. Similar competition experiments between ezetimibe and cholesterol will be needed to define precisely whether NPC1L1 binds cholesterol and, therefore, is the cholesterol transporter per se or, alternatively, an associated regulatory component that indirectly influences cholesterol transport.
In summary, the data presented here clearly identify NPC1L1 as the direct molecular target of ezetimibe. These results may lead to a better understanding of the molecular mechanism of cholesterol transport and the design of even more potent cholesterol-absorption inhibitors.
Acknowledgments
We thank Vinay Bansal, Jin Cao, Linda Egger, Steve Fried, Bonnie H. Friscino, Lizbeth Hoos, Susan Iliff, Veronica Jennings, Joanne Jiang, Usha Kidambi, Lei Quan, Sushma Patel, Liz Somers, Glen Tetzloff, Sanskruti Vaidya, Renee Weikel, and Xiaorui Yao for their important contributions to this research. We also thank Samuel Wright and Catherine Strader for their critical review of the manuscript.
This paper was submitted directly (Track II) to the PNAS office.
Abbreviations: NPC1L1, Niemann-Pick C1-Like 1; HEK, human embryonic kidney; SSD, sterol-sensing domain; EZE-glue, ezetimibe glucuronide; BBM, brush border membranes.
References
- 1.Grundy, S. M. (1983) Annu. Rev. Nutr. 3, 71-96. [DOI] [PubMed] [Google Scholar]
- 2.Clader, J. W. (2004) J. Med. Chem. 47, 1-9. [DOI] [PubMed] [Google Scholar]
- 3.Davis, H. R., Jr., Zhu, L. J., Hoos, L. M., Tetzloff, G., Maguire, M., Liu, J., Yao, X., Iyer, S. P., Lam, M. H., Lund, E. G., et al. (2004) J. Biol. Chem. 279, 33586-33592. [DOI] [PubMed] [Google Scholar]
- 4.Bays, H. E., Moore, P. B., Drehobl, M. A., Rosenblatt, S., Toth, P. D., Dujovne, C. A., Knopp, R. H., Lipka, L. J., Lebeaut, A. P., Yang, B., et al. (2001) Clin. Ther. 23, 1209-1230. [DOI] [PubMed] [Google Scholar]
- 5.Dujovne, C. A., Ettinger, M. P., McNeer, J. F., Lipka, L. J., LeBeaut, A. P., Suresh, R., Yang, B. & Veltri, E. P. (2002) Am. J. Cardiol. 90, 1092-1097. [DOI] [PubMed] [Google Scholar]
- 6.Knopp, R. H., Gitter, H., Truitt, T., Bays, H., Manion, C. V., Lipka, L. J., LeBeaut, A. P., Suresh, R., Yang, B. & Veltri, E. P. (2003) Eur. Heart J. 24, 729-741. [DOI] [PubMed] [Google Scholar]
- 7.Gagné, C., Bays, H. E., Weiss, S. R., Mata, P., Quinto, K., Melino, M., Cho, M., Musliner, T. A. & Gumbiner, B. (2002) Am. J. Cardiol. 90, 1084-1091. [DOI] [PubMed] [Google Scholar]
- 8.Kerzner, B., Corbelli, J., Sharp, S., Lipka, L. J., Melani, L., LeBeaut, A., Suresh, R., Mukhopadhyay, P. & Veltri, E. P. (2003) Am. J. Cardiol. 91, 418-424. [DOI] [PubMed] [Google Scholar]
- 9.Melani, L., Mills, R., Hassman, D., Lipetz, R., Lipka, L., LeBeaut, A., Suresh, R., Mukhopadhyay, P. & Veltri, E. (2003) Eur. Heart J. 24, 717-728. [DOI] [PubMed] [Google Scholar]
- 10.Davidson, M. H., McGarry, T., Bettis, R., Melani, L., Lipka, L. J., LeBeaut, A. P., Suresh, R., Sun, S. & Veltri, E. P. (2002) J. Am. Coll. Cardiol. 40, 2125-2134. [DOI] [PubMed] [Google Scholar]
- 11.Ballantyne, C. M., Houri, J., Notarbartolo, A., Melani, L., Lipka, L. J., Suresh, R., Sun, S., LeBeaut, A. P., Sager, P. T. & Veltri, E. P. (2003) Circulation 107, 2409-2415. [DOI] [PubMed] [Google Scholar]
- 12.Klett, E. L. & Patel, S. B. (2004) Science 303, 1149-1150. [DOI] [PMC free article] [PubMed] [Google Scholar]
- 13.Berge, K. E., Tian, H., Graf, G. A., Yu, L., Grishin, N. V., Schultz, J., Kwiterovich, P., Shan, B., Barnes, R. & Hobbs, H. H. (2000) Science 290, 1771-1775. [DOI] [PubMed] [Google Scholar]
- 14.Repa, J. J., Turley, S. D., Lobaccaro, J. A., Medina, J., Li, L., Lustig, K., Shan, B., Heyman, R. A., Dietschy, J. M. & Mangelsdorf, D. J. (2000) Science 289, 1524-1529. [DOI] [PubMed] [Google Scholar]
- 15.Burnett, D. A., Caplen, M. A., Browne, M. E., Zhau, H., Altmann, S. W., Davis, H. R. & Clader, J. W. (2002) Bioorg. Med. Chem. Lett. 12, 315-318. [DOI] [PubMed] [Google Scholar]
- 16.Altmann, S. W., Davis, H. R., Jr., Yao, X., Laverty, M., Compton, D. S., Zhu, L. J., Crona, J. H., Caplen, M. A., Hoos, L. M., Tetzloff, G., et al. (2002) Biochem. Biophs. Acta 1580, 77-93. [DOI] [PubMed] [Google Scholar]
- 17.Ioannou, Y.A. (2001) Nat. Rev. Mol. Cell Biol. 2, 657-668. [DOI] [PubMed] [Google Scholar]
- 18.Davies, J. P., Levy, B. & Ioannou, Y. A. (2000) Genomics 65, 137-145. [DOI] [PubMed] [Google Scholar]
- 19.Altmann, S. W., Davis, H. R., Jr., Zhu, L. J., Yao, X., Hoos, L. M., Tetzloff, G., Iyer, S. P., Maguire, M., Golovko, A., Zeng, M., et al. (2004) Science 303, 1201-1204. [DOI] [PubMed] [Google Scholar]
- 20.Hauser, H., Howell, K., Dawson, R. M. & Bowyer, D. E. (1980) Biochim. Biophys. Acta 602, 567-577. [DOI] [PubMed] [Google Scholar]
- 21.Kramer, W., Girbig, F., Gutjahr, U., Kowalewski, S., Jouvenal, K., Muller, G., Tripier, D. & Wess, G. (1993) J. Biol. Chem. 268, 18035-18046. [PubMed] [Google Scholar]
- 22.Rigtrup, K. M. & Ong, D. E. (1992) Biochemistry 31, 2920-2926. [DOI] [PubMed] [Google Scholar]
- 23.Bradford, M. M. (1976) Anal. Biochem. 72, 248-254. [DOI] [PubMed] [Google Scholar]
- 24.Weiland, G. A. & Molinoff, P. B. (1981) Life Sci. 27, 29313-29330. [Google Scholar]
- 25.Van Heek, M., France, C. F., Compton, D. S., McLeod, R. L., Yumibe, N. P., Alton, K. B., Sybertz, E. J. & Davis, H. R., Jr., (1997) J. Pharmacol. Exp. Ther. 283, 157-163. [PubMed] [Google Scholar]
- 26.Davis, H. R., Jr., Compton, D. S., Hoos, L. & Tetzloff, G. (2001) Arterioscler. Thromb. Vasc. Biol. 21, 2032-2038. [DOI] [PubMed] [Google Scholar]
- 27.Burnett, D.A. (2004) Curr. Med. Chem. 11, 1873-1887. [DOI] [PubMed] [Google Scholar]
- 28.Jeu, L. & Cheng, J. W. (2003) Clin. Ther. 25, 2352-2387. [DOI] [PubMed] [Google Scholar]
- 29.Smart, E. J., De Rose, R. A. & Farber, S. A. (2004) Proc. Natl. Acad. Sci. USA 101, 3450-3455. [DOI] [PMC free article] [PubMed] [Google Scholar] [Retracted]
- 30.Kramer, W., Girbig, F., Corsiero, D., Pfenninger, A., Frick, W., Jahne, G., Rhein, M., Wendler, W., Lottspeich, F., Hochleitner, E. O., et al. (2005) J. Biol. Chem. 280, 1306-1320. [DOI] [PubMed] [Google Scholar]
- 31.Brown, M. S. & Goldstein, J. L. (1999) Proc. Natl. Acad. Sci. USA 96, 11041-11048. [DOI] [PMC free article] [PubMed] [Google Scholar]
- 32.Radhakrishnan, A., Sun, L., Kwon, H. J., Brown, M. S. & Goldstein, J. L. (2004) Mol. Cell 15, 259-268. [DOI] [PubMed] [Google Scholar]