

Significance
Histone modifications exert critical modulation on chromatin functions, leading to a wide spectrum of effects on biological processes such as tissue differentiation and carcinogenesis. We demonstrate that histone modifications are associated with changes in the fragmentation patterns of cell-free DNA (cfDNA) in plasma. This relationship provides a basis for deducing histone modifications associated with physiological or pathological processes through the noninvasive analysis of cfDNA. Physiologically, such an approach allows the noninvasive assessment of histone modifications in the placenta through analyzing the plasma obtained from pregnant women. Pathologically, this approach enables the noninvasive detection of cancer and hematological disorders. This work has thus enhanced our understanding of the biology of cfDNA fragmentomics and expanded the diagnostic repertoire of liquid biopsy.
Keywords: fragmentomics, epigenetics, liquid biopsy, histone modifications
Abstract
The analysis of tissues of origin of cell-free DNA (cfDNA) is of research and diagnostic interest. Many studies focused on bisulfite treatment or immunoprecipitation protocols to assess the tissues of origin of cfDNA. DNA loss often occurs during such processes. Fragmentomics of cfDNA molecules has uncovered a wealth of information related to tissues of origin of cfDNA. There is still much room for the development of tools for assessing contributions from various tissues into plasma using fragmentomic features. Hence, we developed an approach to analyze the relative contributions of DNA from different tissues into plasma, by identifying characteristic fragmentation patterns associated with selected histone modifications. We named this technique as FRAGmentomics-based Histone modification Analysis (FRAGHA). Deduced placenta-specific histone H3 lysine 27 acetylation (H3K27ac)-associated signal correlated well with the fetal DNA fraction in maternal plasma (Pearson’s r = 0.96). The deduced liver-specific H3K27ac-associated signal correlated with the donor-derived DNA fraction in liver transplantation recipients (Pearson’s r = 0.92) and was significantly increased in patients with hepatocellular carcinoma (HCC) (P < 0.01, Wilcoxon rank-sum test). Significant elevations of erythroblasts-specific and colon-specific H3K27ac-associated signals were observed in patients with β-thalassemia major and colorectal cancer, respectively. Furthermore, using the fragmentation patterns from tissue-specific H3K27ac regions, a machine learning algorithm was developed to enhance HCC detection, with an area under the curve (AUC) of up to 0.97. Finally, genomic regions with H3K27ac or histone H3 lysine 4 trimethylation (H3K4me3) were found to exhibit different fragmentomic patterns of cfDNA. This study has shed light on the relationship between cfDNA fragmentomics and histone modifications, thus expanding the armamentarium of liquid biopsy.
Cell-free DNA (cfDNA) in plasma is nonrandomly fragmented, originating from various tissues through cell death (1–3). The fragmentation patterns of cfDNA, such as fragment sizes (4, 5), end motifs (6–8), preferred ends (9, 10), jagged ends (11, 12), have been shown to be closely related to the tissues of origin of cfDNA and bear relationships with nucleosome structures (1). For instance, cfDNA molecules in the plasma of pregnant women exhibited a major peak at 166 bp in size profile, with a series of 10-bp periodic oscillations in small size ranges, which was reminiscent of double-stranded DNA coiled around the histone octamer (4). Similar observations had also been made for cfDNA molecules in healthy control individuals (5), patients with organ transplantation (13), cancer (5, 14), and autoimmune diseases (15). These findings have provided hints that cfDNA molecules might be bound to the histone proteins, forming cell-free nucleosomes (cf-nucleosomes) that float in the bloodstream.
Recently, Sadeh et al. demonstrated the presence of histone modifications of cf-nucleosomes (e.g., histone H3 lysine 4 trimethylation, H3K4me3) using chromatin immunoprecipitation sequencing in plasma (cfChIP-seq) (16). It was reported that the analysis of histone modifications of cf-nucleosomes could aid in the detection of patients with metastatic colorectal cancer (CRC) and lung cancer (16, 17). Another study reported that the use of immunoprecipitation-based approaches targeting histone modifications (e.g., histone H3 lysine 27 acetylation, H3K27ac) and DNA methylation allowed for inferring the expression levels of diagnostic markers and drug targets (18). However, the involvement of immunoprecipitation has increased the experimental complexity and the analytical turnaround time. Furthermore, the percentage of duplicated sequence reads appears to be increased in the ChIP-seq libraries of cfDNA (16), suggesting that there might be DNA loss during the immunoprecipitation process.
CfDNA fragmentation patterns have been demonstrated to be associated with DNA methylation (7) and transcriptional activity (19, 20). DNA methylation and transcriptional activity have close associations with various histone modifications (21, 22). We thus hypothesize that cfDNA fragmentation patterns may provide a proxy to assess the changes in histone modifications of cf-nucleosomes. Such a proxy has the advantage that it does not need the performance of the more technically demanding immunoprecipitation step.
To this end, we explored the feasibility of employing the fragmentation patterns of cfDNA molecules for deducing the histone modification-associated signals. In this study, we analyzed H3K27ac modification, which is a well-known hallmark of active enhancers and promoters (23, 24). We first characterized fragment sizes and end motifs in regions with differential H3K27ac histone modifications, defining the H3K27ac-associated fragmentomic features (Fig. 1). Those fragmentomic features were then used for deducing the H3K27ac-associated histone modification signals present in plasma. We further analyzed the H3K27ac-associated histone modification signals across different tissue-specific regions, revealing the tissues of origin of such signals (Fig. 1). A machine learning model was used to integrate the fragmentomic features related to the tissue-specific H3K27ac histone modifications for an improved detection of patients with cancer. We further investigated the feasibility of extending the analysis into another type of histone modification (i.e., H3K4me3). We refer to this FRAGmentomics-based Histone modification Analysis as FRAGHA in this study.
Fig. 1.
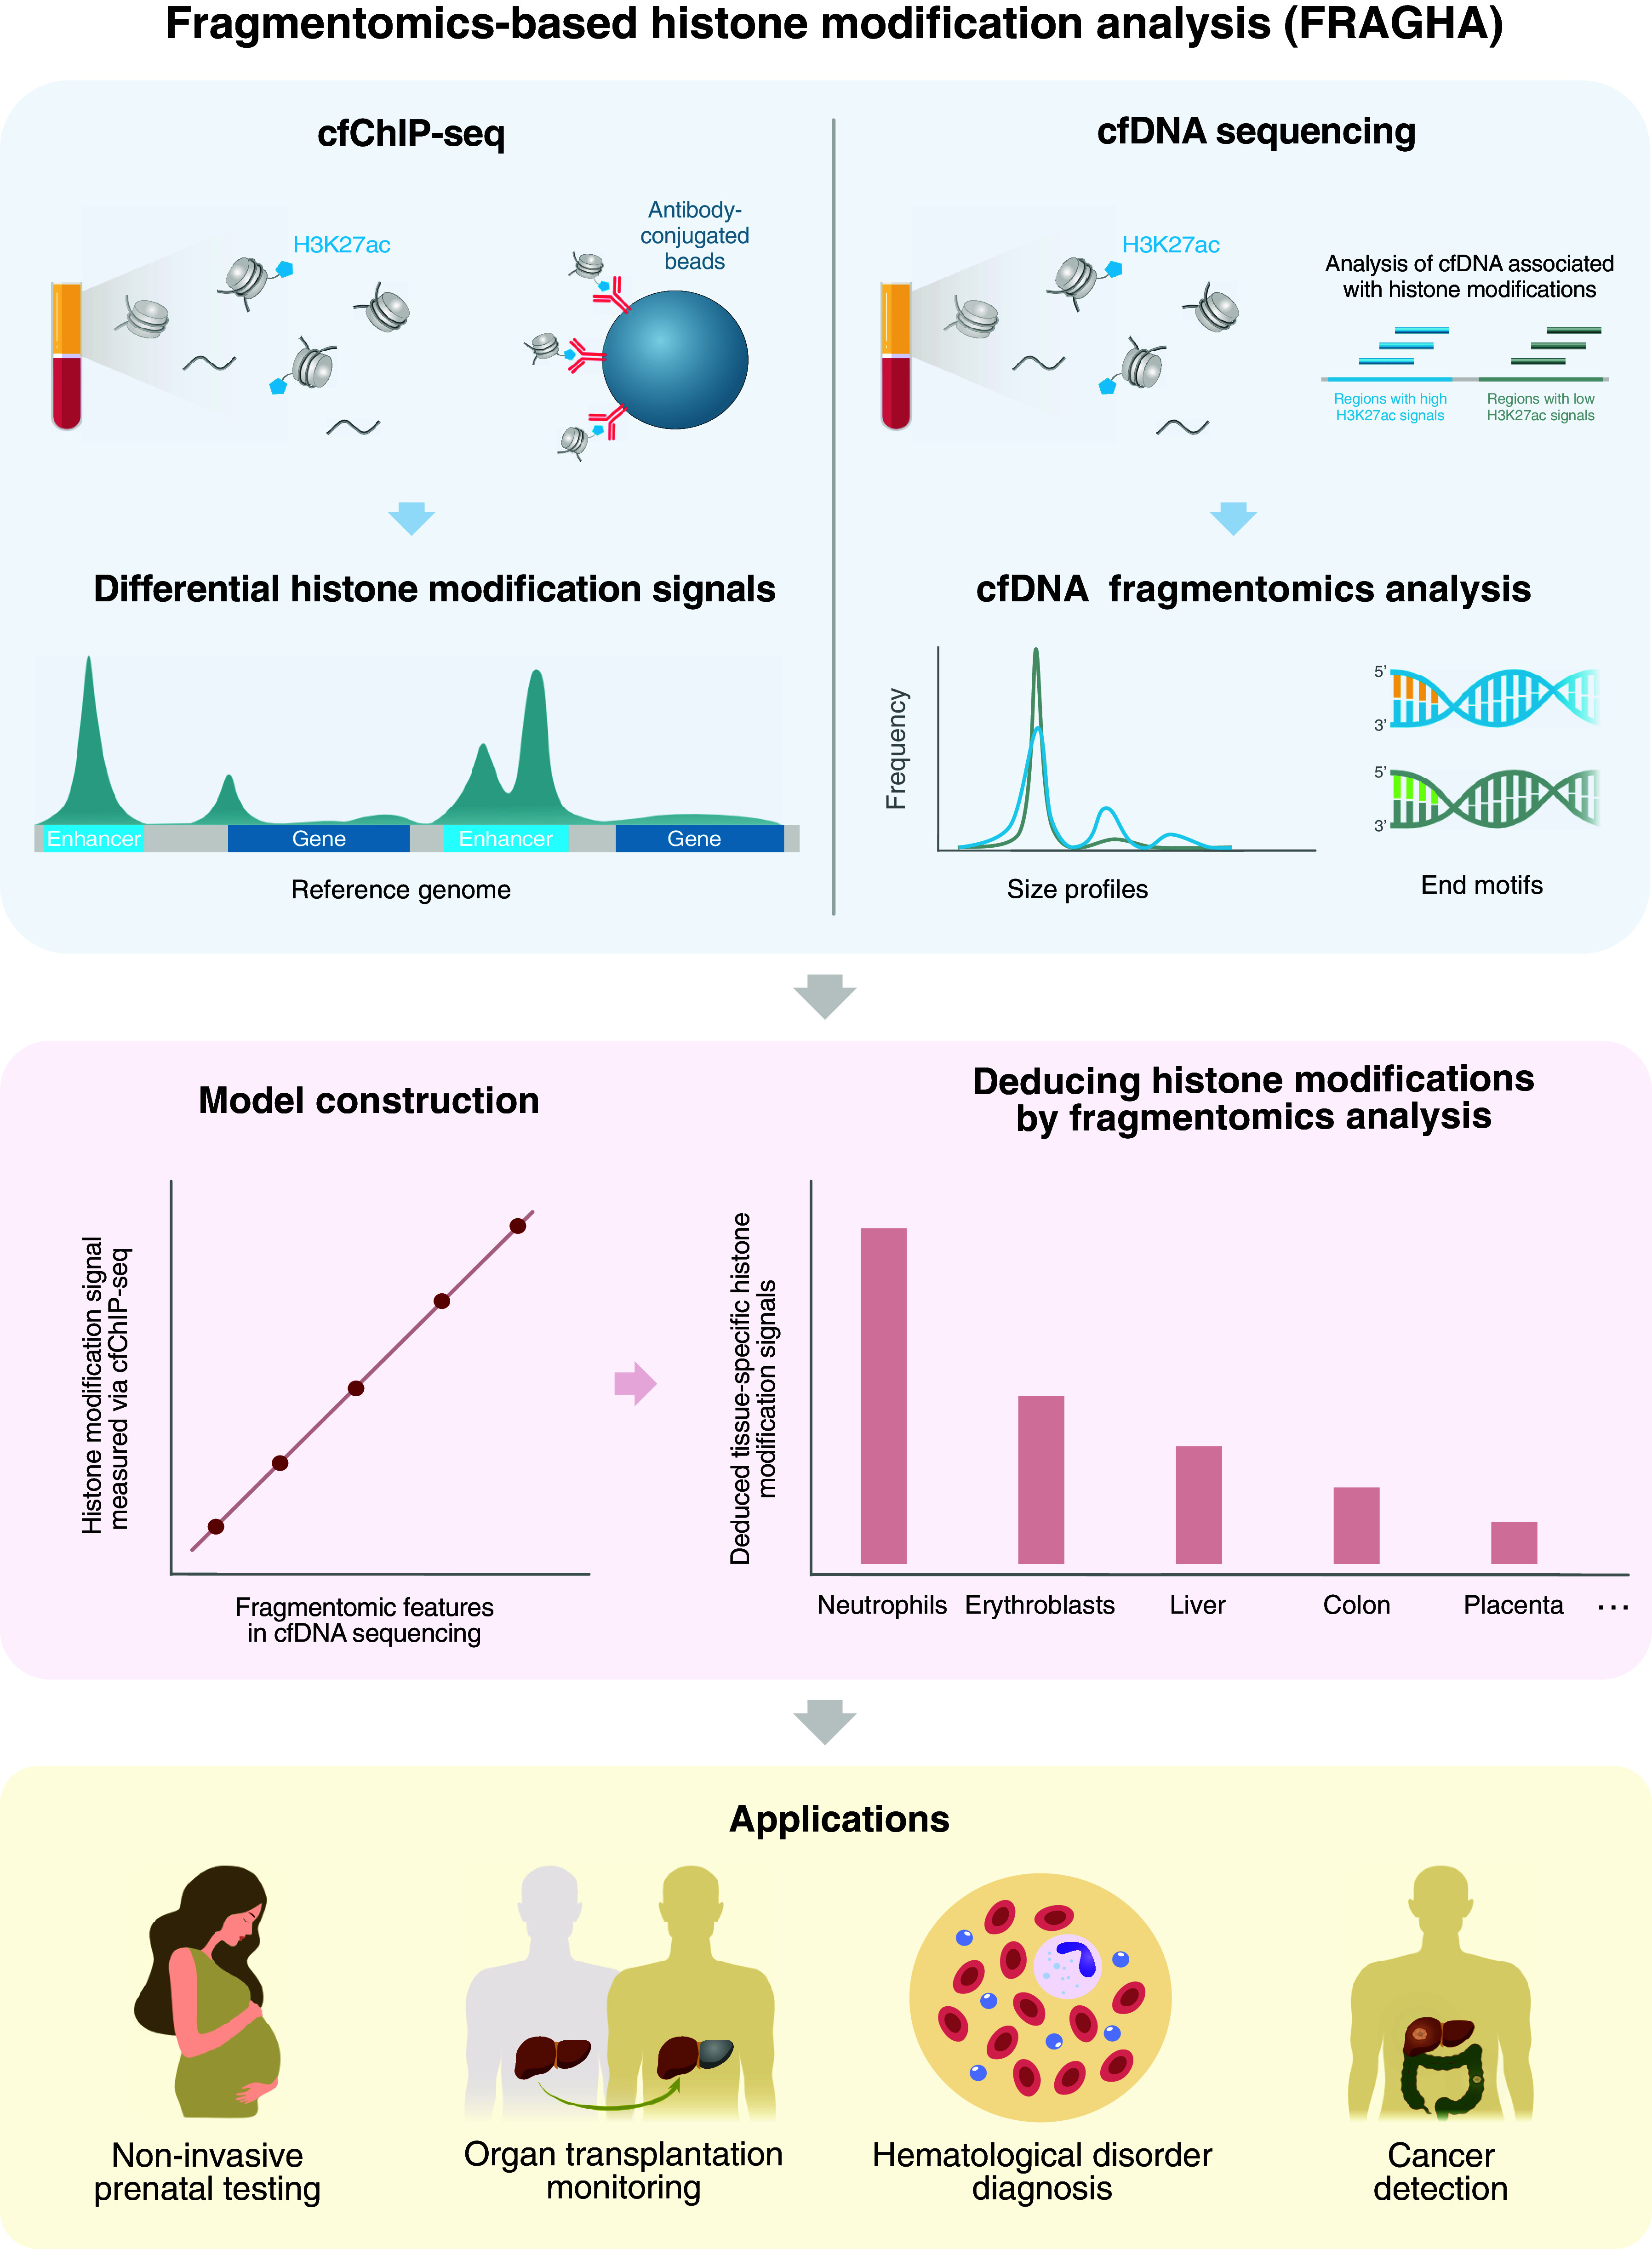
Schematic illustration for FRAGHA. The Top-Left panel illustrates the principle of chromatin immunoprecipitation of cf-nucleosomes carrying chromatin modifications followed by sequencing (cfChIP-seq). Double-stranded cfDNA molecules are wrapped around histone proteins to form circulating cf-nucleosomes. One common histone modification is the acetylation of lysine 27 on the histone H3 protein subunit (H3K27ac) as indicated by the blue pentagons. The cf-nucleosomes carrying H3K27ac can be captured by the corresponding antibodies covalently immobilized to paramagnetic beads. CfDNA isolated from those beads are subjected to massively parallel sequencing. After aligning the sequenced reads to the human reference genome, the read density of a given genomic region can be determined (e.g., peaks in the enhancers). The read density can be used to reflect the amount of a particular histone modification present in the sample. The Top-Right panel illustrates cfDNA sequencing without chromatin immunoprecipitation. We analyze cfDNA molecules originating from regions with differential H3K27ac signals, deciphering the fragmentomic features, including size profiles and end motifs, associated with histone modifications. Afterward, to construct the linear regression model, the fragmentomic features in the cfDNA sequencing results without immunoprecipitation are compared with the reference results generated by chromatin immunoprecipitation. Such a regression model is used to deduce histone modification signals in a test plasma sample. The deduced histone modification signals can inform the tissues of origin of cfDNA. This method could enable noninvasive prenatal testing, organ transplantation monitoring, hematological disease diagnosis, and cancer detection.
Results
Relationship between H3K27ac Levels and Fragment Sizes of cfDNA.
To investigate the relationship between the H3K27ac histone modification levels and cfDNA fragment sizes, we categorized the genomic regions related to H3K27ac signals according to chromatin immunoprecipitation of cf-nucleosomes and studied the fragment size patterns of cfDNA across those categorized regions for samples without immunoprecipitation. We obtained 549 categories exhibiting differential H3K27ac signal levels by using the H3K27ac signals measured via cfChIP-seq (16) from 18 healthy control samples (see details in SI Appendix, Methods and Materials). The pooled size profiles across those different categories were analyzed in the paired cfDNA sequencing data without immunoprecipitation.
As shown in Fig. 2A, with an increase of H3K27ac signal level, the frequencies of molecules within a size range of 50 to 150 bp were found to gradually increase. Similar changing patterns were also observed in size ranges of both 230 to 350 bp and 420 to 500 bp (Fig. 2A). However, the frequencies of molecules within 160 to 225 bp and 360 to 400 bp exhibited an opposite pattern (Fig. 2A). Moreover, the cumulative frequencies of molecules within those five size ranges were highly correlated with log-transformed H3K27ac signals (Pearson’s r = 0.99 for 50 to 150 bp and 230 to 350 bp; Pearson’s r: 0.97 for 420 to 500 bp; Pearson’s r: −0.99 for 160 to 225 bp and −0.98 for 360 to 400 bp; P < 0.0001) (Fig. 2 B–F). Moreover, the generally consistent patterns between fragment sizes and H3K27ac signals could also be observed in the cfDNA sequencing data without immunoprecipitation of 38 healthy subjects from a previous study (6) (SI Appendix, Fig. S1). These results highlighted that fragment size profiles might be suggestive of the H3K27ac signals. The correlation between fragment sizes and the H3K27ac signals before the logarithmic transformation is summarized in SI Appendix, Fig. S2. Of note, there were a few outliers with H3K27ac signals close to zero in each graph of Fig. 2 B–F. There might be two possible reasons that those regions exhibited zero signals in our plasma cfChIP-seq data of H3K27ac: i) The region was predicted as transcription start site (TSS)/enhancer in the cell/tissue types that are not the major contributors to plasma DNA pool; ii) a number of regions predicted to as TSSs/enhancers by ChromHMM software (25) might be solely due to other histone modifications such as histone H3 lysine 4 methylation (H3K4me1) but without the presence of H3K27ac marks.
Fig. 2.
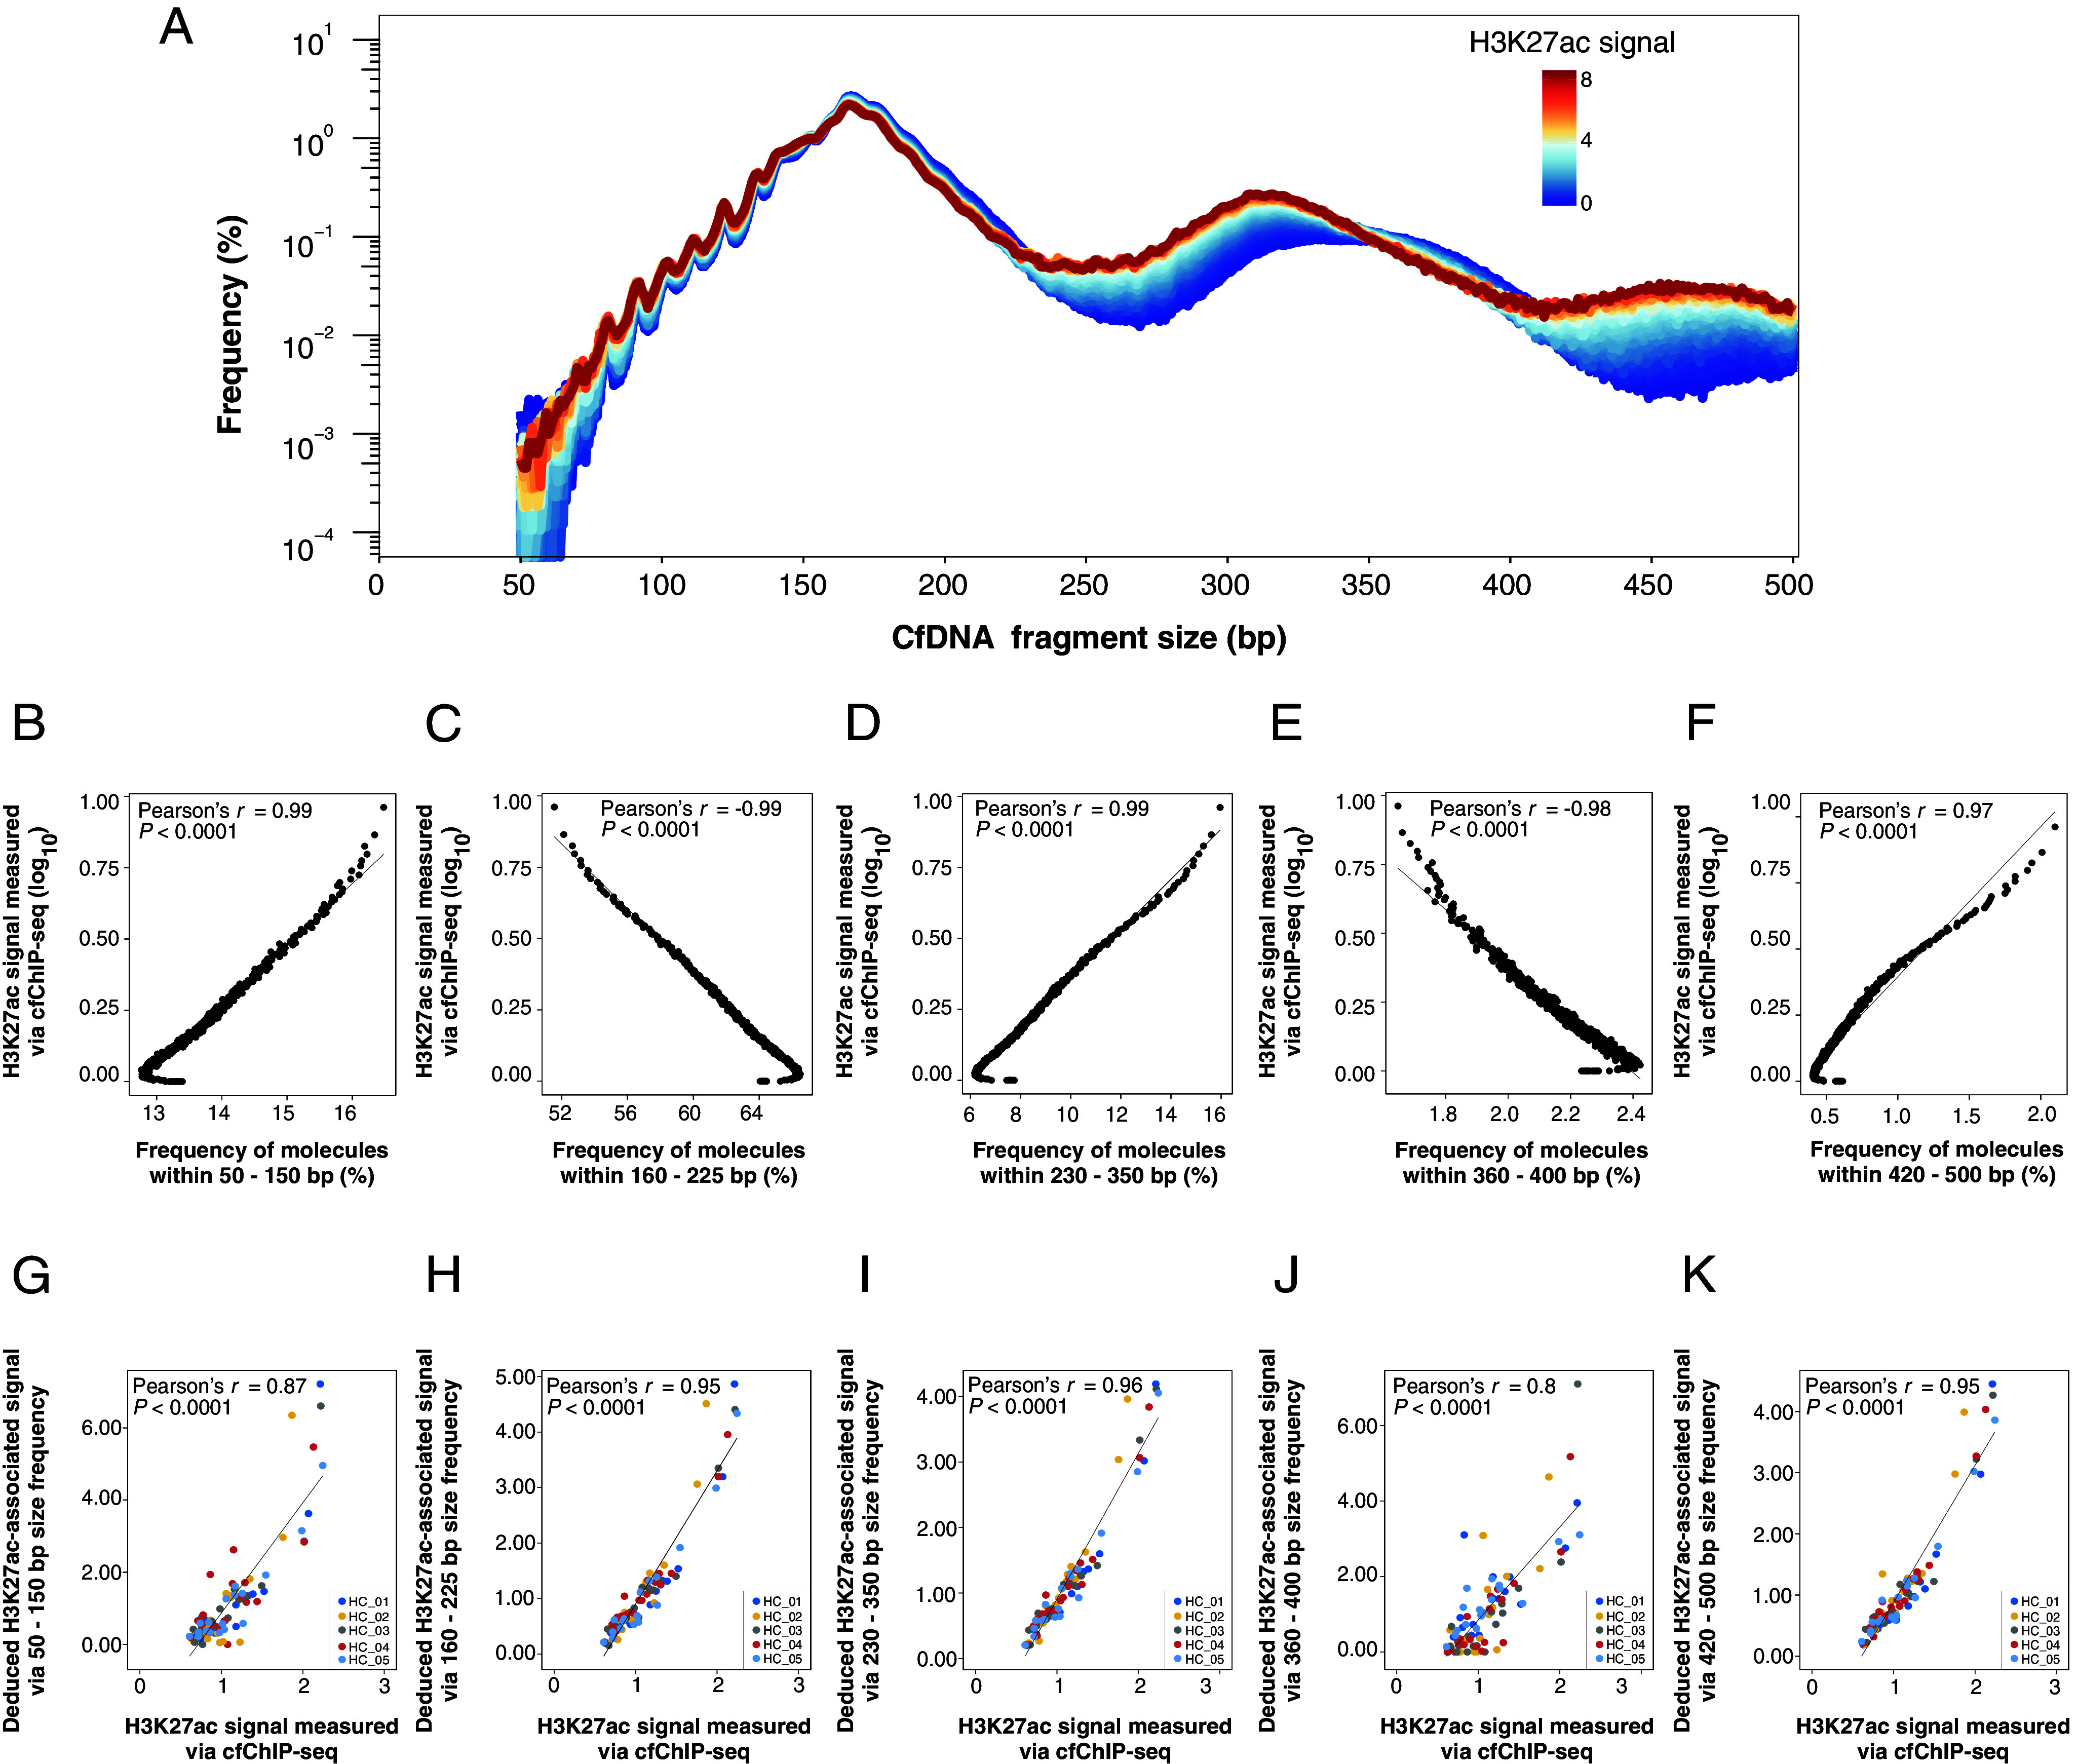
Correlation between cfDNA fragment size patterns and H3K27ac signals of circulating nucleosomes measured by cfChIP-seq using paired samples. (A) The plot of fragment size profiles of cfDNA molecules originating from region categories (n = 549) with differential H3K27ac signal levels. Size curves are highlighted by different colors depending on H3K27ac signal levels. The dark blue and red indicate the lowest and highest H3K27ac levels, respectively. CfDNA molecules were from the pooled sequenced cfDNA molecules of 18 healthy subjects. (B–F) Correlation between the percentages of cfDNA molecules within a particular size range across those 549 region categories with differential H3K27ac signal levels and the log-transformed H3K27ac signals determined by cfChIP-seq of H3K27ac. The size ranges included 50 to 150 bp (B), 160 to 225 bp (C), 230 to 350 bp (D), 360 to 400 bp (E), and 420 to 500 bp (F). (G–K) Correlation of the H3K27ac signals in 18 types of tissue-specific regions deduced by the fragment sizes and cfChIP-seq for another five healthy control subjects.
Deduction of H3K27ac Levels Using Fragment Sizes.
We then constructed a linear regression model for deducing the H3K27ac levels in plasma (referred to as H3K27ac-associated signals) based on fragment size patterns in plasma DNA. We examined the correlation between the H3K27ac-associated signals by fragment sizes and the H3K27ac signals by cfChIP-seq using another five plasma samples obtained from healthy controls, employing both conventional massively parallel sequencing without immunoprecipitation and paired H3K27ac cfChIP-seq. The deduced H3K27ac-associated signals showed a good agreement with the H3K27ac signals determined by cfChIP-seq, when using plasma DNA frequencies within size ranges of 160 to 225 bp, 230 to 350 bp, and 420 to 500 bp (Pearson’s r > 0.90; P < 0.0001) (Fig. 2 H, I, and K). Moderate correlations were observed in 50 to 150 bp (Pearson’s r = 0.87; P < 0.0001) (Fig. 2G) and 360 to 400 bp (Pearson’s r = 0.8; P < 0.0001) (Fig. 2J). Of note, using the frequency of plasma DNA molecules within 230 to 350 bp could provide the most accurate prediction of the actual H3K27ac signals (Pearson’s r = 0.96; P < 0.0001) (Fig. 2I). Hence, the H3K27ac-associated signals deduced by the fragment frequencies within 230 to 350 bp could serve as a proxy to reflect the amounts of H3K27ac modifications present in plasma DNA.
Tissue-of-Origin Analysis of the Deduced H3K27ac-Associated Signal.
We postulated that the deduced H3K27ac-associated signals in tissue-specific regions might inform tissue contributions into the plasma DNA pool. To this end, we employed pregnancy as a model to explore the feasibility of using the deduced H3K27ac-associated signal in placenta-specific regions to reflect the fetal contribution into plasma. Placenta-specific regions were identified by analyzing H3K27ac signals measured by ChIP-seq across a variety of tissues and cell types, including neutrophils, megakaryocytes, erythroblasts, monocytes, B cells, T cells, natural killer cells, the liver, brain, pancreas, placenta, heart, colon, lung, adipose, kidney, spleen, and bladder tissues (see details in SI Appendix, Methods and Materials). We analyzed plasma DNA samples from 30 pregnant women from a previous study (26). Interestingly, genomic regions with placenta-specific H3K27ac modifications showed a strong positive correlation with the fetal DNA fractions determined by single-nucleotide polymorphism (SNP)-based approach (Pearson’s r = 0.96; P < 0.0001; Fig. 3A). In contrast, no positive correlation was observed for the 17 other types of tissue-specific signals associated with H3K27ac nor was such a correlation for signals deduced from randomly selected genomic regions (SI Appendix, Table S1). We further analyzed the liver-specific H3K27ac-associated signals in plasma DNA samples from 14 liver transplant recipients studied previously (27). The deduced liver-specific H3K27ac-associated signals were positively correlated with the donor-derived DNA fractions (i.e., liver DNA fraction) by the SNP-based approach (Pearson’s r = 0.92; P < 0.0001; Fig. 3B). However, such a positive correlation could not be found when using the other types of tissue-specific regions or randomly selected genomic regions (SI Appendix, Table S2). These data supported the feasibility of performing the tissue-of-origin analysis using the deduced H3K27ac-associated signals by cfDNA fragmentation patterns.
Fig. 3.

The deduced tissue-specific H3K27ac-associated signals are reflective of the tissue DNA contributions in plasma in pregnancy and liver transplantation models. (A) Correlation of placenta-specific H3K27ac-associated signals and fetal DNA fractions for 30 pregnant women. (B) Correlation of liver-specific H3K27ac-associated signals and donor-derived DNA fractions for 14 liver transplant recipients.
In addition, we analyzed the multiple tissue-specific H3K27ac-associated signals in plasma for healthy subjects (n = 38) from a previous study (6). As shown in Fig. 4, the tissue-specific regions of blood-related cell types (e.g., neutrophils, monocytes, and megakaryocytes) displayed higher H3K27ac-associated signals deduced by fragment sizes, compared with the other tissues, such as the liver, colon, placenta, brain, kidney, and adipose tissues. The results were consistent with the previous conclusion that the hematopoietic system was the main contributor to plasma DNA (16, 28, 29). Moreover, the results were consistent with the actual H3K27ac signals determined by cfChIP-seq (SI Appendix, Fig. S3A). In contrast, the deduced H3K27ac-associated signals from randomly selected genomic regions lacked such tissue specificity in plasma (SI Appendix, Fig. S3B). These data further validated the conclusion that the deduced H3K27ac-associated signals could inform the tissues of origin of cfDNA molecules.
Fig. 4.

Distribution of the deduced H3K27ac-associated signals using the fragment sizes from tissue-specific histone modification regions. The sequenced cfDNA molecules were obtained from 38 healthy controls. The H3K27ac-associated signals were deduced using the size frequency of molecules within a range of 230 to 350 bp.
Clinical Applications of the Deduced H3K27ac-Associated Signals in Plasma.
We investigated the potential clinical application using the deduced H3K27ac-associated signals, as cfDNA contributions from an organ affected by a pathological condition are often altered, such as hematological disorders (30) and cancers (28). We sequenced plasma DNA samples from 10 patients with β-thalassemia major and 25 healthy subjects, which were analyzed together with the plasma cfDNA sequencing results from the previous 38 healthy controls [TruSeq Nano DNA Library Prep Kit (Illumina); SI Appendix, Tables S3 and S4] (6). We analyzed cfDNA molecules originating from the erythroblasts-specific regions in terms of the H3K27ac modification (see details in SI Appendix, Methods and Materials). The deduced H3K27ac-associated signals related to erythroblasts-specific regions were significantly higher in patients with β-thalassemia major (median: 6.8; range: 1.7 to 48.2), compared with healthy subjects (median: 1.3; range: 0.9 to 1.7) (P < 0.0001, Wilcoxon rank-sum test; Fig. 5A). However, we did not observe a significant difference in megakaryocytes-specific H3K27ac-associated signals between the two groups (P = 0.05, Wilcoxon rank-sum test; SI Appendix, Fig. S4). Although megakaryocytes shared the same hematopoietic progenitor cells with erythroblasts (31, 32), the H3K27ac signals could be used to differentiate these two blood cells lineages. The observation was in line with the fact that patients with β-thalassemia major were known to be elevated in erythroblast proliferation, possibly in an attempt to compensate for the ineffective erythropoiesis (30, 33, 34). Taken together, the deduced H3K27ac-associated signals in erythroblasts-specific regions could be used to reflect the erythropoietic activity in the bone marrow, thereby providing a potential tool for monitoring hematological diseases.
Fig. 5.

Clinical applications of the deduced H3K27ac-associated signals by cfDNA fragmentation patterns. (A) The deduced H3K27ac-associated signals in erythroblasts-specific regions for healthy subjects (n = 63) and patients with β-thalassemia major (n = 10). (B) The deduced H3K27ac-associated signals in liver-specific regions for healthy subjects (n = 63), HBV carriers (n = 17), and HCC patients (n = 34). (C and D) The deduced H3K27ac-associated signals in colon-specific and liver-specific regions for healthy subjects (n = 8), CRC patients with (n = 4) and without liver metastases (n = 7).
Additionally, we determined the liver-specific H3K27ac-associated signals in plasma DNA for the 63 healthy subjects, 17 individuals with chronic hepatitis B virus (HBV) infection but without hepatocellular carcinoma (HCC) (i.e., HBV carriers), and 34 individuals with HCC at various stages (early-stage: n = 20; intermediate-stage: n = 7; advanced-stage HCC, n = 7) (SI Appendix, Tables S3 and S4). We observed significantly higher liver-specific H3K27ac-associated signals in HCC patients (median: 0.8; range: 0.5 to 3.7), compared with both healthy subjects (median: 0.7; range: 0.5 to 1.8, P = 0.0015, Wilcoxon rank-sum test) and HBV carriers (median: 0.6; range: 0.5 to 0.9, P = 0.0012) (Fig. 5B). Furthermore, as shown in Fig. 5C, higher deduced H3K27ac-associated signals related to colon-specific regions were observed in both the patients with localized CRC (median: 0.6; range: 0.3 to 0.8) and CRC patients with liver metastases (median: 1.1; range: 0.6 to 13.3), compared with healthy subjects (median: 0.4; range: 0.1 to 0.5). Importantly, the deduced liver-specific H3K27ac-associated signals were only elevated in CRC patients with liver metastases (median: 1.1; range: 0.7 to 2.5) compared with healthy subjects (median: 0.6; range: 0.5 to 3.9) but not in CRC patients without liver metastases (median: 0.6; range: 0.5 to 0.7) (Fig. 5D). Taken together, these results suggested that the fragmentomics-deduced tissue-specific H3K27ac-associated signals could be used for detecting the presence, as well as the tissues of origin of cancer.
Deduction of H3K27ac-Associated Signals by cfDNA End Motifs.
Fragmentation patterns of cfDNA can be analyzed by fragment end motifs (6, 7). We tested whether the fragment end motifs were able to be used for deducing the H3K27ac levels. Similar to the size-based deduction of H3K27ac-associated signals, we examined the 4-mer fragment end motif frequencies between genomic regions with the highest and lowest H3K27ac signals. We identified a total of seven informative 4-mer end motifs (namely, CCGG, CCGC, TCGG, GCGG, CCGA, TCGC, CCCG) whose frequencies appeared to have at least twofold higher in regions with the highest H3K27ac signals than in regions with the lowest H3K27ac signals (SI Appendix, Table S5). Those informative end motifs might be suggestive of the presence of H3K27ac. The frequency of molecules carrying those informative 4-mer end motifs was well correlated with the log-transformed H3K27ac signals determined by cfChIP-seq in plasma (Pearson’s r = 0.89; P < 0.0001). We hence built a linear regression model to deduce the H3K27ac-associated signals based on those 4-mer end motifs that were overrepresented in genomic regions with the highest H3K27ac signals.
As shown in Fig. 6A, the deduced placenta-specific H3K27ac-associated signals by end motifs showed a significantly positive correlation with the fetal DNA fractions in maternal plasma (Pearson’s r = 0.60; P = 0.0005). In a liver transplantation model, the deduced liver-specific H3K27ac-associated signals were well correlated with the donor-derived DNA fractions determined by the SNP-based approach (Pearson’s r = 0.86; P < 0.0001; Fig. 6B). Therefore, the fragment end motifs of cfDNA molecules could be used for estimating the tissue-specific H3K27ac-associated signals.
Fig. 6.

The analysis of H3K27ac-associated signals by cfDNA end motif profiling. (A) The deduced H3K27ac-associated signals by the frequency of seven informative end motifs in placenta-specific regions for 30 pregnant women. (B) The deduced H3K27ac-associated signals by the frequency of seven informative end motifs in liver-specific regions for 14 liver transplant recipients. (C) Comparison of HCC probability determined by the combined analysis of fragment sizes and end motifs in tissue-specific H3K27ac modification regions for Dataset I. The fragmentomic features include each frequency within 230 to 350 bp size (no. of feature: 121) and the seven informative 4-mer end motifs for those fragments associated with the liver-specific, neutrophils-specific, monocytes-specific, and megakaryocytes-specific H3K27ac regions (no. of region types: 4), resulting to the total number of predictive features of 512 [(121 + 7) × 4 = 512)]. 63 healthy subjects, 17 HBV carriers, and 34 patients with HCC were included. (D) ROC analysis for differentiating patients with and without HCC using different fragmentomic features associated with H3K27ac for Dataset I. (E) Comparison of HCC probability determined by the combined analysis of fragment sizes and end motifs in tissue-specific H3K27ac modification regions for Dataset II. 32 healthy subjects, 103 HBV carriers, and 90 patients with HCC were included. (F) ROC analysis for differentiating patients with and without HCC using different fragmentomic features associated with H3K27ac for Dataset II.
Combined Analysis of Fragment Sizes and End Motifs Related to Tissue-Specific H3K27ac Modifications for Cancer Detection.
As we have demonstrated that both fragment sizes and end motifs could be informative to reflect the tissue-specific histone modifications, we wondered whether we could leverage on cfDNA fragment size and end motif information associated with the tissue-specific H3K27ac modifications to improve cancer detection. To this end, we developed a support vector machine (SVM) model to integrate each frequency within 230 to 350 bp size and seven informative 4-mer end motifs for those fragments associated with tissue-specific H3K27ac-related regions. The tissue-specific H3K27ac-related regions included liver-specific, neutrophils-specific, monocytes-specific, and megakaryocytes-specific regions for classifying patients with and without HCC (total no. of features: 512). We used a leave-one-out strategy for this analysis. On the basis of a combined cohort of 34 HCC, 17 HBV carriers, and 63 healthy subjects with the same library preparation kit [i.e., TruSeq Nano DNA Library Prep Kit (Illumina)] (SI Appendix, Table S3 and S4; denoted as Dataset I), the model predicted a higher probability of having HCC in patients with HCC, compared with patients without HCC (Fig. 6C). A receiver operating characteristic curve (ROC) analysis showed that an area under the curve (AUC) of 0.97 could be achieved for differentiating non-HCC and HCC cases using the predicted probability of having HCC, according to the SVM model (Fig. 6D). A similar performance was observed in another independent dataset using a different library preparation kit [i.e., Kapa Library Preparation Kit (Kapa Biosystems)], comprising 90 HCC, 103 HBV carriers, and 32 healthy subjects (SI Appendix, Table S4; denoted as Dataset II), with an AUC of 0.93 (Fig. 6 E and F). The SVM-based model was performed individually within the dataset using the same experimental protocol instead of pooling two datasets together, as the different library preparation kits used in these two datasets might introduce the preanalytical biases. As a result, we demonstrated that the model that combined both fragment sizes and end motifs was superior to each individual fragmentomic feature used in the detection of patients with HCC for both Dataset I and II (Fig. 6 D and F). The combined analysis also showed significantly better performance, compared with the results based on these computationally randomly selected genomic regions lacking the epigenetic modifications (Dataset I: AUC = 0.92; P = 0.0017, DeLong test; Dataset II: AUC = 0.83; P < 0.0001, DeLong test) (SI Appendix, Fig. S5A). Of note, the combined analysis significantly outperformed a previously established fragmentomics-based cancer detection, named orientation-aware plasma cfDNA fragmentation (OCF) analysis (SI Appendix, Fig. S5B) (35).
Analysis of H3K4me3 Modification by cfDNA Fragmentation Patterns.
As we have demonstrated the feasibility of using the fragmentomic features (i.e., fragment sizes and end motifs) to infer the levels of H3K27ac in plasma, we wondered whether the method present in this study could be applied to other histone modifications. We analyzed H3K4me3 modification with cfChIP-seq. The H3K4me3 mark was mainly deposited at active promoters (16, 36). We first investigated the relationship between the H3K4me3 histone modification levels and cfDNA fragment sizes. The cumulative frequencies of molecules within 230 to 350 bp size range were highly correlated with the log-transformed H3K4me3 signals (Pearson’s r: 0.98, P < 0.0001) (Fig. 7A and SI Appendix, Fig. S6A), which was in agreement with the finding related to the H3K27ac. The deduced tissue-specific H3K4me3-associated signals by the frequencies of molecules within 230 to 350 bp were generally correlated with the target tissue DNA contribution into plasma as demonstrated in pregnant women (Pearson’s r = 0.68; P < 0.0001; SI Appendix, Fig. S6B) and liver transplantation recipients (Pearson’s r = 0.88; P < 0.0001; SI Appendix, Fig. S6C). A significant elevation of the deduced liver-specific H3K4me3-associated signals in plasma for HCC patients was observed, compared with non-HCC subjects (median: 0.2 vs. 0.02; P < 0.0001, Wilcoxon rank-sum test) (Fig. 7B). The deduced colon-specific H3K4me3-associated signals in plasma were elevated in both CRC patients with (median: 0.99) and without liver metastases (median: 0.35), compared with healthy control subjects (median: 0.19) (SI Appendix, Fig. S7A). In contrast, the deduced liver-specific H3K4me3-associated signals in plasma were only elevated in CRC patients with liver metastases (median: 0.07, 0.04, and 0.51 in healthy subjects, CRC without and with liver metastases, respectively; SI Appendix, Fig. S7B). Moreover, a significant elevation of the deduced erythroblasts-specific H3K4me3-associated signals in plasma for β-thalassemia major patients was observed, compared with healthy control subjects (median: 8.5 vs. 1.6; P < 0.0001, Wilcoxon rank-sum test) (SI Appendix, Fig. S7C). These findings provide additional support for the conclusions drawn from the deduced H3K27ac signals. Specifically, the disease conditions might be reflected by tissue-specific histone modifications associated with those affected tissues.
Fig. 7.

The analysis of H3K4me3 modification by cfDNA fragmentation patterns. (A) Correlation between the percentage of cfDNA molecules within 230 to 350 bp and the log-transformed H3K4me3 signal determined by cfChIP-seq of H3K4me3. The sequenced cfDNA molecules were obtained from the pooled sequenced results of 38 healthy subjects in a previously published study. (B) The deduced H3K4me3-associated signals in liver-specific regions for healthy subjects (n = 63), HBV carriers (n = 17), and HCC patients (n = 34). (C) Heatmap of cfDNA fragment size profiles across regions enriching H3K27ac or H3K4me3 or comodifications based on the pooled sequenced cfDNA molecules of 38 healthy subjects. The region enriched for one histone modification of interest is defined by the requirement that the histone modification peak is present in multiple tissue types (i.e., ≥6) being analyzed. To ensure an adequate number of sequence reads for analyzing fragmentation patterns, we randomly grouped histone modification regions into 10 subgroups for each type of histone modification. The fragment size distribution was determined for each subgroup. Each row in the heatmap corresponds to a particular size frequency, while each column represents plasma DNA from each subgroup. For a better visualization, the row-wise normalization (z-score) was applied to the size frequencies. (D) Heatmap of cfDNA fragment end motif patterns across regions enriching H3K27ac or H3K4me3 or comodifications based on the pooled sequenced cfDNA molecules of 38 healthy subjects. Similarly, we randomly grouped histone modification regions into 10 subgroups for end motif analysis. Each row in the heatmap corresponds to a particular end motif, while each column represents plasma DNA from each subgroup. For a better visualization, the row-wise normalization (z-score) was applied to the end motif frequencies. Hierarchical clustering was applied to the end motifs.
Additionally, we found that the distinct fragmentation patterns might be associated with H3K27ac and H3K4me3. We checked the fragment size distributions across regions enriched for H3K27ac, H3K4me3, or the comodification. The H3K27ac-enriched and H3K4me3-enriched regions were defined by comparing the peaks in the genome where the aligned reads are ubiquitously enriched in ChIP-seq results of the previously mentioned tissue types and identified by Model-based Analysis of ChIP-seq 2 (37). The comodification regions for H3K27ac and H3K4me3 were defined where both peaks of H3K27ac and H3K4me3 were present. As shown in Fig. 7C, the size frequencies of 50 to 150 bp were relatively enriched in comodification regions, and the size frequencies of 150 to 200 bp were relatively enriched in H3K27ac-enriched regions. On the other hand, the size frequencies of 300 to 350 bp and 420 to 500 bp were relatively enriched in H3K4me3-enriched regions. Moreover, the end motif patterns also showed distinct patterns between H3K27ac and H3K4me3 modifications (Fig. 7D and SI Appendix, Table S6). For example, the molecules from H3K4me3-enriched regions appeared to enrich for CGTA, GTAC, and TACC end motifs compared with those molecules from H3K27ac-enriched regions. On the other hand, the molecules from H3K27ac-enriched regions exhibited an overrepresentation of GAGA, CACA, and TGGA motifs (Fig. 7D and SI Appendix, Table S6). In addition, the H3K27ac and H3K4me3 shared regions displayed enrichment in CTCC, GGGA, and GTCC end motifs (Fig. 7D and SI Appendix, Table S6). These results demonstrated the possibility of differentiating different histone modifications based on fragmentomic analysis.
Discussion
In this proof-of-concept study, we demonstrated the feasibility of using the fragmentomic features of cfDNA in plasma (i.e., fragment sizes and end motifs) to infer the levels of histone modifications in plasma. The use of fragmentomic features originating from the tissue-specific H3K27ac regions enabled the deduction of tissue-specific H3K27ac-associated signals, which could be used for reflecting the relative tissue contributions into plasma. We further illustrated that the tissue-specific H3K27ac-associated signals in plasma could serve as a biomarker for hematological disorders and cancers. The use of a machine learning model (e.g., SVM) based on fragmentomic features related to tissue-specific H3K27ac-related regions could enhance cancer detection.
There are several important differences in analytical principles between the present and previous methods for analyzing cfDNA fragmentation patterns. Sun et al. illustrated the ability of tracing the tissues of origin of cfDNA, based on the orientation information of the cfDNA fragment ends configured around tissue-specific open chromatin regions which were defined according to results generated by DNase I hypersensitive sites sequencing (i.e., DNASE-seq) (35). In that study, the differential values between the abundance of upstream (U) ends and downstream (D) ends flanking the open chromatin regions were taken into account for analysis, termed orientation-aware cfDNA fragmentation (OCF) values (35). However, OCF values demonstrated considerable overlaps between patients with and without HCC. The performance of differentiating patients with and without HCC using OCF analysis was inferior to FRAGHA present in this study. Ulz et al. demonstrated that the use of sequencing coverage across cancer lineage-specific transcription factor binding sites that were defined by Assay for Transposase-Accessible Chromatin using sequencing (i.e., ATAC-seq) enabled the detection of patients with colon cancer, with 71% sensitivity and 72% specificity (38). These studies thus suggested that more investigations in fragmentation-based methods are still required to boost the performance of liquid biopsy. In the present study, we focused on the metrics of fragment sizes and end motifs to capture the fragmentation patterns occurring in tissue-specific histone modification regions, establishing the model to infer H3K27ac-associated signals. We assessed the multiple tissue types contributing to the plasma DNA pool based on the deduced H3K27ac-associated signals, including blood-related cells and solid tissues such as the placenta, liver, and colon tissues. The blood-related cells were found to be the major contributor to the plasma DNA pool, which was consistent with the conclusion resulting from the methylation-based plasma DNA deconvolution (28, 29, 39) and sex-mismatched bone marrow transplantation (40). Moreover, the placenta-specific and liver-specific H3K27ac-associated signals could be used for accurately deducing the fetal DNA fractions in pregnant women and liver DNA fractions in liver transplant recipients, respectively. These results suggested that the quantitative analysis of tissue contributions in plasma could be assisted by using the H3K27ac-associated signals deduced from fragmentomic features. More importantly, the erythroblasts-specific H3K27ac-associated signals showed the potential to detect patients with β-thalassemia major, whereas the liver-specific and colon-specific H3K27ac-associated signals could be used for the detection of HCC and CRC, respectively. Hence, the analysis of histone modifications-associated signals by cfDNA fragmentation patterns in plasma might open up different possibilities for developing molecular diagnostics tools.
The use of a machine learning algorithm to integrate the sizes and end motifs associated with tissue-specific H3K27ac-associated signals could enhance the detection of HCC, with an AUC of 0.97 and 0.93 in two independent datasets. The genome-wide sequencing depth used in this study was relatively low, with a median of 1.9×. We envisioned that the prospective development of targeted sequencing would be valuable for analyzing those cfDNA molecules specifically originating from the tissue-specific H3K27ac regions. For instance, one could develop a hybridization-based target sequencing assay to enrich cfDNA molecules of interest, potentially further enhancing the depth of sequencing for informative regions, thus potentially improving the classification accuracy. We also demonstrated that the fragmentation patterns could potentially be used for reflecting multiple types of histone modifications, including H3K27ac and H3K4me3. However, the interplay of different histone modifications in a regulatory region may add another layer of complexity to cfDNA fragmentomics. For example, several histone modifications such as H3K4me2, H3K36ac, H3K27ac, etc. could concurrently occur in some enhancers (41). Thus, we could not rule out that the deduced signals of histone modification in this study might be at least in part influenced by one or more types of histone modifications. In future studies, it will be interesting to elucidate the detailed interplay of various histone modifications that might interfere cfDNA fragmentations as well as its synergy for the detection of diseases, with the availability of reference atlas concerning the high-resolution histone modifications from various cell types.
Of note, we observed that the genomic regions with higher H3K27ac levels were accompanied with more short DNA molecules within 50 to 150 bp. A plausible biological basis is that the chromatin regions marked by H3K27ac might exhibit increased chromatin accessibility (42, 43), thus being subjected to increased nuclease activity on those regions. For those molecules from the regions with higher H3K27ac levels, the slight shifting in the left hand of dinucleosomal size peaks could potentially be attributed to the shortening of nucleosome spacing in regions with higher transcriptional activity levels (44, 45). It was also worth noting that several clinical scenarios examined in this study utilized different library preparation kits, potentially introducing preanalytical biases if performing cross-cohort comparisons. To mitigate this issue, fragmentomic analysis was conducted by comparing samples with controls within the same cohort. Future efforts are needed to understand the impact of preanalytical and analytical parameters, such as DNA library preparation, on histone modification analysis by fragmentomics. Large-scale clinical validations using standardized experimental protocols are warranted to ensure consistency and reliability.
Histone modifications are tightly associated with nucleosome structures. For example, histone acetylation could weaken DNA–nucleosome interactions, theoretically opening up chromatin structure and reducing nucleosome stability (46). Interestingly, Saxton et al. recently developed live-cell imaging for single-molecule tracking and uncovered that nucleosomes diffused ~15% faster in chromatin enriched with H3K27ac, increasing the nucleosome mobility (47). We speculate that such a biophysical change in the nucleosome diffusion might influence the accessibilities of DNA nucleases during the apoptotic process, conferring the unique cfDNA fragmentation patterns. Hence, future biophysical data about the relation between nucleosome stability (and/or mobility) and histone modifications might provide pivotal clues for explaining cfDNA fragmentation patterns.
In summary, we have demonstrated an association between histone modifications and the fragmentation patterns of cfDNA molecules in plasma. This finding has opened up the possibility for deducing histone modifications through fragmentomics analysis of cfDNA, showing potential for noninvasive prenatal testing, organ transplantation monitoring, hematological disease diagnosis, and cancer detection.
Materials and Methods
Subject Recruitment and Plasma Extraction.
This study was approved by The Joint Chinese University of Hong Kong—Hospital Authority New Territories East Cluster Clinical Research Ethics Committee under the Declaration of Helsinki. All the subjects had written informed consent.
cfChIP-seq.
A number of non-pregnant healthy patients were newly recruited and subjected to cfChIP-seq of H3K27ac (n = 23) or H3K4me3 (n = 4) in this study. Plasma was isolated from whole blood through sequential steps of centrifugation (i.e., centrifugation at 1,600 g for 10 min followed by recentrifugation of the plasma portion at 16,000 g for another 10 min). The isolated plasma was stored at −80 °C until use. The cfChIP-seq protocol was adopted from the previous study with minor modifications (16). For chromatin immunoprecipitation, beads coated with antibodies were prepared following the manufacturer’s protocol of Dynabeads™ Antibody Coupling Kit (14311D, Invitrogen™). Epoxy beads were incubated with H3K27ac (ab4729, Abcam) or H3K4me3 (C15410003, Diagenode) antibody at 37 °C overnight. The antibody-conjugated paramagnetic beads were incubated with 2 mL plasma by rotating overnight at 4 °C. The beads were collected on the inside wall of the tube, followed by washing with wash buffer. The immunoprecipitated DNA was thus obtained and further ligated with adapters on beads. The DNA was eluted, followed by the amplification through PCR. The distributions of sequencing depth around TSSs and enhancer regions for H3K27ac and H3K4me3 cfChIP-seq data are depicted in SI Appendix, Fig S8. The DNA libraries were sequenced by the Illumina sequencing platforms (SI Appendix, Table S3).
Conventional Massively Parallel Sequencing without Immunoprecipitation.
A total of 10 patients with beta-thalassemia major and 25 non-pregnant healthy subjects were recruited. Plasma DNA was isolated and subjected to conventional massively parallel sequencing without immunoprecipitation. Plasma was isolated from the blood samples through centrifugation at 1,600× g for 10 min and then 16,000× g for 10 min at 4 °C. DNA was extracted from 2 mL plasma by a QIAamp Circulating Nucleic Acid Kit (Qiagen). Libraries were prepared using TruSeq Nano DNA Library Prep Kit (Illumina) according to the manufacturer’s instructions. DNA libraries were sequenced by the Illumina platforms (SI Appendix, Table S3).
A total of eight healthy subjects, four CRC patients without liver metastases, and seven CRC patients with liver metastases were recruited and subjected to whole genome bisulfite sequencing as described previously (6).
Detailed information regarding the clinical information, library preparation methods, sequencing depths, and sequencing platforms were summarized in SI Appendix, Tables S3 and S4.
Data Analysis.
The data analysis involved multiple steps including sequencing read alignment, signal normalization, determination of tissue-specific histone modification regions, and deduction of histone modifications by cfDNA fragmentation patterns in plasma. The details were elaborated in SI Appendix, Methods and Materials.
Statistical Analysis.
R language was used for statistical analysis. The Wilcoxon rank-sum test was used to compare the differences between groups. A P value < 0.05 was considered statistically significant.
Supplementary Material
Appendix 01 (PDF)
Acknowledgments
This work was supported by the Innovation and Technology Commission (InnoHK initiative) of the Hong Kong SAR Government. Y.M.D.L. is supported by an endowed chair from the Li Ka Shing Foundation.
Author contributions
J.B., P.J., L.J., K.C.A.C., and Y.M.D.L. designed research; J.B., P.J., L.J., W.K.J.L., Q.Z., M.-J.L.M., S.C.D., S.R., C.W.W., T.C.Y., M.Y., R.W.Y.C., R.Q., S.C.Y.Y., L.Y.L.C., Y.S., Z.W., T.H.C.T., M.F.L., R.S.M.W., J.W., S.L.C., G.L.H.W., and V.W.S.W. performed research; J.B., P.J., L.J., K.C.A.C., and Y.M.D.L. analyzed data; and J.B., P.J., L.J., K.C.A.C., and Y.M.D.L. wrote the paper.
Competing interests
J.B., P.J., L.J., M.Y., K.C.A.C., and Y.M.D.L. filed patent applications based on the data in this study. Reviewer S.B. is an inventor on patents related to cfDNA mutation and methylation analysis technologies that have been licensed to Roche and Adela, respectively, and is a co-founder and has ownership in Adela.
Footnotes
Reviewers: S.B., University of Toronto; and I.D.V., Cornell University.
Data, Materials, and Software Availability
Raw sequencing data can be accessed in the European Genome-Phenome Archive (EGA), https://www.ebi.ac.uk/ega/, with the accession number of EGAD00001009267 (https://ega-archive.org/dacs/EGAC00001002815) (48). Previously published data were used for this work (5, 6, 26, 27).
Supporting Information
References
- 1.Lo Y. M. D., Han D. S. C., Jiang P., Chiu R. W. K., Epigenetics, fragmentomics, and topology of cell-free DNA in liquid biopsies. Science 372, eaaw3616 (2021). [DOI] [PubMed] [Google Scholar]
- 2.Rostami A., et al. , Senescence, necrosis, and apoptosis govern circulating cell-free DNA release kinetics. Cell Rep. 31, 107830 (2020). [DOI] [PubMed] [Google Scholar]
- 3.Kustanovich A., Schwartz R., Peretz T., Grinshpun A., Life and death of circulating cell-free DNA. Cancer Biol. Ther. 20, 1057–1067 (2019). [DOI] [PMC free article] [PubMed] [Google Scholar]
- 4.Lo Y. M., et al. , Maternal plasma DNA sequencing reveals the genome-wide genetic and mutational profile of the fetus. Sci. Transl. Med. 2, 61ra91 (2010). [DOI] [PubMed] [Google Scholar]
- 5.Jiang P., et al. , Lengthening and shortening of plasma DNA in hepatocellular carcinoma patients. Proc. Natl. Acad. Sci. U.S.A. 112, E1317–E1325 (2015). [DOI] [PMC free article] [PubMed] [Google Scholar]
- 6.Jiang P., et al. , Plasma DNA end-motif profiling as a fragmentomic marker in cancer, pregnancy, and transplantation. Cancer Discov. 10, 664–673 (2020). [DOI] [PubMed] [Google Scholar]
- 7.Zhou Q., et al. , Epigenetic analysis of cell-free DNA by fragmentomic profiling. Proc. Natl. Acad. Sci. U.S.A. 119, e2209852119 (2022). [DOI] [PMC free article] [PubMed] [Google Scholar]
- 8.Zhou Z., et al. , Fragmentation landscape of cell-free DNA revealed by deconvolutional analysis of end motifs. Proc. Natl. Acad. Sci. U.S.A. 120, e2220982120 (2023). [DOI] [PMC free article] [PubMed] [Google Scholar]
- 9.Sun K., et al. , Size-tagged preferred ends in maternal plasma DNA shed light on the production mechanism and show utility in noninvasive prenatal testing. Proc. Natl. Acad. Sci. U.S.A. 115, E5106–E5114 (2018). [DOI] [PMC free article] [PubMed] [Google Scholar]
- 10.Jiang P., et al. , Preferred end coordinates and somatic variants as signatures of circulating tumor DNA associated with hepatocellular carcinoma. Proc. Natl. Acad. Sci. U.S.A. 115, E10925–E10933 (2018). [DOI] [PMC free article] [PubMed] [Google Scholar]
- 11.Ding S. C., et al. , Jagged ends on multinucleosomal cell-free DNA serve as a biomarker for nuclease activity and systemic lupus erythematosus. Clin. Chem. 68, 917–926 (2022). [DOI] [PubMed] [Google Scholar]
- 12.Jiang P., et al. , Detection and characterization of jagged ends of double-stranded DNA in plasma. Genome Res. 30, 1144–1153 (2020). [DOI] [PMC free article] [PubMed] [Google Scholar]
- 13.Zheng Y. W., et al. , Nonhematopoietically derived DNA is shorter than hematopoietically derived DNA in plasma: A transplantation model. Clin. Chem. 58, 549–558 (2012). [DOI] [PubMed] [Google Scholar]
- 14.Mouliere F., et al. , Enhanced detection of circulating tumor DNA by fragment size analysis. Sci. Transl. Med. 10, eaat4921 (2018). [DOI] [PMC free article] [PubMed] [Google Scholar]
- 15.Chan R. W., et al. , Plasma DNA aberrations in systemic lupus erythematosus revealed by genomic and methylomic sequencing. Proc. Natl. Acad. Sci. U.S.A. 111, E5302–E5311 (2014). [DOI] [PMC free article] [PubMed] [Google Scholar]
- 16.Sadeh R., et al. , ChIP-seq of plasma cell-free nucleosomes identifies gene expression programs of the cells of origin. Nat. Biotechnol. 39, 586–598 (2021). [DOI] [PMC free article] [PubMed] [Google Scholar]
- 17.Trier Maansson C., Meldgaard P., Stougaard M., Nielsen A. L., Sorensen B. S., Cell-free chromatin immunoprecipitation can determine tumor gene expression in lung cancer patients. Mol. Oncol. 17, 722–736 (2023). [DOI] [PMC free article] [PubMed] [Google Scholar]
- 18.Baca S. C., et al. , Liquid biopsy epigenomic profiling for cancer subtyping. Nat. Med. 29, 2737–2741 (2023). [DOI] [PMC free article] [PubMed] [Google Scholar]
- 19.Esfahani M. S., et al. , Inferring gene expression from cell-free DNA fragmentation profiles. Nat. Biotechnol. 40, 585–597 (2022). [DOI] [PMC free article] [PubMed] [Google Scholar]
- 20.Ulz P., et al. , Inferring expressed genes by whole-genome sequencing of plasma DNA. Nat. Genet. 48, 1273–1278 (2016). [DOI] [PubMed] [Google Scholar]
- 21.Dong X., Weng Z., The correlation between histone modifications and gene expression. Epigenomics 5, 113–116 (2013). [DOI] [PMC free article] [PubMed] [Google Scholar]
- 22.Cedar H., Bergman Y., Linking DNA methylation and histone modification: Patterns and paradigms. Nat. Rev. Genet. 10, 295–304 (2009). [DOI] [PubMed] [Google Scholar]
- 23.Wang J., et al. , The regulatory role of histone modification on gene expression in the early stage of myocardial infarction. Front. Cardiovasc. Med. 7, 594325 (2020). [DOI] [PMC free article] [PubMed] [Google Scholar]
- 24.Wang M., Chen Z., Zhang Y., CBP/p300 and HDAC activities regulate H3K27 acetylation dynamics and zygotic genome activation in mouse preimplantation embryos. EMBO J. 41, e112012 (2022). [DOI] [PMC free article] [PubMed] [Google Scholar]
- 25.Ernst J., Kellis M., Chromatin-state discovery and genome annotation with ChromHMM. Nat. Protoc. 12, 2478–2492 (2017). [DOI] [PMC free article] [PubMed] [Google Scholar]
- 26.Jiang P., et al. , Gestational age assessment by methylation and size profiling of maternal plasma DNA: A feasibility study. Clin. Chem. 63, 606–608 (2017). [DOI] [PubMed] [Google Scholar]
- 27.Gai W., et al. , Liver- and colon-specific DNA methylation markers in plasma for investigation of colorectal cancers with or without liver metastases. Clin. Chem. 64, 1239–1249 (2018). [DOI] [PubMed] [Google Scholar]
- 28.Sun K., et al. , Plasma DNA tissue mapping by genome-wide methylation sequencing for noninvasive prenatal, cancer, and transplantation assessments. Proc. Natl. Acad. Sci. U.S.A. 112, E5503–E5512 (2015). [DOI] [PMC free article] [PubMed] [Google Scholar]
- 29.Moss J., et al. , Comprehensive human cell-type methylation atlas reveals origins of circulating cell-free DNA in health and disease. Nat. Commun. 9, 5068 (2018). [DOI] [PMC free article] [PubMed] [Google Scholar]
- 30.Lam W. K. J., et al. , DNA of erythroid origin is present in human plasma and informs the types of anemia. Clin. Chem. 63, 1614–1623 (2017). [DOI] [PubMed] [Google Scholar]
- 31.Velten L., et al. , Human haematopoietic stem cell lineage commitment is a continuous process. Nat. Cell Biol. 19, 271–281 (2017). [DOI] [PMC free article] [PubMed] [Google Scholar]
- 32.Akashi K., Traver D., Miyamoto T., Weissman I. L., A clonogenic common myeloid progenitor that gives rise to all myeloid lineages. Nature 404, 193–197 (2000). [DOI] [PubMed] [Google Scholar]
- 33.Buoro S., et al. , Evaluation of nucleated red blood cell count by Sysmex XE-2100 in patients with thalassaemia or sickle cell anaemia and in neonates. Blood Transfus. 13, 588–594 (2015). [DOI] [PMC free article] [PubMed] [Google Scholar]
- 34.Gupta R., Musallam K. M., Taher A. T., Rivella S., Ineffective erythropoiesis: Anemia and iron overload. Hematol. Oncol. Clin. North Am. 32, 213–221 (2018). [DOI] [PMC free article] [PubMed] [Google Scholar]
- 35.Sun K., et al. , Orientation-aware plasma cell-free DNA fragmentation analysis in open chromatin regions informs tissue of origin. Genome Res. 29, 418–427 (2019). [DOI] [PMC free article] [PubMed] [Google Scholar]
- 36.Park S., Kim G. W., Kwon S. H., Lee J. S., Broad domains of histone H3 lysine 4 trimethylation in transcriptional regulation and disease. FEBS J. 287, 2891–2902 (2020). [DOI] [PubMed] [Google Scholar]
- 37.Zhang Y., et al. , Model-based analysis of ChIP-Seq (MACS). Genome Biol. 9, R137 (2008). [DOI] [PMC free article] [PubMed] [Google Scholar]
- 38.Ulz P., et al. , Inference of transcription factor binding from cell-free DNA enables tumor subtype prediction and early detection. Nat. Commun. 10, 4666 (2019). [DOI] [PMC free article] [PubMed] [Google Scholar]
- 39.Gai W., et al. , Applications of genetic-epigenetic tissue mapping for plasma DNA in prenatal testing, transplantation and oncology. Elife 10, e64356 (2021). [DOI] [PMC free article] [PubMed] [Google Scholar]
- 40.Lui Y. Y., et al. , Predominant hematopoietic origin of cell-free DNA in plasma and serum after sex-mismatched bone marrow transplantation. Clin. Chem. 48, 421–427 (2002). [PubMed] [Google Scholar]
- 41.Ucar D., Hu Q., Tan K., Combinatorial chromatin modification patterns in the human genome revealed by subspace clustering. Nucleic Acids Res. 39, 4063–4075 (2011). [DOI] [PMC free article] [PubMed] [Google Scholar]
- 42.Barral A., Dejardin J., The chromatin signatures of enhancers and their dynamic regulation. Nucleus 14, 2160551 (2023). [DOI] [PMC free article] [PubMed] [Google Scholar]
- 43.Zhao Y., Zheng D., Cvekl A., Profiling of chromatin accessibility and identification of general cis-regulatory mechanisms that control two ocular lens differentiation pathways. Epigenet. Chromatin 12, 27 (2019). [DOI] [PMC free article] [PubMed] [Google Scholar]
- 44.Snyder M. W., Kircher M., Hill A. J., Daza R. M., Shendure J., Cell-free DNA comprises an in vivo nucleosome footprint that informs its tissues-of-origin. Cell 164, 57–68 (2016). [DOI] [PMC free article] [PubMed] [Google Scholar]
- 45.Valouev A., et al. , Determinants of nucleosome organization in primary human cells. Nature 474, 516–520 (2011). [DOI] [PMC free article] [PubMed] [Google Scholar]
- 46.Cheung W. L., Briggs S. D., Allis C. D., Acetylation and chromosomal functions. Curr Opin. Cell Biol. 12, 326–333 (2000). [DOI] [PubMed] [Google Scholar]
- 47.Saxton M. N., Morisaki T., Krapf D., Kimura H., Stasevich T. J., Live-cell imaging uncovers the relationship between histone acetylation, transcription initiation, and nucleosome mobility. Sci. Adv. 9, eadh4819 (2023). [DOI] [PMC free article] [PubMed] [Google Scholar]
- 48.Bai J., et al. , Histone modifications of cfDNA. European Genome-Phenome Archive (EGA). https://ega-archive.org/dacs/EGAC00001002815. Deposited 22 August 2022.
Associated Data
This section collects any data citations, data availability statements, or supplementary materials included in this article.
Supplementary Materials
Appendix 01 (PDF)
Data Availability Statement
Raw sequencing data can be accessed in the European Genome-Phenome Archive (EGA), https://www.ebi.ac.uk/ega/, with the accession number of EGAD00001009267 (https://ega-archive.org/dacs/EGAC00001002815) (48). Previously published data were used for this work (5, 6, 26, 27).