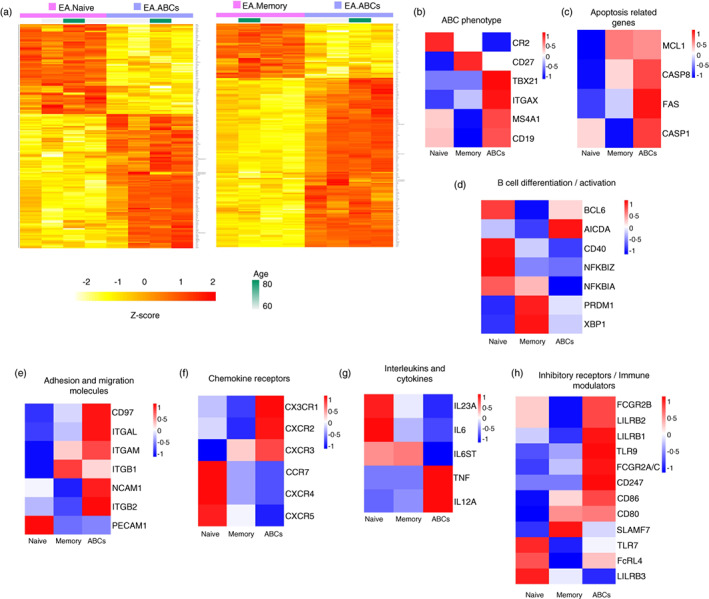
FIGURE 1.

Age‐associated B cells (ABCs) from early rheumatoid arthritis (eRA) patients show a unique and distinct transcriptome profile compared to other B‐cell subsets. (a) Heatmap of the differentially expressed genes between ABCs and the other subsets of B cells: naïve B cells (left) and memory B cells (right). B‐cell subsets from eRA patients (n = 4) were sorted from peripheral blood mononuclear cell (PBMC) by flow cytometry. Cells were lysed, and the cell lysates were used for a NanoString nCounter® Immunology V2 Panel to assess gene expression. Gene expression profiles were compared between different B‐cell subsets using the DESeq2 R package. Normalized and variance stabilized gene expression intensities in log2 scale were used for clustering, and the corresponding Z‐scores were displayed with colours ranging from yellow to red as shown in the key. ABCs are shown in purple, and naïve and memory B cells are shown in pink. Each column represents a different eRA patient. Genes achieved statistical significance when the adjusted p value was <0.05 (FDR corrected), and the absolute fold change was >1.5. (b)–(h) Heatmaps showing the expression pattern of representative genes with relevant functions. For plotting, the Z‐score calculated from the mean log2 expression for each cell population was used. Red indicates higher expression, and blue indicates lower expression
