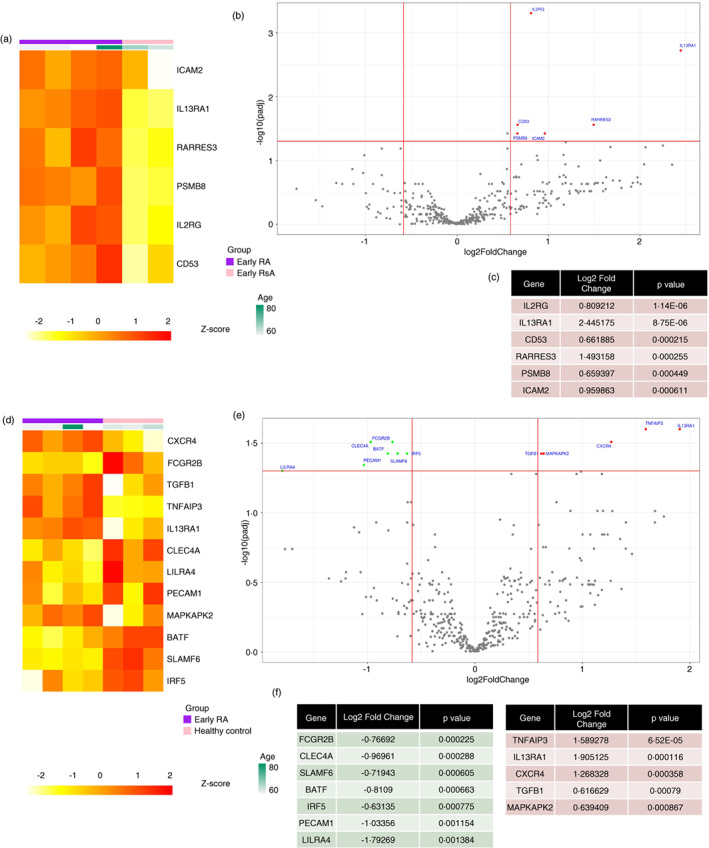
FIGURE 6.

Age‐associated B cells (ABCs) from early rheumatoid arthritis (eRA) patients have a differential gene expression profile compared to control groups. Cell lysates from sorted ABCs from eRA, psoriatic arthritis (ePsA) and healthy controls (HCs) were loaded on to a NanoString nCounter® Immunology V2 Panel chip to assess gene expression. (a) and (d) Heatmap of the differentially expressed genes between ABCs from eRA patients (n = 4) in purple and ABCs from ePsA patients (n = 2) in pink (a) and between ABCs from eRA patients (n = 4) in purple and ABCs from HC (n = 3) in pink (d). Gene expression intensities were transformed to Z‐scores and are displayed as colours ranging from yellow to red as shown in the key. (b) and (e) Volcano plot showing the log2 fold change against the –log10 p value, genes plotted in red are upregulated and genes in green are downregulated in ABCs from eRA patients compared to ABCs from ePsA patients (b) and ABCs from HC (e). Genes achieved statistical significance when the adjusted p value was <0.05 (FDR corrected) and the absolute fold change was >1.5. (c) Table showing significantly upregulated genes, with their fold change and adjusted p value. (f) Table showing significantly downregulated genes (green) and upregulated genes (red), with their fold change and adjusted p value
