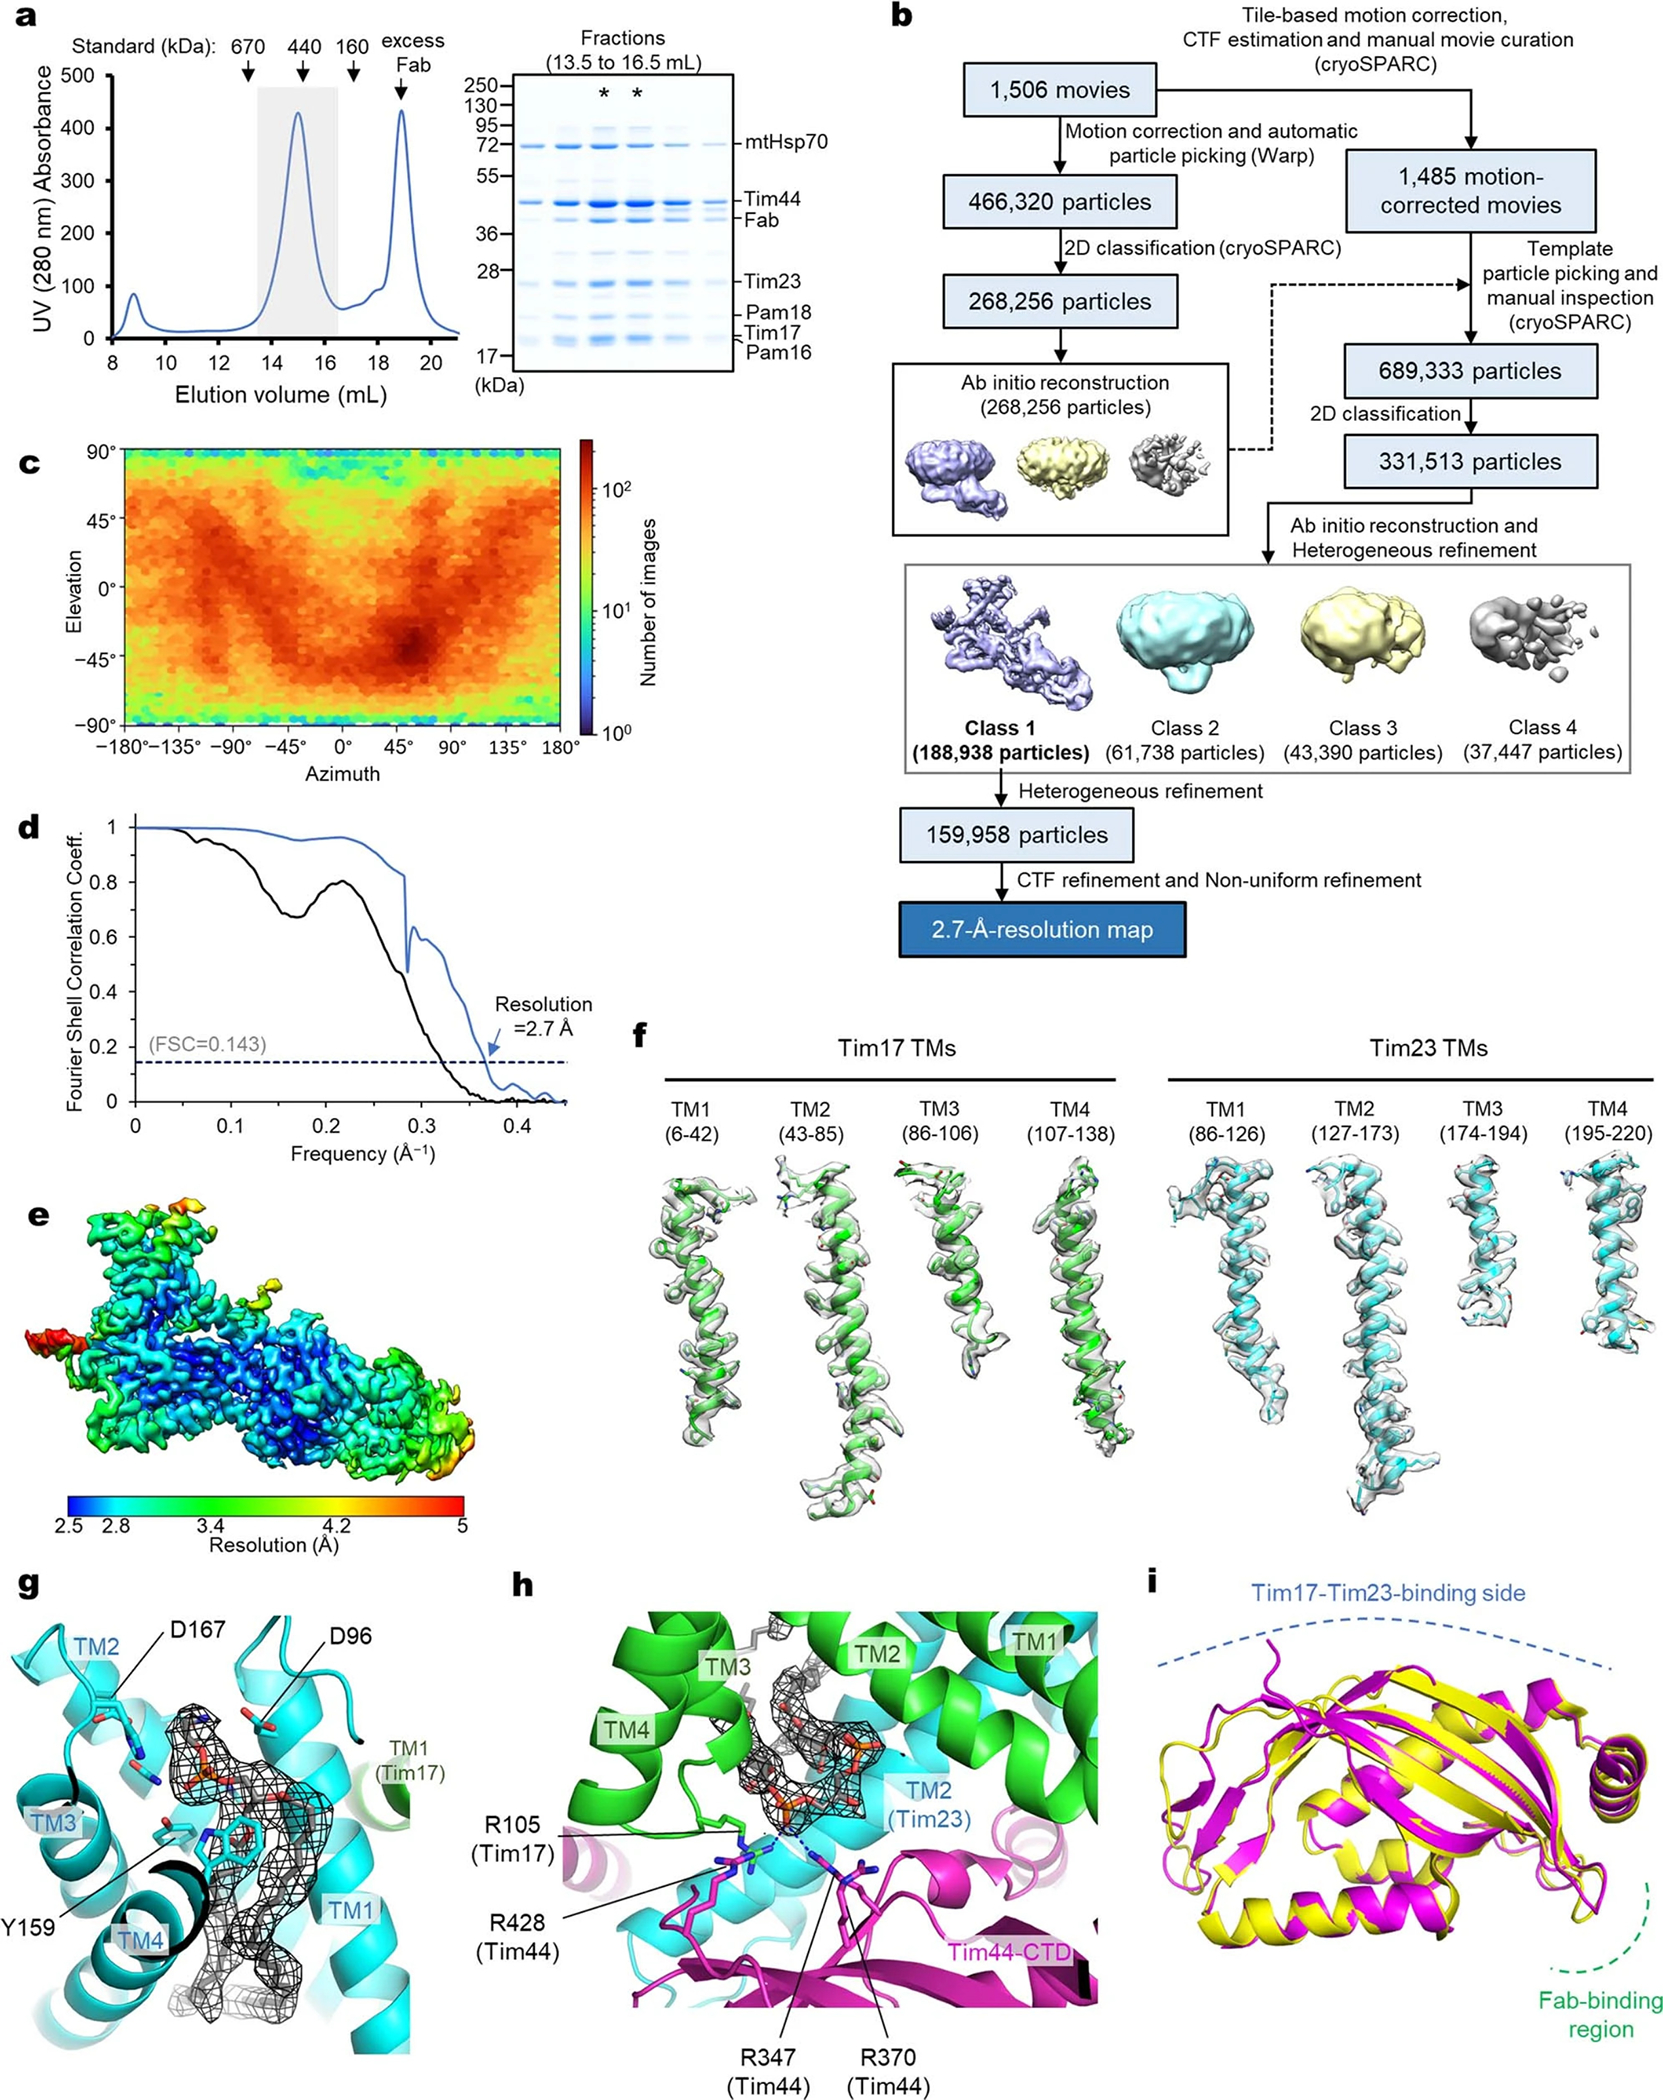
Extended Data Fig. 2 |. 2.7-Å-resolution cryo-EM structure of the TIM23 complex (Tim17/23/44 + Pam16/18).

a, Purification of the Fab-bound core TIM23 complex (Tim17/23/44 + Pam16/18). Left, Superose-6 SEC elution profile; right, Coomassie-stained non-reducing SDS gel of fractions indicated in the left panel by a gray box. Fractions marked with asterisks were pooled and used for cryo-EM analysis. b, Summary of single particle analysis of the Fab-bound TIM23 complex. c–e, Particle view distribution (c), Fourier shell correlation (d), and local resolution distribution (e) for the Fab-bound TIM23 complex. f, Examples of segmented EM densities and atomic models. The amino acid ranges are indicated. The threshold values for the map range from 7.8 to 8.9σ. g, Phospholipid bound to the cavity of Tim23. The EM density of the phospholipid is shown as black mesh (at a map threshold value of 5.9σ). Side chains contacting the lipid head group are shown as sticks. We note that, although the identity of the phospholipid could not be unambiguously determined, the EM density agrees very well with phosphatidylethanolamine. h, As in Fig. 1b, but showing a zoomed-in view for the cardiolipin molecule. The EM density is shown in black mesh (at a map threshold value of 10.6σ). Polar interactions are indicated by dashed line. i, Superposition between Tim44 structures from the present cryo-EM study and a previous X-ray crystallography study (PDB: 2FXT). The root-mean-square deviation (RMSD) is 0.75 Å for Cα atoms. Data shown in a are representative of two experiments.
