

Abstract
The ratio of non-high-density lipoprotein cholesterol (non-HDL-C) to HDL-C (NHHR) is a novel lipid parameter used to assess the risk of cardiovascular disease. Previous studies have demonstrated an association between the NHHR and risk of non-alcoholic fatty liver disease (NAFLD). Owing to the lack of research exploring this relationship in specific populations, this study aimed to determine the potential link between the NHHR and risk of NAFLD among American adults in the United States. Data were retrieved from the National Health and Nutrition Examination Survey (NHANES) spanning 2017–2020. After excluding individuals with other liver diseases, alcohol abuse, and missing lipid data, a total of 6809 eligible adults were included for analysis. The NHHR was calculated as the ratio of (non-HDL-C) to HDL-C, while NAFLD was identified by liver steatosis detected by transient elastography. Multivariable weighted logistic regression models and restricted cubic spline (RCS) models were employed to investigate the relationship between the NHHR and risk of NAFLD. Subgroup and sensitivity analyses were also conducted to test the robustness of the results. As the NHHR increased, the prevalence of NAFLD rose progressively (5.88% vs. 8.75% vs. 12.24% vs. 15.77%, p < 0.001). In the overall population, after adjusting for confounding factors, each unit increase in the NHHR was associated with a 25% increase in NAFLD risk (OR = 1.25, 95% CI: 1.03–1.53, p = 0.0372). When the NHHR was analyzed as a categorical variable (quartiles), participants in the highest quartile had a significantly higher risk of NAFLD than those in the lowest quartile (OR = 2.6, 95% CI: 1.75–3.85, p = 0.009). RCS analysis further indicated a nonlinear dose–response relationship between the NHHR and risk of NAFLD (p non-linearity < 0.0001). This association remained significant in both subgroup and sensitivity analyses. This study confirmed that the NHHR, particularly at higher levels, was an independent risk factor for NAFLD. As a comprehensive lipid indicator, the NHHR had the potential to predict NAFLD risk. These findings provided new insights for the prevention and clinical management of NAFLD.
Keywords: Non-high-density lipoprotein cholesterol to high-density lipoprotein cholesterol ratio, Non-alcoholic fatty liver disease, Non-high-density lipoprotein cholesterol, Cross-sectional study interests
Subject terms: Biomarkers, Epidemiology, Outcomes research
Introduction
Non-alcoholic fatty liver disease (NAFLD), which is characterized by excessive hepatic fat accumulation, has emerged as one of the most prevalent chronic conditions globally1,2. The increasing prevalence of obesity and type 2 diabetes has significantly contributed to the growing incidence of NAFLD3. Based on the latest meta-analysis, the global prevalence of NAFLD is estimated to be around 30.2% (95% CI: 28.7–31.7%), with Guatemala reporting the highest prevalence at 60.7% (95% CI: 57.9–63.3%)4. NAFLD is a spectrum of conditions, including steatohepatitis, liver fibrosis, cirrhosis, and even hepatocellular carcinoma, which impose a substantial burden to public health systems and economies5. The global economic burden of NAFLD is estimated in the hundreds of billions of dollars annually, with a continuing upward trend1,5. Thus, early identification of risk factors and the search for reliable biomarkers to predict the onset of NAFLD are particularly important.
Atherogenic dyslipidemia plays a critical role in the onset and progression of NAFLD2. The primary lipid parameters related to the onset, severity, and progression of NAFLD include total cholesterol (TC), low-density lipoprotein cholesterol (LDL-C), high-density lipoprotein cholesterol (HDL-C), and non-high-density lipoprotein cholesterol (non-HDL-C)6–8. The ratio of non- HDL-C to HDL-C (NHHR) is a novel atherogenic lipid composite indicator. NHHR addresses the limitations of individual lipid parameters by providing a more comprehensive assessment of lipid metabolic disorders9. As a composite indicator incorporating both risk factors (non-HDL-C) and protective factors (HDL-C) for atherosclerosis, NHHR not only measures the severity of atherosclerosis but is also strongly linked to the risk of various diseases10. Compared to individual lipid parameters, NHHR shows superior predictive capacity for cerebrovascular diseases, liver disease, and hyperuricemia. Moreover, studies have demonstrated that NHHR outperforms traditional lipid markers in diagnosing insulin resistance and metabolic syndrome11–13. In patients with diabetes or prediabetes, NHHR exhibits a U-shaped relationship with all-cause mortality and an L-shaped relationship with cardiovascular mortality, highlighting its robust predictive value14. Notably, NHHR also shows significant diagnostic value for predicting NAFLD. Prospective studies have found that NHHR provides greater accuracy in predicting NAFLD in both Japanese and Chinese populations, surpassing traditional lipid markers such as non-HDL-C9,15,16. These findings suggest that NHHR not only offers advantages in diagnosing insulin resistance and cardiovascular diseases but may also serve as a valuable tool for predicting NAFLD, providing new insights for clinical management. However, there is a lack of sufficient evidence to support the association between the NHHR and risk of NAFLD in other racial groups. Specifically, in the United States, there have been no large-scale studies to systematically explore this association. Therefore, further research is needed to explore the usefulness of the NHHR to predict the risk of NAFLD in the American population.
Therefore, this cross-sectional study utilized data from the 2017 to 2020 National Health and Nutrition Examination Survey (NHANES) to examine the relationship between NHHR and NAFLD in U.S. adults. The primary objective was to evaluate the predictive capacity of NHHR for NAFLD risk, thereby enhancing the understanding of lipid metabolism disorders and their association with NAFLD.
Materials and methods
Study population
Data were retrieved from the 2017 to 2020 NHANES, which was designed to assess the health and nutritional status of adults and children in the United States. The survey combined interviews and physical examinations, covering demographic, socioeconomic, dietary, and health-related questions, to ensure the reliability of nationally representative data. This dataset was specifically chosen because it contains detailed VCTE (Vibration-Controlled Transient Elastography) examination data, which is crucial for NAFLD-related analyses.
The study protocol was approved by the National Center for Health Statistics Research Ethics Review Board of the Centers for Disease Control and Prevention and all participants provided written informed consent. For more details, please visit the online website at https://www.cdc.gov/nchs/nhanes/index.htm.
The study cohort included 15,560 participants from the NHANES survey conducted between 2017 and March 2020. Initially, 9023 participants who completed the elastography examination were selected. The exclusion criteria were: (1) age < 18 years; (2) autoimmune hepatitis; (3) positive for hepatitis B or C infection; (4) liver cancer; (5) alcohol abuse (defined as an average daily consumption of ≥ 2 standard alcoholic drinks for women or ≥ 3 for men); (6) use of lipid-altering medications for at least 6 months; and (7) missing TC or HDL-C data, rendering calculation of the NHHR impossible. These conditions may affect liver function or lipid metabolism, thereby interfering with the accurate analysis of the relationship between NHHR and NAFLD. Ultimately, 6809 participants were included in the study (Fig. 1).
Fig. 1.
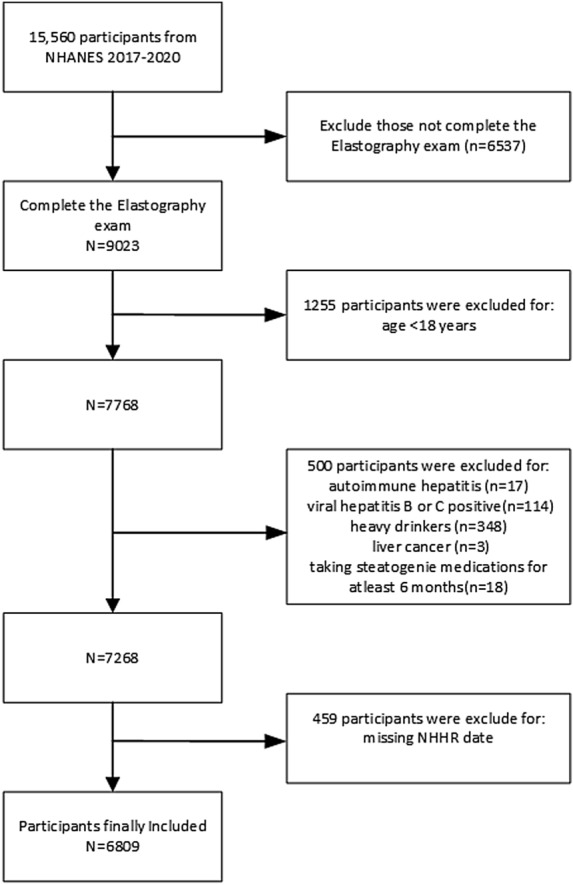
Flowchart of the selection of the study participants.
NHHR calculation
The NHHR was calculated as non-HDL-C/HDL-C, where non-HDL-C was calculated as TC-HDL-C.
NAFLD assessment
During the NHANES from 2017 to March 2020, all participants aged ≥ 12 years underwent transient elastography examinations. The controlled attenuation parameter (CAP) to measure fat content in the liver and liver stiffness were measured using an ultrasound system with a handheld transducer (FibroScan® model 502 V2 Touch; (Echosens, Waltham, MA, USA). A complete examination was defined as 10 or more valid stiffness measurements, a fasting time of at least 3 h, and an interquartile range to median ratio of liver stiffness ≤ the interquartile range, and a median CAP score ≥ 274 dB/m. NAFLD was diagnosed based on the presence of hepatic steatosis without excessive alcohol consumption or other chronic liver diseases17,18.
Assessment of covariates
To investigate the independent association between the NHHR and risk of NAFLD, analyses were adjusted for potential confounding sociodemographic and health-related variables. The sociodemographic variables included age, sex (female and male), race/ethnicity (Mexican American, other Hispanic, non-Hispanic White, non-Hispanic Black, and other races), and education level (grade > 9, grade 9–11, high school graduate, some college, and college graduate or above). Marital status was categorized into three levels (married, separated, and never married). The family income to poverty ratio (PIR) was divided into three levels (< 1.3, 1.3–3.5, and > 3.5)19.
The health-related variables included body mass index (BMI), alanine aminotransferase (ALT), aspartate aminotransferase (AST), history of diabetes, hypertension, and smoking status20. BMI was measured directly in the Mobile Examination Center and calculated as weight divided by height squared (kg/m2). Serum samples were processed and transported to the University of Minnesota for analysis of TC, HDL-C, ALT, and AST levels. Detailed procedures can be found in the NHANES Laboratory Procedures Manual. A history of diabetes was defined as a self-reported physician diagnosis or current use of insulin. A history of hypertension was defined as a self-reported physician diagnosis or blood pressure exceeding 140/90 mmHg. Smoking status was determined based on lifetime smoking of at least 100 cigarettes.
Statistical analyses
Statistical analyses were performed using R software (version 4.2.3; https://www.r-project.org/). In the final sample of 6809 participants, demographic data and questionnaire responses marked as “Refused” or “Don’t know” were recoded as missing. Variables with ≥ 20% of missing values were excluded from analysis. For variables with < 20% of missing values, it was assumed that the data were missing at random, and multiple imputation methods were employed to fill in the missing data to generate the final dataset for analysis. To ensure that the sample was representative of the general population, all data were weighted in accordance with the NHANES guidelines. The participants were categorized into four groups according to the quartiles (Q1–Q4) of NHHR. Normally distributed continuous variables are expressed as the mean (standard error) and otherwise as the median (interquartile range). Categorical variables are presented as numbers (percentages). Group comparisons were conducted using the weighted t-test, Mann–Whitney U test, and chi-square test.
The relationship between the NHHR and NAFLD was examined using weighted binary logistic regression models. The odds ratio (OR) and 95% confidence interval (CI) were calculated. Both continuous and categorical models were used. In the categorical model, NHHR was divided into quartiles, with the lowest quartile serving as the reference group. To enhance the reliability of the results and minimize the influence of confounding factors, three models were constructed, with covariates progressively introduced for adjustment. Model 1 was not adjusted for any covariates. Model 2 was adjusted for age, sex, race, marital status, family PIR, education level, and BMI. Model 3 was further adjusted for ALT, AST, hypertension, diabetes, and smoking status. Additionally, restricted cubic splines (RCS) were used to identify potential dose–response relationships between the NHHR and risk of NAFLD. Subgroup analyses were conducted to assess the consistency of the results and to investigate potential differences based on sex, age, race, PIR, education level, and marital status. To further ensure the robustness of the analysis, two sensitivity analyses were conducted to reduce selection bias and verify the stability of the results across different populations. The first used propensity score matching (PCM) to adjust for confounders between NAFLD and non-NAFLD participants. The second excluded participants with hypercholesterolemia (non-HDL-C ≥ 4.1 mmol/L)21. A probability (p) value < 0.05 was considered statistically significant (α = 0.05, two-sided test).
Results
Baseline characteristics of participants
Table 1 presents the baseline characteristics of participants selected from the NHANES between 2017 and 2020, categorized by NHHR quartiles. In total, 6809 participants (mean age, 48.93 ± 18.27 years; 48.44% male and 51.56% female) were included in the study. The NHHR quartile ranged were 0.28–1.82, 1.82–2.5, 2.5–3.37, and 3.37–26.84, respectively. The overall prevalence of NAFLD was 42.66%, with quartile-specific prevalence rates of 5.88%, 8.75%, 12.24%, and 15.77% from Q1 to Q4, respectively. The prevalence of NAFLD increased significantly with the NHHR.
Table 1.
Weighted baseline characteristics of the included participants.
| Variables | Overall | Quartile 1 | Quartile 2 | Quartile 3 | Quartile 4 | p |
|---|---|---|---|---|---|---|
| N | 6809 | 1703 | 1704 | 1697 | 1705 | |
| Age (years) | 48.93 (18.27) | 47.89 (20.48) | 49.26 (19.07) | 50.15 (17.24) | 48.43 (15.89) | 0.004 |
| Sex (%) | ||||||
| Male | 3298 (48.44) | 621 (36.47) | 730 (42.84) | 851 (50.15) | 1096 (64.28) | < 0.001 |
| Female | 3511 (51.56) | 1082 (63.53) | 974 (57.16) | 846 (49.85) | 609 (35.72) | |
| BMI (kg/m2) | 29.70 (7.25) | 26.93 (6.92) | 29.11 (6.95) | 30.97 (7.27) | 31.78 (6.89) | < 0.001 |
| Race (%) | ||||||
| Mexican American | 879 (12.91) | 173 (10.16) | 193 (11.33) | 236 (13.91) | 277 (16.25) | < 0.001 |
| Other Hispanic | 740 (10.87) | 140 (8.22) | 185 (10.86) | 189 (11.14) | 226 (13.26) | |
| Non-Hispanic white | 2328 (34.19) | 570 (33.47) | 600 (35.21) | 577 (34.00) | 581 (34.08) | |
| Non-Hispanic black | 1679 (24.66) | 543 (31.88) | 445 (26.12) | 398 (23.45) | 293 (17.18) | |
| Other race | 1183 (17.37) | 277 (16.27) | 281 (16.49) | 297 (17.50) | 328 (19.24) | |
| Education level (%) | ||||||
| Grade > 9 | 503 (7.39) | 77 (4.52) | 99 (5.81) | 152 (8.96) | 175 (10.26) | < 0.001 |
| Grade 9–11 | 665 (9.77) | 145 (8.51) | 150 (8.80) | 172 (10.14) | 198 (11.61) | |
| High school graduate | 1735 (25.48) | 469 (27.54) | 415 (24.35) | 430 (25.34) | 421 (24.69) | |
| Some college or AA degree | 2244 (32.96) | 563 (33.06) | 592 (34.74) | 571 (33.65) | 518 (30.38) | |
| College graduate or above | 1662 (24.41) | 449 (26.37) | 448 (26.29) | 372 (21.92) | 393 (23.05) | |
| Marital status (%) | ||||||
| Married/Living with partner | 3906 (57.37) | 854 (50.15) | 954 (55.99) | 1024 (60.34) | 1074 (62.99) | < 0.001 |
| Widowed/Divorced/Separated | 1469 (21.57) | 384 (22.55) | 386 (22.65) | 372 (21.92) | 327 (19.18) | |
| Never married | 1434 (21.06) | 465 (27.30) | 364 (21.36) | 301 (17.74) | 304 (17.83) | |
| PIR (%) | ||||||
| < 1.3 | 1644 (24.14) | 434 (25.48) | 381 (22.36) | 415 (24.45) | 414 (24.28) | 0.7 |
| 1.3–3.5 | 2297 (33.73) | 551 (32.35) | 578 (33.92) | 566 (33.35) | 602 (35.31) | |
| > 3.5 | 2868 (42.12) | 718 (42.16) | 745 (43.72) | 716 (42.19) | 689 (40.41) | |
| NAFLD (%) | ||||||
| No | 3904 (57.34) | 1302 (76.45) | 1108 (65.02) | 863 (50.85) | 631 (37.01) | < 0.001 |
| Yes | 2905 (42.66) | 401 (23.55) | 596 (34.98) | 834 (49.15) | 1074 (62.99) | |
| HDL (mmol/L) | 1.37 (0.39) | 1.750(0.42) | 1.445 (0.27) | 1.24 (0.22) | 1.04 (0.20) | < 0.001 |
| TC (mmol/L) | 4.77 (1.04) | 4.16 (0.88) | 4.546 (0.85) | 4.84 (0.86) | 5.54 (1.05) | < 0.001 |
| ALT (U/L) | 21.62 (16.10) | 18.18 (16.54) | 19.318 (11.77) | 22.067 (14.486) | 26.91 (19.23) | < 0.001 |
| AST (U/L) | 21.12 (11.23) | 21.05 (14.66) | 20.258 (8.97) | 20.680 (8.880) | 22.49 (11.28) | < 0.001 |
| Hypertension (%) | ||||||
| No | 3858 (56.66) | 1023 (60.07) | 998 (58.57) | 922 (54.33) | 915 (53.67) | < 0.001 |
| Yes | 2951 (43.34) | 680 (39.93) | 706 (41.43) | 775 (45.67) | 790 (46.33) | |
| Smoke status (%) | ||||||
| No | 2582 (37.92) | 604 (35.47) | 599 (35.15) | 644 (37.95) | 735 (43.11) | < 0.001 |
| Yes | 4227 (62.08) | 1099 (64.53) | 1105 (64.85) | 1053 (62.05) | 970 (56.89) | |
| Hyperglycemia (%) | ||||||
| No | 4136 (60.74) | 1072 (62.95) | 1059 (62.15) | 1025 (60.40) | 980 (57.48) | 0.078 |
| Yes | 2673 (39.26) | 631 (37.05) | 645 (37.85) | 672 (39.60) | 725 (42.52) | |
Q1–Q4 quartiles of NHHR values, with Q1 being the lowest and Q4 being the highest; PIR poverty to income ratio; NAFLD non-alcoholic fatty liver disease; HDL high-density lipoprotein cholesterol; TC total cholesterol; ALT alanine aminotransferase; AST aspartate aminotransferase. The data are presented as the mean (standard error) or percentage.
Significant differences were observed across NHHR quartiles in terms of mean age, sex distribution, BMI, race, education level, marital status, prevalence of NAFLD, lipid parameters (HDL-C and TC), liver enzymes (ALT and AST), hypertension, and smoking status (p < 0.001), but not the PIR and diabetes (p > 0.05).
Logistic analysis of the NHHR and NAFLD
The weighted logistic regression models confirmed that the NHHR was an independent risk factor for NAFLD. The analysis results are presented in Table 2. The findings indicate that for each unit increase in the NHHR, the risk of NAFLD was increased by 64% in Model 1, which was not adjusted for any confounders (odds ratio [OR] = 1.64, 95% confidence interval [CI]: 1.47–1.83, p < 0.0001). In Model 2, which was adjusted for age, sex, race, marital status, family PIR, education level, and BMI, the risk increased by 29% (OR = 1.29, 95% CI: 1.11–1.50, p = 0.0041). In Model 3, which was further adjusted for ALT, AST, hypertension, diabetes, and smoking status, the risk of NAFLD was increased by 25% (OR = 1.25, 95% CI: 1.03–1.53, p = 0.0372). When the NHHR was analyzed as a categorical variable (quartiles), participants in the highest quartile (Quartile 4) had a significantly higher risk of NAFLD than those in the lowest quartile (Quartile 1), with the risk increasing by 1.60 times in Model 3 (OR = 2.60, 95% CI: 1.75–3.85, p = 0.009). Additionally, trend analysis revealed that the risk of NAFLD progressively increased with higher NHHR quartiles (p for trend = 0.0006).
Table 2.
Association between the NHHR and risk of NAFLD among US adults in the NHANES 2017–2020.
| OR (95% Cl), p value | |||
|---|---|---|---|
| Model 1a | Model 2b | Model 3c | |
| Continuous models | |||
| NHHR | 1.64(1.47,1.83) < 0.0001 | 1.29(1.11,1.50)0.0041 | 1.25(1.03,1.53)0.0372 |
| Categorical model | |||
| Quartile 1 | Reference | Reference | Reference |
| Quartile 2 | 1.84(1.44,2.34) < 0.0001 | 1.30(0.96,1.75)0.0718 | 1.30(0.78,2.18)0.1540 |
| Quartile 3 | 3.48(2.82,4.31) < 0.0001 | 1.96(1.42,2.70)0.0016 | 1.88(1.05,3.37)0.0427 |
| Quartile 4 | 5.85(4.85,7.04) < 0.0001 | 2.74(2.21,3.39) < 0.0001 | 2.60(1.75,3.85)0.0090 |
| P for trend | < 0.0001 | < 0.0001 | 0.0006 |
OR odds ratio; CI confidence interval.
aModel 1 not adjusted for any potential confounders.
bModel 2 adjusted for age, sex, race, marital status, family PIR, education level, and BMI.
cModel 3 further adjusted for ALT, AST, hypertension, diabetes, and smoking status in addition to the factors in Model 2.
Dose–response relationship between the NHHR and risk of NAFLD
The dose–response relationship between the NHHR and risk of NAFLD was examined using RCS. The results are shown in Fig. 2. In the RCS model, adjustments were made for age, sex, race, marital status, family PIR, education level, BMI, ALT, AST, hypertension, diabetes, and smoking status. The results indicated a nonlinear dose–response relationship between the NHHR and NAFLD (p for non-linearity < 0.0001). The four knot positions in the RCS curve were located at 1.15, 2.08, 2.97, and 4.97. At lower levels of the NHHR, the risk of NAFLD was relatively low. As the NHHR was increased, the risk of NAFLD began to rise significantly. Within the NHHR range of approximately 2.5 to 4.97, the OR values were slightly above 1, indicating a mild increase in the risk of NAFLD. When NHHR exceeded 4.97, the OR values rapidly increased, suggesting a significantly higher risk of NAFLD at high NHHR levels.
Fig. 2.

RCS model of the association between the NHHR and risk of NAFLD.
Subgroup and sensitivity analyses
The results of the subgroup analysis are presented in Fig. 3. The association between the NHHR and risk of NAFLD was significant across different groups based on sex, age, race, PIR, education level, marital status, hypertension, diabetes, and smoking status (p < 0.001), suggesting that the association was applicable to various demographic groups. The interactions of age, race, education level, marital status, hypertension, and diabetes with the NHHR were significant (p for interaction < 0.05), indicating that these variables significantly influenced the association between the NHHR and risk of NAFLD across different subgroups.
Fig. 3.

Subgroup analysis of the association between the NHHR and risk of NAFLD.
The results of the sensitivity analysis are presented in Table 3. After adjusting for confounders through propensity score matching (PCM), each unit increase in the NHHR was associated with a 20% increase in the risk of NAFLD (OR = 1.20, 95% CI: 1.03–1.39, p = 0.0176). When participants with hypercholesterolemia were excluded, each unit increase in the NHHR was associated with a 2.16-fold increase in the risk of NAFLD (OR = 2.16, 95% CI: 1.83–2.54, p < 0.0001). In the categorical model, as compared to the lowest quartile (Q1), the highest quartile (Q4) showed a significantly increased risk of NAFLD, with ORs of 2.20 (95% CI: 1.74–2.79, p < 0.0001) after PCM and 3.17 (95% CI: 1.45–6.93, p = 0.0238) after excluding participants with hypercholesterolemia. These results confirm that the NHHR is an important risk factor for NAFLD.
Table 3.
The results of sensitivity analyses.
| PCMa | Excluding participants with hypercholesteremiab | |||
|---|---|---|---|---|
| OR (95% Cl) | p | OR (95% Cl) | p | |
| Continuous models | ||||
| NHHR | 1.20(1.03,1.39) | 0.0176 | 2.16(1.83,2.54) | < 0.0001 |
| Categorical model | ||||
| Quartile 1 | Reference | Reference | ||
| Quartile 2 | 1.25(0.93,1.66) | 0.1211 | 1.30(0.76,2.24) | 0.1659 |
| Quartile 3 | 1.67(1.21,2.30) | 0.0030 | 1.90(1.01,3.60) | 0.0492 |
| Quartile 4 | 2.20(1.74,2.79) | < 0.0001 | 3.17(1.45,6.93) | 0.0238 |
OR odds ratio; CI confidence interval.
aPCM was performed based on age, sex, race, marital status, family PIR, education level, BMI, ALT, AST, hypertension, diabetes, and smoking status.
bAdjustments were made for age, sex, race, marital status, family PIR, education level, BMI, ALT, AST, hypertension, diabetes, and smoking status.
Discussion
This study utilized the NHANES database to conduct a cross-sectional analysis of the association between the NHHR and risk of NAFLD among American adults. The results indicated that the NHHR, especially at higher values, was significantly associated with the risk of NAFLD.
This study analyzed the correlation between the NHHR and risk of NAFLD using logistic regression models with the NHHR considered as both as a categorical variable divided into quartiles and as a continuous variable. The results showed that with the unadjusted model, the NHHR was associated with the risk of NAFLD (OR = 1.64, 95% CI: 1.47–1.83, p < 0.0001). Even with the fully adjusted model, which accounted for all covariates, the NHHR remained significantly associated with the risk of NAFLD (OR = 1.25, 95% CI: 1.03–1.53, p = 0.0372), indicating a strong and independent relationship between the NHHR and risk of NAFLD that is not influenced by baseline characteristics (e.g., sex, age, race, and PIR). When the NHHR was analyzed as a categorical variable with the logistic regression model, significant associations were only observed in the higher quartiles (Q3 and Q4), possibly reflecting a nonlinear relationship, where higher NHHR levels significantly increased the risk of NAFLD, whereas lower NHHR levels had a smaller impact. The RCS analysis confirmed a nonlinear dose–response relationship between the NHHR and risk of NAFLD (p for nonlinearity < 0.001). At lower NHHR levels, the risk of NAFLD was relatively low and stable. The risk began to rise significantly when the NHHR exceeded 2.5, reaching a relatively stable risk level around an NHHR value of 5.0. Subgroup analysis confirmed that this association applied to various demographic groups. Sensitivity analysis, which was adjusted for confounding factors through PCM and excluded participants with hypercholesterolemia, showed that the association between the NHHR and risk of NAFLD remained statistically significant. Individuals with higher NHHR levels still had a significantly increased risk of NAFLD. Although relatively few studies have directly explored the relationship between the NHHR and risk of NAFLD, existing literature suggests a correlation15,16. A cohort study of Chinese adults demonstrated that the NHHR was an independent predictor of NAFLD, with a stronger predictive effect than non-HDL-C16. A large single-center cross-sectional study by Yang et al. found that the NHHR was positively associated with the risk of NAFLD in Chinese children and adolescents, consistent with the findings of the present study15.
This study also found significant interactions between the NHHR and the variables of sex, age, race, education level, marital status, PIR, hypertension, and hyperglycemia (p for interaction < 0.05). The association between the NHHR and risk of NAFLD was stronger in younger participants (18–40 years), unmarried individuals, Mexican Americans, and those with lower educational attainment. Additionally, the risk of NAFLD was higher in non-hypertensive and non-diabetic populations as compared to their hypertensive and diabetic counterparts. This finding is consistent with other studies and may be due to competing or masking effects of other risk factors, such as older age, higher education level, hypertension, and diabetes22. These results suggest that the NHHR could be a primary risk factor for NAFLD in low-risk populations. In populations without hypertension and hyperglycemia, the association between the NHHR and risk of NAFLD was stronger, possibly because these individuals generally had better overall health, rendering changes to the NHHR more sensitive indicators of metabolic abnormalities. In contrast, in hypertensive and hyperglycemic populations, medication use, therapeutic interventions, comorbidities, and lifestyle choices may obscure the independent impact of the NHHR on risk of NAFLD, suggesting that health status influenced this relationship. Therefore, these potential influencing factors should be considered in practical applications.
The NHHR is considered a novel lipid indicator of atherosclerosis, and increasing evidence suggests that the NHHR is predictive of various lipid-related diseases, such as metabolic syndrome and insulin resistance, with greater diagnostic value than traditional lipid parameters13,23,24. This close association with multiple diseases confirms the effectiveness of the NHHR for lipid management24. The results of this study further validated the efficacy and robustness of the NHHR as a predictive indicator of the risk of NAFLD.
Dysregulation of cholesterol metabolism is a key metabolic factor in the pathogenesis of NAFLD2. The accumulation of intracellular fat leading to lipid droplet storage within hepatocytes is considered a hallmark of NAFLD25. This fat accumulation results from increased absorption of fatty acids, enhanced de novo lipogenesis, and impaired output and oxidation of fatty acids26. These dysfunctions in cellular processes alter the dynamic balance of lipids, leading to lipotoxicity7,27. Non-HDL-C includes LDL-C, very-low-density lipoprotein (VLDL)-C, and intermediate-density lipoprotein cholesterol (IDL-C), which play crucial roles in hepatic lipid accumulation and inflammatory responses28. High NHHR levels are typically associated with elevated non-HDL-C and reduced HDL-C. This lipid metabolism disorder may promote the development of NAFLD through mechanisms involving lipid peroxidation and fatty acid accumulation. Elevated non-HDL-C increases lipid peroxidation reactions within the liver, thereby producing large amounts of free radicals and oxidative stress, which damage hepatocytes24,27. Additionally, fatty acids in VLDL and LDL particles accumulate in the liver and contribute to fatty liver formation28. Moreover, an elevated NHHR is closely related to systemic inflammatory responses. Lipoprotein particles contained in non-HDL-C (such as VLDL and IDL) are not only lipid transport carriers, but also have pro-inflammatory properties29. High NHHR levels may trigger or exacerbate hepatic inflammation through increased production of pro-inflammatory cytokines and oxidative stress mechanisms.
Strengths and limitations of the study
The primary strength of this study was in the use of a large, nationally representative sample of North American adults (USA), with weighted analysis performed in accordance with the complex sampling design of the NHANES. Application of the sampling weights, stratification variables, and clustering variables provided by the NHANES ensured that the study was representative of the national population and corrected for sampling bias and non-response issues. The use of these weighted variables in descriptive statistics and logistic regression analysis ensured that the results accurately reflected the health status and risk factor associations of the entire adult population in the United States. Moreover, the analysis was adjusted for multiple confounding variables, which enhanced the credibility and generalizability of the findings. Additionally, the study further confirmed a nonlinear dose–response relationship between the NHHR and risk of NAFLD.
However, there were some limitations to this study. First, the cross-sectional design of this study could not establish a causal relationship between the NHHR and risk of NAFLD. Hence, future prospective studies are needed to confirm the direction and nature of this association. Second, the data were sourced from the NHANES, which, despite being nationally representative, is observational and may be subject to selection and information biases. For instance, self-reported data from participants may be inaccurate or incomplete. Although the analyses were adjusted for multiple potential confounding factors, the missing data in the NHANES 2017–2020 database might still left-out other unaccounted confounders, potentially affecting the accuracy of the results. Additionally, cholesterol data were obtained from only fasting samples, as non-fasting samples were not considered. Variations in laboratory testing could introduce bias. Finally, since the study sample consisted of American adults, the generalizability of the results may be limited. Differences in lifestyle, dietary habits, and genetic backgrounds across different countries and regions may affect the association between the NHHR and risk of NAFLD. Therefore, future studies should aim to validate these findings in diverse populations across various ethnic and geographic groups to strengthen the external validity of the results.
Conclusion
In conclusion, the findings of this study suggest a positive relationship between NHHR and the increasing prevalence of NAFLD, identifying NHHR as a promising novel predictor. This provides important evidence for the early prevention of NAFLD in high-risk individuals. Clinicians can utilize NHHR to detect those at elevated risk, thereby improving screening efficiency. Additionally, future research will require more high-quality studies to validate our findings.
Acknowledgements
The authors thank all the staff for their help. And we thank International Science Editing (http://www.internationalscienceediting.com) for editing this manuscript.
Abbreviations
- ALT
Alanine aminotransferase
- AST
Aspartate aminotransferase
- BMI
Body mass index
- CAP
Controlled attenuation parameter
- CDC
Centers for Disease Control and Prevention
- CI
Confidence interval
- HDL-C
High-density lipoprotein cholesterol
- IDL-C
Intermediate-density lipoprotein cholesterol
- LDL-C
Low-density lipoprotein cholesterol
- NAFLD
Non-alcoholic fatty liver disease
- NCHS
National Center for Health Statistics
- NHANES
National Health and Nutrition Examination Survey
- NHHR
Non-high-density lipoprotein cholesterol to HDL-C ratio
- non-HDL-C
Non-high-density lipoprotein cholesterol
- OR
Odds ratio
- PCM
Propensity score matching
- PIR
Poverty to income ratio
- RCS
Restricted cubic spline
- TC
Total cholesterol
- VLDL
Very-low-density lipoprotein
Author contributions
X.D.H. contributed to the conceptualization, methodology, data curation, investigation, software development, and writing of the original draft. J.L. was involved in the conceptualization, methodology, data curation, and validation of the study. L.F.Z. and C.Y.Z. both contributed to the conceptualization, methodology, and data curation. C.Y.L. provided critical revision of the manuscript for important intellectual content and was responsible for funding acquisition. All authors approved the manuscript and agreed to publish.
Data availability
The dataset was based on the NHANES, which is publicly available and could be found below: https://www.cdc.gov/nchs/nhanes/index.htm.
Declarations
Competing interests
The authors declare no competing interests.
Footnotes
Publisher’s note
Springer Nature remains neutral with regard to jurisdictional claims in published maps and institutional affiliations.
References
- 1.Riazi, K. et al. The prevalence and incidence of nafld worldwide: A systematic review and meta-analysis. Lancet Gastroenterol. Hepatol.7, 851–861 (2022). [DOI] [PubMed] [Google Scholar]
- 2.Powell, E. E., Wong, V. W. & Rinella, M. Non-alcoholic fatty liver disease. Lancet397, 2212–2224 (2021). [DOI] [PubMed] [Google Scholar]
- 3.Yuan, S. et al. Lifestyle and metabolic factors for nonalcoholic fatty liver disease: Mendelian randomization study. Eur. J. Epidemiol.37, 723–733 (2022). [DOI] [PMC free article] [PubMed] [Google Scholar]
- 4.Amini-Salehi, E. et al. Global prevalence of nonalcoholic fatty liver disease: An updated review meta-analysis comprising a population of 78 million from 38 countries. Arch. Med. Res.55, 103043 (2024). [DOI] [PubMed] [Google Scholar]
- 5.Devarbhavi, H. et al. Global burden of liver disease: 2023 update. J. Hepatol.79, 516–537 (2023). [DOI] [PubMed] [Google Scholar]
- 6.Heeren, J. & Scheja, L. Metabolic-associated fatty liver disease and lipoprotein metabolism. Mol. Metab.50, 101238 (2021). [DOI] [PMC free article] [PubMed] [Google Scholar]
- 7.Mato, J. M., Alonso, C., Noureddin, M. & Lu, S. C. Biomarkers and subtypes of deranged lipid metabolism in non-alcoholic fatty liver disease. World J. Gastroenterol.25, 3009–3020 (2019). [DOI] [PMC free article] [PubMed] [Google Scholar]
- 8.Musso, G., Saba, F., Cassader, M. & Gambino, R. Lipidomics in pathogenesis, progression and treatment of nonalcoholic steatohepatitis (Nash): Recent advances. Prog. Lipid Res.91, 101238 (2023). [DOI] [PubMed] [Google Scholar]
- 9.Lu, S. et al. Utility of traditional and non-traditional lipid indicators in the diagnosis of nonalcoholic fatty liver disease in a japanese population. Lipids Health Dis.21, 95 (2022). [DOI] [PMC free article] [PubMed] [Google Scholar]
- 10.Chen, T. et al. Association between non-high-density lipoprotein cholesterol to high-density lipoprotein cholesterol ratio (Nhhr) and kidney stone: Evidence from Nhanes 2007–2018. BMC Public Health.24, 1818 (2024). [DOI] [PMC free article] [PubMed] [Google Scholar]
- 11.Hou, K., Song, W., He, J. & Ma, Z. The association between non-high-density lipoprotein cholesterol to high-density lipoprotein cholesterol ratio (Nhhr) and prevalence of periodontitis among us adults: A cross-sectional nhanes study. Sci. Rep.14, 5558 (2024). [DOI] [PMC free article] [PubMed] [Google Scholar]
- 12.Wang, Z. et al. The relationship between non-high-density lipoprotein cholesterol to high-density lipoprotein cholesterol ratio (Nhhr) and hyperuricaemia. Lipids Health Dis. 23, (2024). [DOI] [PMC free article] [PubMed]
- 13.Zhen, R. et al. The relationship between non-Hdl-C/Hdl-C ratio (Nhhr) and vitamin D in type 2 diabetes mellitus. Diabetes Metab. Syndr. Obes.16, 2661–2673 (2023). [DOI] [PMC free article] [PubMed] [Google Scholar]
- 14.Tan, M. et al. The association between non-high-density lipoprotein cholesterol to high-density lipoprotein cholesterol ratio with type 2 diabetes mellitus: Recent findings from Nhanes 2007–2018. Lipids Health Dis.23, 151 (2024). [DOI] [PMC free article] [PubMed] [Google Scholar]
- 15.Yang, S. et al. Association between the non-Hdl-cholesterol to Hdl-cholesterol ratio and non-alcoholic fatty liver disease in Chinese children and adolescents: A large single-center cross-sectional study. Lipids Health Dis.19, 242 (2020). [DOI] [PMC free article] [PubMed] [Google Scholar]
- 16.Wang, K. et al. Non-Hdl-cholesterol to Hdl-cholesterol ratio is a better predictor of new-onset non-alcoholic fatty liver disease than non-Hdl-cholesterol: A cohort study. Lipids Health Dis.17, 196 (2018). [DOI] [PMC free article] [PubMed] [Google Scholar]
- 17.Siddiqui, M. S. et al. Vibration-controlled transient elastography to assess fibrosis and steatosis in patients with nonalcoholic fatty liver disease. Clin. Gastroenterol. Hepatol.17, 156–163 (2019). [DOI] [PMC free article] [PubMed] [Google Scholar]
- 18.Ciardullo, S. & Perseghin, G. Prevalence of Nafld, Mafld and associated advanced fibrosis in the contemporary United States population. Liver Int.41, 1290–1293 (2021). [DOI] [PubMed] [Google Scholar]
- 19.Qi, X. et al. The association between non-high-density lipoprotein cholesterol to high-density lipoprotein cholesterol ratio (Nhhr) and risk of depression among us adults: A cross-sectional Nhanes study. J. Affect. Disord.344, 451–457 (2024). [DOI] [PubMed] [Google Scholar]
- 20.Xue, Y., Xu, J., Li, M. & Gao, Y. Potential screening indicators for early diagnosis of Nafld/Mafld and liver fibrosis: Triglyceride glucose index-related parameters. Front. Endocrinol.13, 951689 (2022). [DOI] [PMC free article] [PubMed] [Google Scholar]
- 21.Civeira, F., Arca, M., Cenarro, A. & Hegele, R. A. A mechanism-based operational definition and classification of hypercholesterolemia. J. Clin. Lipidol.16, 813–821 (2022). [DOI] [PubMed] [Google Scholar]
- 22.Mao, Q., Zhao, J. & Zhao, X. Association of Non-Hdl-C-to-Hdl-C ratio with coronary lesions and its prognostic performance in first-onset Nstemi. Biomark. Med.17, 29–39 (2023). [DOI] [PubMed] [Google Scholar]
- 23.Sheng, G. et al. Utility of non-high-density lipoprotein cholesterol to high-density lipoprotein cholesterol ratio in evaluating incident diabetes risk. Diabetes Metab. Syndr. Obes.15, 1677–1686 (2022). [DOI] [PMC free article] [PubMed] [Google Scholar]
- 24.Wang, A. et al. Non-Hdl-C/Hdl-C ratio is associated with carotid plaque stability in general population: A cross-sectional study. Front. Neurol.13, 875134 (2022). [DOI] [PMC free article] [PubMed] [Google Scholar]
- 25.Chiappini, F., Desterke, C., Bertrand-Michel, J., Guettier, C. & Le Naour, F. Hepatic and serum lipid signatures specific to nonalcoholic steatohepatitis in murine models. Sci. Rep.6, 31587 (2016). [DOI] [PMC free article] [PubMed] [Google Scholar]
- 26.Mouskeftara, T. et al. Predicting non-alcoholic steatohepatitis: A lipidomics-driven machine learning approach. Int. J. Mol. Sci.25, 5965 (2024). [DOI] [PMC free article] [PubMed] [Google Scholar]
- 27.Svegliati-Baroni, G. et al. Lipidomic biomarkers and mechanisms of lipotoxicity in non-alcoholic fatty liver disease. Free Radical Biol. Med.144, 293–309 (2019). [DOI] [PubMed] [Google Scholar]
- 28.Lee, E., Korf, H. & Vidal-Puig, A. An adipocentric perspective on the development and progression of non-alcoholic fatty liver disease. J. Hepatol.78, 1048–1062 (2023). [DOI] [PubMed] [Google Scholar]
- 29.Raja, V. et al. Non-Hdl-cholesterol in dyslipidemia: Review of the state-of-the-art literature and outlook. Atherosclerosis383, 117312 (2023). [DOI] [PubMed] [Google Scholar]
Associated Data
This section collects any data citations, data availability statements, or supplementary materials included in this article.
Data Availability Statement
The dataset was based on the NHANES, which is publicly available and could be found below: https://www.cdc.gov/nchs/nhanes/index.htm.