Abstract
Net primary productivity (NPP) is an important parameter reflecting vegetation growth, and water is one of the necessary factors for vegetation growth. Investigating the mutual influence between NPP and water is significant for ensuring the stable development of the ecological environment. This study focuses on the Yangtze River Basin (YRB) as the research area, and based on medium-resolution imaging spectrometer (MODIS) data, climate data, and gravity recovery and climate experiment (GRACE) data, the spatiotemporal evolution characteristics of vegetation NPP and terrestrial water storage (TWS) in the YRB from 2000 to 2022 are explored and analyzes the mutual influence of NPP with climate factors and TWS. The results show that vegetation NPP (4.10 gC·m−2·a−1) and TWS (0.55 mm) in the YRB have exhibited an increasing trend from 2000 to 2022, with a strong correlation between the two, which is related to recent environmental policies. Analysis of the impact of climate factors on NPP reveals that temperature and TWS significantly positively impact NPP changes. Furthermore, comparisons between NPP and TWS indicate that changes in TWS substantially promote plant growth. In addition, the comparison between NPP and TWS indicates that changes in TWS have an important promoting effect on plant growth. Surface water (SWS) and soil water (SM) have a significant promoting effect on plant growth, but with a strong lag, while the consumption of groundwater (GWS) has been promoting plant growth without significant lag.
Supplementary Information
The online version contains supplementary material available at 10.1038/s41598-024-75447-5.
Keywords: Vegetation NPP, Yangtze River Basin, Terrestrial water storage, Climate change, Spatiotemporal evolution
Subject terms: Environmental sciences, Hydrology
Introduction
Net Primary Productivity (NPP) refers to the amount of organic matter accumulated by green plants per unit time and area. It represents the remaining amount of Gross Primary Productivity (GPP) produced by photosynthesis after deducting autotrophic respiration (RA). In ecology, NPP is a key parameter for scholars to reflect changes in the terrestrial ecological environment and evaluate the sustainable development of ecosystems1–5. It is also an indicator for many scholars to explore the material basis of ecosystem development6–9 playing an important role in the measurement and evaluation of ecosystems, and has always been a research hotspot10–14. NPP is influenced by both human activities and climate change15–18.
The Yangtze River Basin (YRB) Economic Belt is one of China’s most developed economic regions, characterized by abundant vegetation resources and serving as a crucial ecological security barrier for sustainable development. Understanding the spatiotemporal changes and influencing factors of vegetation NPP in the YRB is of great significance. In recent years, many scholars have investigated NPP changes in this region, highlighting the significant impact of environmental factors on NPP. Tang Xia et al. analyzed the mechanism of NPP impacts on the vegetation ecosystem in the watershed, based on data from 11 environmental factors, finding that its spatial distribution pattern is higher in the south and lower in the north. They also predicted that NPP in the YRB will exhibit a strong increasing trend over the next 20 years19,20. Beyond environmental factors, land properties also affect the long-term potential for vegetation change. Zhou Jiaxi et al. studied the spatiotemporal variation characteristics and patterns of farmland NPP in the middle and lower reaches of the YRB from 2000 to 2020, quantitatively analyzing the spatial heterogeneity of farmland NPP response to climate change21. Although extensive research has been conducted on the changes in vegetation NPP and its influencing factors in the YRB, less attention has been given to the analysis of water, particularly the effects of water storage on NPP.
Terrestrial water storage (TWS) plays an irreplaceable role in plant growth, and the Gravity Recovery and Climate Experiment (GRACE) mission provides a novel method for detecting TWS changes using satellite data22,23. In recent years, a large number of scholars have studied the changes in TWS in the YRB. Jian Hao et al. used the ITSG Trace2018 and ITSG Traceoperational time-varying gravity field models to invert the TWS changes in the YRB from 2002 to 2020, combining these with the GLDAS model, precipitation, temperature, and other data to comprehensively analyze TWS changes in the region24,25. Chaonengfang et al. estimated the spatiotemporal changes in precipitation and groundwater (GWS) in the YRB, quantifying the drought characteristics of the region. They found that soil water (SM), TWS, and GWS showed an increasing trend between 2003 and 201926,27. Some scholars have also combined vegetation growth and terrestrial water storage in a joint study. For example, Li Xiaoying et al. analyzed changes in TWS and vegetation cover in the YRB based on GRACE satellite data and the normalized vegetation index (NDVI) generated from MODIS remote sensing data, examining trends, correlations, and spatiotemporal variations28,29. However, few studies have combined TWS with NPP for research.
Overall, a large number of scholars have conducted extensive research on NPP and TWS, but there is relatively little research on the impact mechanism of vegetation NPP on TWS and the relationship between different aquifers. The study of TWS is crucial for systematically analyzing the spatiotemporal changes of vegetation NPP in the YRB and exploring its mechanisms as comprehensively as possible. Therefore, this study aims to explore the interaction between NPP and TWS by detecting the spatiotemporal changes of vegetation NPP and TWS in the YRB.
Data and methods
Study area
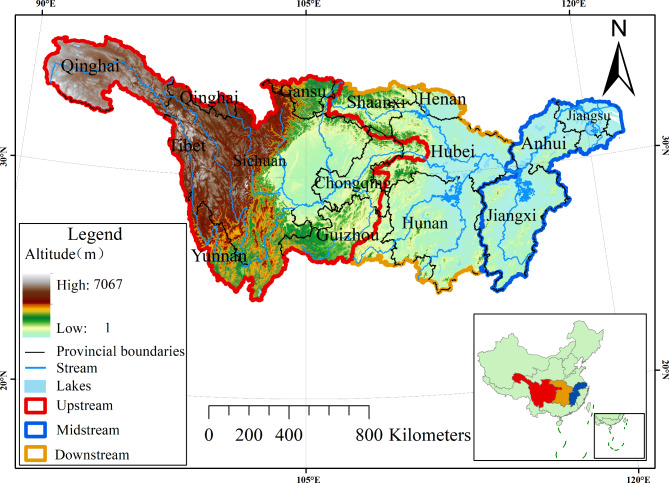
The Yangtze River, the largest river in Asia and China, ranks as the third-largest river globally. Covering 18.8% of China’s land area, the YRB extends from the Tanggula Mountain in Qinghai Province to its culmination in the East China Sea30,31. The basin spans longitudinally from 90° 33’ to 122° 25’ east and latitudinally from 24° 30’ to 35° 45’ north. Its topography exhibits a distinct three-tiered giant staircase, characterized by higher elevations in the west and lower elevations in the east. The first tier encompasses the southern part of Qinghai, the western plateau of Sichuan, and the Hengduan Mountains, featuring elevations ranging from 3500 to 5000 m. The second tier includes the Qinba Mountain, Sichuan Basin, and the Hubei Guizhou Mountain in the Yunnan-Guizhou Plateau, with elevations generally between 500 and 2000 m. The third tier is formed by Huaiyang Mountain, Jiangnan Hill, and the Middle and Lower Yangtze Valley Plain, characterized by elevations below 500 m. The region displays diverse landforms, including mountains, hills, basins, plateaus, and plains32,33. The climate of the YRB is predominantly subtropical monsoon, with a small portion experiencing a tropical monsoon climate34,35. The region’s complex topography and diverse climate result in a variety of vegetation types, including coniferous forests, broad-leaved forests, grasslands, agricultural land, and scrub36. Over the last 30 years, meteorological data analysis shows that the YRB has abundant precipitation, with an average annual precipitation of 1234.8 mm. The spatial trend of precipitation increases from west to east and from north to south, with a weakly increasing trend of 12.3 mm per decade over time37. The YRB is relatively rich in wetland resources, with numerous and interlocking lakes in the water system, and the TWS also shows an increasing trend year by year38,39. For the purpose of this study, the YRB is divided into upstream, midstream, and downstream regions. This division aims to analyze the evolving characteristics and influencing factors of NPP within these distinct regions, providing valuable insights into the intricate dynamics of vegetation growth in the YRB (see Fig. 1).
Fig. 1.
The YRB (China) topography.
Data
In this study, we used a comprehensive dataset consisting of NPP and multivariate data (as shown in Table 1). The objective is to study in depth the impact of various factors on NPP.
Table 1.
The data used in this paper.
| Data | Period | Spatial resolution | Website (access data: 13/08/2024) | |
|---|---|---|---|---|
| NPP | 2000–2022 | 500 m | https://ladsweb.nascom.nasa.gov/ | |
| Climatic factor | Sunshine | 2000–2019 | 1 km | http://data.cma.cn/data |
| Temperature | ||||
| Precipitation | ||||
| Water storage | Terrestrial water storage | 2003–2019 | 0.25° | http://data.tpdc.ac.cn/data |
| Surface water | 2003–2019 | 0.5° | (http://www.cjh.com) | |
| Soil water | 2003–2019 | 0.25° | ||
| Groundwater | 2003–2019 | 0.25° | ||
Net primary productivity
Remote sensing data is a pivotal information source for large-scale modeling and geoscientific research, offering extensive coverage, high resolution, and convenient data acquisition. The NPP data used in this study is derived from the MODIS17A3H dataset, covering the period from 2000 to 2022. The data has a spatial resolution of 500 m and a temporal resolution of 1 year, with valid values ranging from − 3000 to 32,700. To enhance the quality and applicability of the vegetation NPP data, several preprocessing steps were undertaken: (1) The MODIS Reprojection Tools (MRT) were used for mosaicking and converting the data format. (2) ArcGIS 10.7 software was employed to refine the dataset. This included removing outliers and resampling the resolution to 1 km to ensure consistency with other influencing factor image data. Bilinear resampling was carried out using ArcGIS to adjust the original 500 m resolution to 1 km to meet accuracy requirements and facilitate subsequent analysis. (3) Project the data onto the Krasovsky projection. Finally, the processed NPP data was clipped to match the designated study area, ensuring precision and relevance in subsequent analyses.
Data on impact factors
Geographic data
Geographical location and elevation data were extracted from the SRTM90m dataset, sourced from the Geospatial Data Cloud Platform. Collaboratively measured by NASA and the National Geospatial-Intelligence Agency (NGA) of the U.S. Department of Defense, the SRTM90m dataset boasts a spatial resolution of 90 m. To prepare these datasets for analysis, we utilized ArcGIS to resample the SRTM90m data to a 1 km resolution and projected it onto the Krasovsky projection. This preprocessing ensured consistency and compatibility among datasets, facilitating a comprehensive and precise analysis of geographic location and elevation within the study area.
Meteorological data
Meteorological data, including annual precipitation, annual mean temperature, and annual sunshine, was sourced from the China Meteorological Science Data Sharing Service Network (http://data.cma.cn/data). This dataset aggregates information from approximately 219 surface meteorological stations distributed across the YRB, spanning the years 2000 to 2019, providing a comprehensive 20-year dataset. The dataset was compiled using the Kriging interpolation method, which is available in the Geostatistical Analysis module of ArcGIS. This method ensured the creation of a dataset with a spatial resolution of 1 km, delivering detailed and accurate meteorological information for the study area.
Water storage data
This study utilizes water storage data encompassing TWS, Surface water (SWS), SM, and GWS.
TWS data were obtained from the China Regional Precipitation-based Reconstructed TWS Change Dataset (2002–2019), available from the National Tibetan Plateau Science Data Center. This dataset has a spatial resolution of 0.25° and required a month-by-month extraction process due to missing data in certain months. Complete data months from the years 2002 to 2019 were selected, excluding 2002, 2011, 2012, 2014, and 2015. To derive annual TWS data, monthly values from 13 years (January, May, July, November, and December) were averaged. The original NetCDF format was converted using ArcGIS software, and the dataset was resampled to a 1 km resolution. Subsequently, it was projected onto the Krasovsky projection based on vector data of the YRB obtained from the Center for Resource and Environmental Science and Data of the Chinese Academy of Sciences (http://www.resdc.cn).
SWS data were obtained from the WaterGAP global hydrological model.
SM data were sourced from the Global Land Data Assimilation System (GLDAS) provided by the National Oceanic and Atmospheric Administration of the USA, which has been utilized by previous researchers studying this region40,41. GLDAS offers spatial resolutions of 1°×1° and 0.25°×0.25°, with corresponding temporal resolutions of 1 month and 3 h, respectively. GWS is initially derived from TWS, which incorporates components such as SWS, SM, GWS, Snow Water Equivalent (SWE), and Plant Canopy Water (CWS). Specifically, GWS data is obtained by isolating the impact of vegetation, snow, ice, and SM from GLDAS, as well as SWS from WGHM, through subtraction from the TWS dataset26. The temporal coverage of this dataset spans from 2003 to 2019.
Results and analysis
This section is divided into two parts: spatial and temporal distribution characteristics of vegetation NPP, and analysis of influencing factors.
Spatial and temporal distribution characteristics of vegetation net primary productivity in the Yangtze River Basin
In this part, we separately counted the spatiotemporal changes of NPP and analyzed the rate of change and stability.
Spatial and temporal changes in vegetation net primary productivity in the Yangtze River Basin, 2000–2022
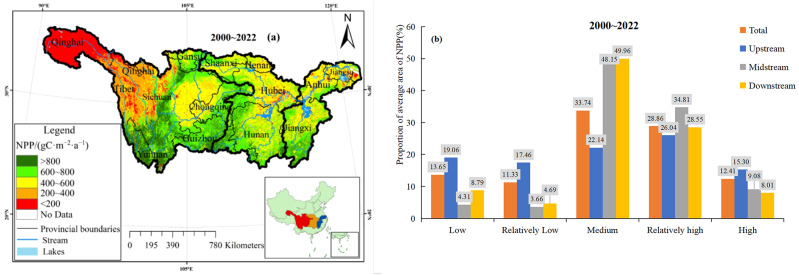
To explore the overall spatial distribution of vegetation NPP in the YRB, we calculated the average spatial distribution of NPP from 2000 to 2022 (Fig. 2-a) and the proportion of each partition area (Fig. 2-b). (1) NPP exhibits significant regional disparities, with higher values observed in the southeast and lower values in the northwest. (2) Magnitude Range: The range of NPP values is substantial, spanning from 0 to 2095gC·m− 2·a− 1. For clarity in subsequent analyses, we categorized NPP into five levels based on numerical averages: low (0 ~ 200 g C·m− 2·a− 1), medium-low (200 ~ 400 g C·m− 2·a− 1), medium (400 ~ 600gC·m−2·a− 1), medium-high (600 ~ 800 g C·m− 2·a− 1), and high (> 800 g C·m− 2·a− 1). 3)Distributional Differences: There are significant differences in the distribution of NPP between upstream, midstream, and downstream. The upstream NPP is mainly in the middle to high value area, while the middle and downstream NPP are mainly in the median area.
Fig. 2.
Mean spatial distribution of vegetation NPP in the YRB from 2000 to 2022 ((a) is the spatial distribution of different classes of NPP in the YRB; (b) is the area share of the YRB as well as the upstream, midstream, and downstream reaches of each NPP class).
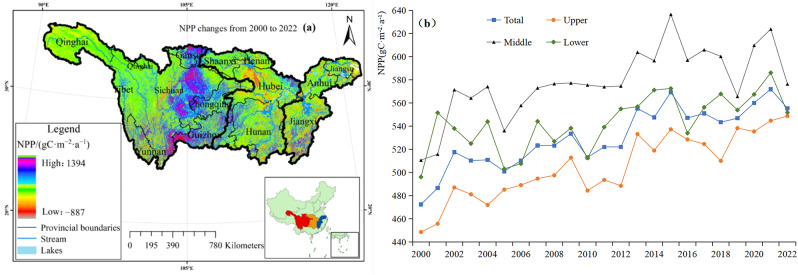
After understanding the average distribution of NPP in the YRB, we calculated the spatiotemporal variation of NPP in the YRB from 2000 to 2022 (Fig. 3). From the spatial map (Fig. 3-a), it can be seen that since 2000, the NPP in the YRB has shown an increasing trend in most regions; From the annual average time series chart of NPP (Fig. 3-b), it can be seen that since 2000, the NPP in the upper, middle, and lower reaches of the YRB has shown a trend of increasing year by year. Table 2 presents the proportion of different NPP levels in terms of area and overall changes in 2000 and 2022, providing a more accurate numerical representation of the changing characteristics of NPP in the YRB. The results showed that the area of low, medium low, and median areas decreased, while the area increased the most in the high-value area, which was 10.32%, equivalent to one-tenth of the area of the YRB.
Fig. 3.
Spatial and temporal changes of vegetation NPP in the YRB from 2000 to 2022 ((a) is the spatial change of vegetation NPP; (b) is the temporal change of vegetation NPP).
Table 2.
Summary of changes in the area share of each vegetation NPP class in the YRB from 2000 to 2022.
| NPP (gC·m−2·a−1) | NPP categories | Area ratio (2000) (%) | Area ratio (2022) (%) | Area ratio change (2000–2022) (%) |
|---|---|---|---|---|
| < 200 | Low | 14.88 | 12.53 | −2.35 |
| 200–400 | Lower | 19.12 | 13.08 | −6.04 |
| 400–600 | Median | 36.52 | 28.25 | −8.27 |
| 600–800 | Higher | 22.84 | 29.17 | 6.34 |
| > 800 | High | 6.64 | 16.96 | 10.32 |
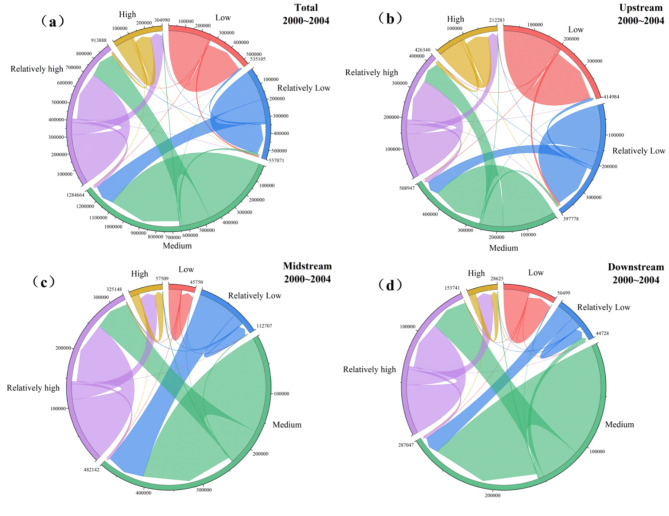
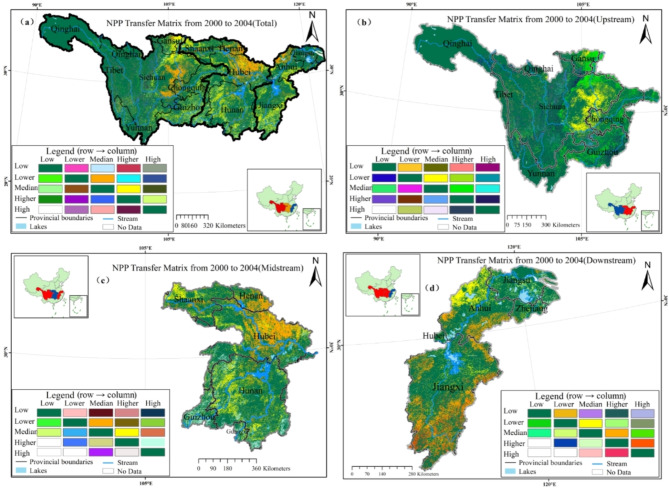
To more accurately evaluate the changes in NPP at different levels, considering the long period, we calculated the NPP transfer matrix for five periods (Fig. 4) and statistically analyzed the spatial changes in the upper, middle, and lower reaches of the YRB (Fig. 5). The results showed that the proportion of areas with unchanged levels during these five periods was around 75%, while the proportion of areas with medium to high values turning into median areas increased year by year.
Fig. 4.
The chordal diagram of the transfer matrix for different periods in the YRB ((a–d) shows the YRB, upstream, midstream, and downstream from 2000 to 2004, and the remaining years are shown in Fig. 1 in the Appendix).
Fig. 5.
The shift of each NPP class in the YRB at different times ((a–d) show the YRB, upstream, midstream, and downstream from 2000 to 2004, and the NPP class shifts for the rest of the years are shown in Fig. 2 in the Appendix).
The overall results show that the NPP in the YRB is showing an increasing trend. If NPP is used as the ecological environment assessment condition, the number of extreme deterioration areas in the YRB has significantly decreased in the past two decades. Most areas with low and medium-low values have transformed into median areas, and the median area is transforming into medium-high value areas. This indicates that the ecological environment in the YRB has been well improved.
Change rate and stability analysis
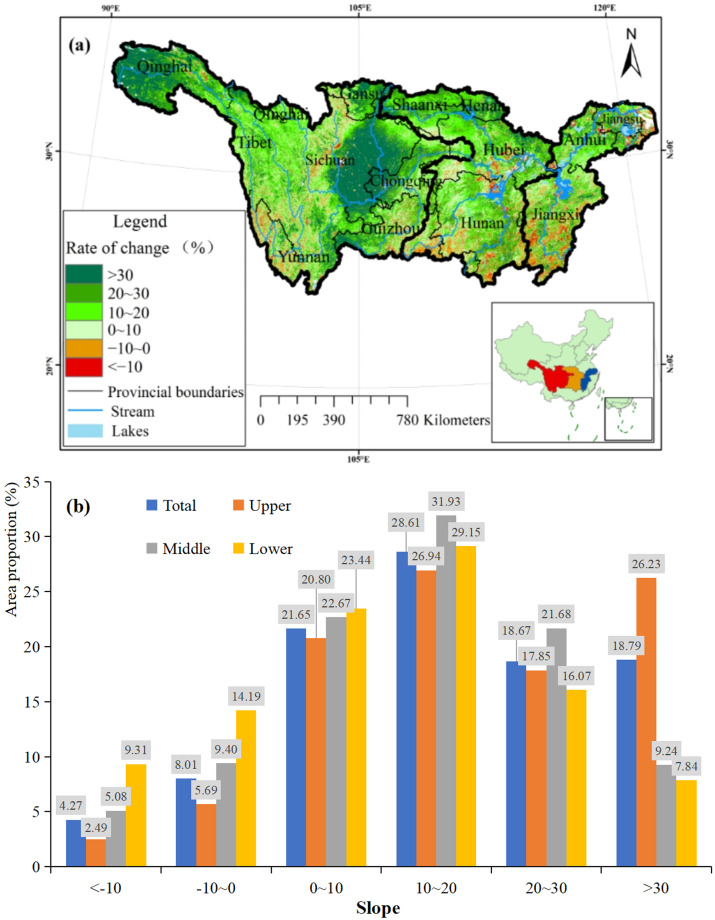
To gain a precise understanding of vegetation NPP changes in the YRB for ecological evaluations, we calculated the rate of change in NPP from 2000 to 2022 and categorized the statistics (Fig. 6). According to the magnitude of the change rate, it can be divided into six categories: moderate decrease zone (<-10), low decrease zone ( > − 10, < 0), low increase zone (> 0, < 10), moderate increase zone (> 10, < 20), higher increase zone (> 20, < 30), and high increase zone (> 30). The results indicate that from 2000 to 2022, 87.72% of the regions in the YRB showed an upward trend in NPP, mainly concentrated in the upstream provinces of Sichuan, Chongqing, and Qinghai. In the upper reaches of the YRB, a large proportion (91.83%) of the area shows an upward trend in NPP. In the middle reaches of the YRB, the proportion of areas with an upward trend in NPP is 85.52%. In the downstream, the proportion of areas with an upward trend in NPP is 76.49%. These findings indicate that the ecological environment of the YRB is in an environmentally friendly state. The significant increase in vegetation, especially in the middle and upper reaches, indicates a significant improvement in the situation. This positive trend may be attributed to environmental protection policies implemented in recent years, such as establishing ecological protection zones and returning farmland to forests.
Fig. 6.
Map of the results of the analysis of vegetation NPP change rate in the YRB ((a) is the spatial distribution of NPP change rate in the YRB; (b) is the statistical map of NPP change rate in the YRB).
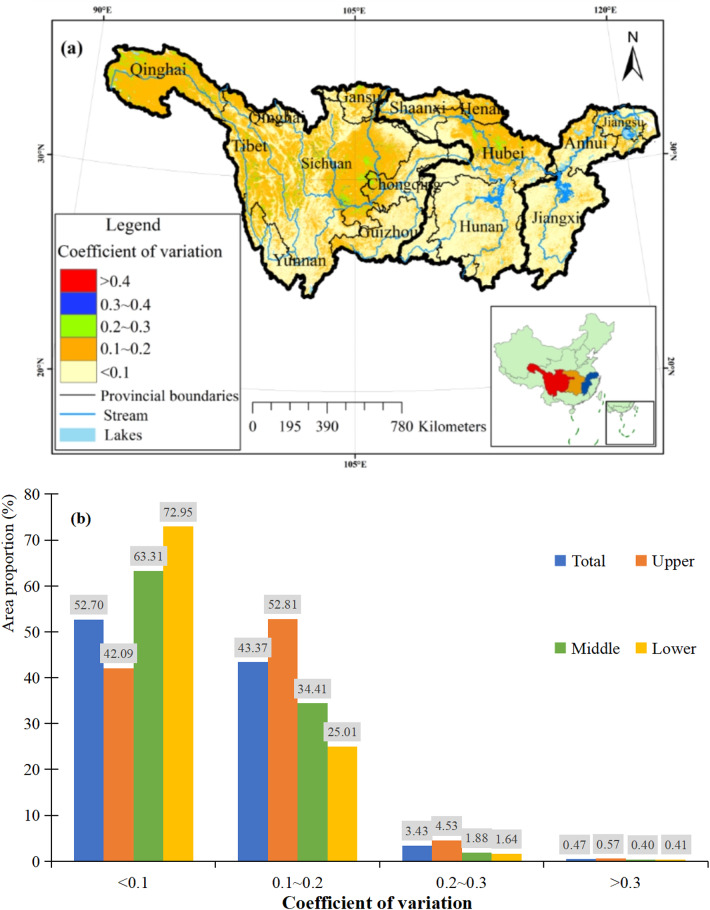
The coefficient of variation (CV) serves as a crucial indicator for assessing the degree of data variation. Generally, a higher coefficient of variation signifies greater data variability. To gauge the extent of NPP changes in the YRB, we employed the coefficient of variation to evaluate the stability of NPP changes (Fig. 7). The coefficient of variation values for vegetation NPP in the YRB ranged from 0.02 to 3.87, classified into five classes (< 0.1, 0.1 ~ 0.2, 0.2 ~ 0.3, 0.3 ~ 0.4, > 0.4). Overall, across the entire YRB: Regions with coefficients of variation < 0.1 and 0.1 ~ 0.2 accounted for 52.70% and 43.37% of the area, respectively. In the upstream, areas with coefficients of variation between 0.1 and 0.2 were most prevalent. In the middle and downstream reaches, areas with coefficients of variation < 0.1 predominated, with the middle reaches showing more extensive coverage. Regions with coefficients of variation > 0.2 were minimal, indicating higher stability in NPP changes. These findings suggest that the vegetation NPP in the YRB exhibits relative stability, with the upstream areas experiencing more moderate fluctuations, while the middle and downstream areas demonstrate greater stability in NPP changes.
Fig. 7.
Map of the results of NPP stability analysis of vegetation in the YRB ((a) shows the spatial distribution of NPP coefficient of variation of vegetation in the YRB; (b) shows the statistical map of NPP coefficient of variation of vegetation in the YRB).
Analysis of influencing factors
Impact analysis of climatic factors
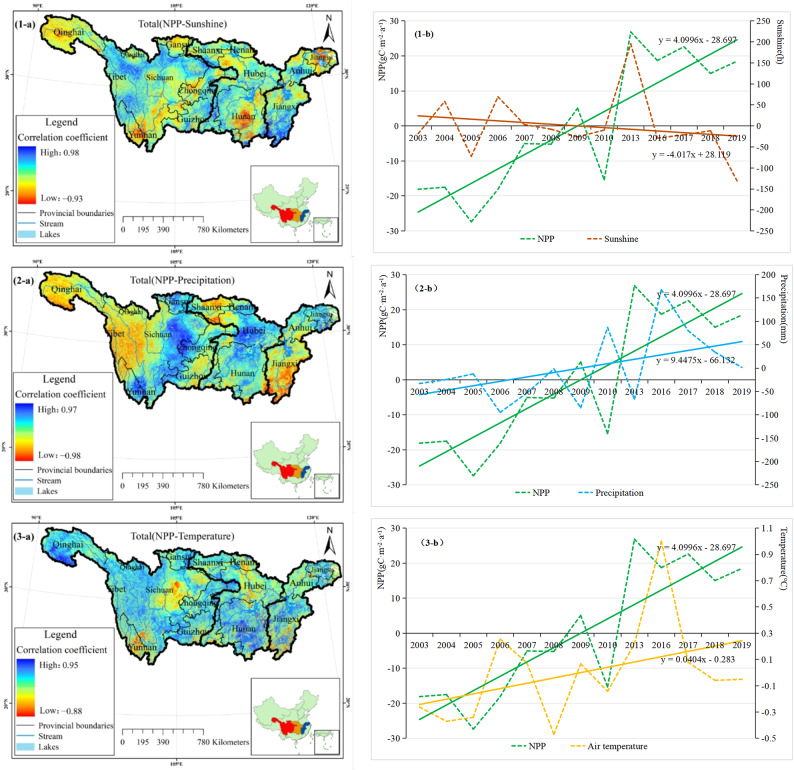
We conducted an analysis of the relationship between NPP and climate factors (sunshine, precipitation, and temperature), calculated their correlation coefficients, and statistically analyzed the proportion of areas with different degrees of correlation (as depicted in Fig. 8; Table 3). The results indicate that:
Fig. 8.
The spatial distribution and time series of correlation analysis between vegetation NPP and climate factors in the YRB from 2003 to 2019 (from top to bottom, namely sunshine, precipitation, and temperature).
Table 3.
Summary of the area share of correlation between NPP and climate factors in the YRB.
| Correlation coefficient | Correlation | Area proportion | ||
|---|---|---|---|---|
| Sunshine | Precipitation | Temperature | ||
| −1 ~ − 0.8 | Negative extremely strong | 0% | 0% | 0% |
| −0.8 ~ − 0.6 | Negative strong | 1% | 3% | 0% |
| −0.6 ~ − 0.4 | Negative moderate | 3% | 9% | 2% |
| −0.4 ~ − 0.2 | Negative weak | 10% | 15% | 5% |
| −0.2 ~ − 0 | Negative extremely weak | 23% | 21% | 14% |
| 0 ~ 0.2 | Positive extremely weak | 24% | 17% | 19% |
| 0.2 ~ 0.4 | Positive weak | 21% | 16% | 28% |
| 0.4 ~ 0.6 | Positive moderate | 13% | 13% | 23% |
| 0.6 ~ 0.8 | Positive strong | 5% | 5% | 8% |
| 0.8 ~ 1 | Positive extremely strong | 0% | 0% | 0% |
| Significance proportion (> 95%) | 91.77% | 86.98% | 87.39% | |
| Linear trend (npp:4.10) | − 4.02 | 9.45 | 0.04 | |
| Linear correlation coefficient with NPP | 0.10 | 0.31 | 0.54 | |
NPP was positively correlated with insolation in most of the areas (62.76%) and negatively correlated in about 37.24% of the areas, mainly in the northwestern part of the upper reaches and the southern part of the middle reaches. The positive correlation area between NPP and precipitation accounts for about 51.57%, mainly distributed in the eastern and middle reaches of the upstream, as well as the northeastern part of the downstream. The negative correlation area accounts for about 48.43%. From the perspective of location distribution, the impact area of precipitation is also closely related to altitude. The areas occupied by the positive correlation are mostly relatively low in terrain, indicating that precipitation is one of the main factors for vegetation growth in these areas. Generally speaking, temperature has a promoting effect on plant growth. In the YRB, the positive correlation area between NPP and temperature accounts for about 78.33%, distributed in various provinces and cities in the YRB, with Qinghai and Hunan provinces being the most significant. The proportion of negatively correlated regions is about 21.67%, with Sichuan and Yunnan provinces being the most significant.
Correlation analysis between net primary productivity and terrestrial water storage
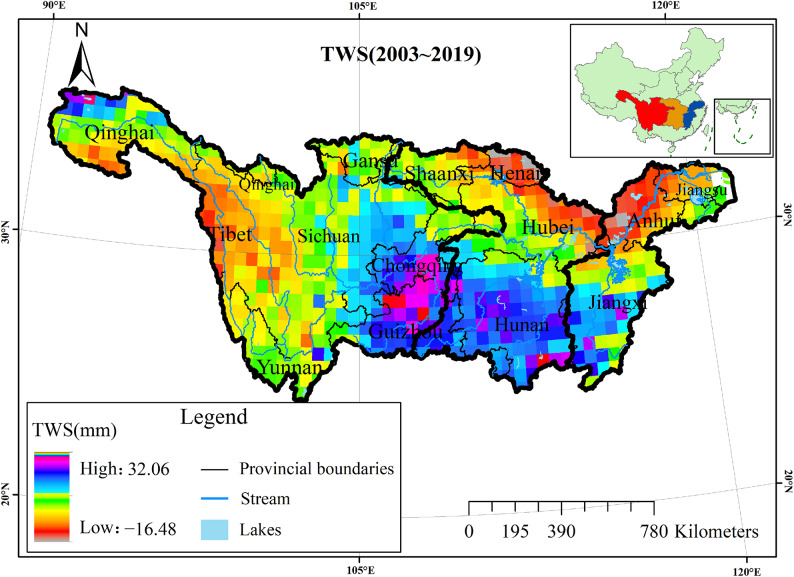
Subtracting the TWS image data from 2019 to 2003 can obtain the spatial variation map of TWS differences from 2003 to 2019 (Fig. 9). Given that the TWS data resolution is 0.25°, we used ArcGIS to resample the NPP data to 500 m for subsequent analysis. From the graph, it can be seen that from 2003 to 2019, the TWS in the western and northeastern regions of the YRB decreased, while the TWS in Qinghai Province and the central southern regions of the YRB increased.
Fig. 9.
Spatial distribution of TWS differences in the YRB from 2003 to 2019.
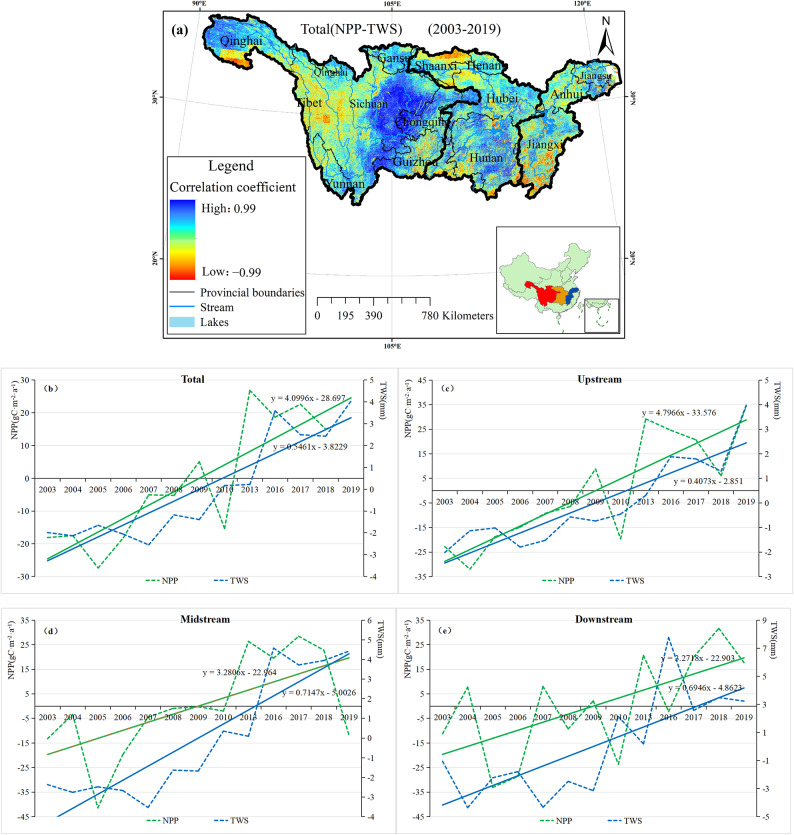
The spatial distribution map of the correlation analysis between NPP and TWS (Fig. 10-a) reveals that the positively correlated region covers the largest area, approximately 71.14%. The region includes the eastern part of the upper reaches of the YRB, Qinghai Province, the south-central part of the middle reaches, the central part of the lower reaches, and the northeastern part. Conversely, the negative correlation area covers about 28.86% of the total area and is concentrated in the western part of the upper reaches of the YRB, where the slope is relatively high. This indicates that the influence of TWS on vegetation NPP is less pronounced in areas with steeper terrain. By analysing the time-series plots of TWS and NPP (Fig. 10b-e), it can be observed that there is a clear inverse relationship between the trend of TWS and NPP in the YRB. Despite the different sources of TWS in the upper, middle and lower reaches of the YRB, the temporal trends were significantly consistent. Compared with the upper and middle reaches, TWS in the lower reaches changed more drastically over time. The main contributors to TWS in the lower reaches of the YRB were precipitation and runoff, both of which exceed the basin average. Therefore, the significant temporal changes in downstream TWS may be attributed to changes in precipitation and runoff.
Fig. 10.
Spatial distribution and time series plots of correlation analysis between NPP and TWS in the YRB.
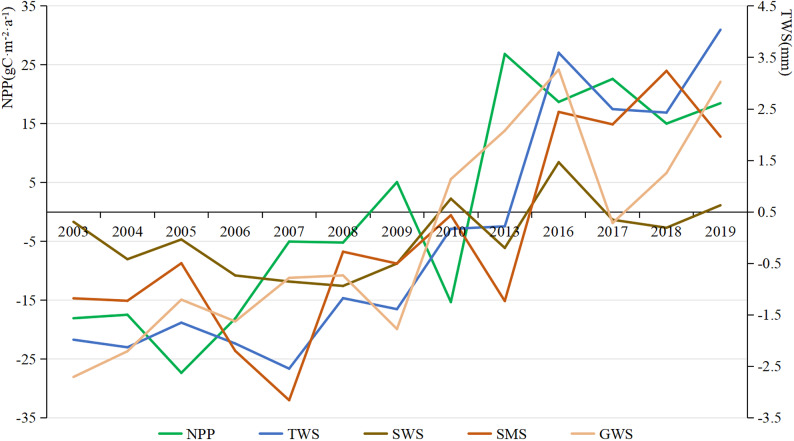
To comprehensively assess the effects of different water components on NPP, we conducted an analysis of the correlations between SWS, SM, GWS, and NPP individually. As shown in Fig. 11, the interannual variation of TWS showed a roughly opposite trend to that of NPP, and this phenomenon was most evident in the case of GWS, which suggests that plant growth consumes TWS, and in particular, the GWS component of TWS. As for the other water components (SW, SMS), it is not possible to precisely describe their relationship with NPP changes for the time being, for this reason, we lagged the data of each water component by one year (because the temporal resolution of NPP is one year), as shown in Fig. 12-a.
Fig. 11.
The time series of NPP and various water components.
Fig. 12.
Time series plot of TWS versus NPP lag with correlation coefficients from 2003 to 2019 ((a) Lagged time series plot; (b) Comparison of correlation coefficients before and after the lag).
The time series diagrams of TWS, SWS, GWS, and SM with a one-year lag (Fig. 12-a) indicate that the trends of SWS, SM, and TWS are generally consistent. This suggests that changes in SWS and SM in the YRB are closely associated with the processes of plant growth. Comparing the lagged correlation coefficients (Fig. 12-b) and the summary table of correlation coefficients (Table 4), it is observed that the correlation coefficients between TWS, SM, and SWS with vegetation NPP increase, while the correlation coefficient of GWS shows a slight decrease without significant change. Specifically, TWS, SM, and SWS exhibit a significant lag effect on plant growth, whereas GWS demonstrates a weaker lag effect on plant growth.
Table 4.
Summary of correlations between vegetation NPP and TWS in the YRB.
| Value | ||||
|---|---|---|---|---|
| TWS | SWS | SM | GWS | |
| Linear correlation coefficient with NPP | 0.77 | 0.35 | 0.58 | 0.74 |
| Linear correlation coefficient with NPP (hysteresis) | 0.91 | 0.78 | 0.94 | 0.71 |
| Root mean square | 12.77 | 12.68 | 12.74 | 12.74 |
| Root mean square (hysteresis) | 12.74 | 12.65 | 12.71 | 12.70 |
Taken together, when TWS increases in the YRB, especially SWS and SM, after a period of lag time (the lag time in this study is one year), it will greatly promote plant growth and lead to the increase of NPP. In addition, plant growth will continue to consume GWS. Therefore, in general, when assessing the mechanism of vegetation NPP change in the YRB, TWS change should not be ignored.
Discussion
This study explores the spatiotemporal variation of vegetation NPP in the YRB over a period of 23 years based on various data and quantifies its correlation with climate factors (sunshine, precipitation, temperature) and TWS. The overall results show that the NPP in the YRB has shown an increasing trend in the past two decades, and the ecological environment has been well improved. This conclusion has also been validated in relevant articles: The NPP of the entire watershed42–45, upstream46,47, midstream48,49, and downstream50 have all increased.
In the analysis and summary of the spatial and temporal changes of NPP in the YRB from 2000 to 2022, we averaged the NPP into five levels according to the magnitude of the values to quantify the severity of the changes in the NPP and calculated the mean distribution of each level and the changes over 23 years to assess the changes in the NPP. The NPP mean map of the YRB from 2000 to 2022 revealed that the spatial distribution of NPP in the YRB is extremely uneven and exhibits significant differences. To refine the time scale, we divided the study period into five years (2000 ~ 2004, 2005 ~ 2009, 2010 ~ 2014, 2015 ~ 2019, and 2020 ~ 2022), and calculated the area of change in vegetation NPP at each level. The overall results showed that the NPP in the YRB is gradually changing from a low level to a high-level year by year. However, it is necessary to further refine the time-scale study of NPP in the YRB in the future.
In the correlation analysis of NPP with climate factors, we compared the spatial and temporal variations of three factors, namely sunshine, precipitation, and temperature, with NPP. It was found that the correlation between temperature and NPP was closely related to altitude, especially in the Sichuan Basin, the Jianghan Basin, and northern Yunnan, which may be due to the insensitivity of the basin’s geographical location to temperature. Sunshine had a promoting effect on vegetation growth, which was most significant in the central part of the upper reaches and the southern part of the lower reaches, which was also studied by Wang Tinghui et al., and the same results were obtained51. The correlation between precipitation and NPP may also be related to altitude, which may be due to the fact that in areas with significant altitude changes, increased precipitation is difficult to maintain and cannot fully affect plant growth. Zhang Yuzhou et al. also reached a similar conclusion42. Therefore, how to integrate and analyze the various influencing factors will be one of the focuses of such research in the future.
In the study of NPP and TWS, the correlation between the two is first explored based on their variations in the YRB. Both precipitation and TWS are sources of water. The results showed that the proportions of positive correlation between precipitation, TWS, and vegetation NPP were about 51.57% and 71.14%, respectively, and this result was similar to that of Kong et al.52. However, from the line graph of the annual mean of TWS and NPP, it can be found that they are negatively correlated. We believe that precipitation promotes plant growth and absorbs TWS during plant growth, leading to a decrease in TWS in areas with increased vegetation NPP. To further analyze the effects of different moisture components on NPP, we calculated the correlation coefficients between SWS, SM, and GWS and the change in NPP. This study concluded that TWS, especially the GWS component, was continuously consumed during plant growth. There was a lag of almost one year in the promotion of plant growth by SM and SWS. Similar conclusions were also obtained by some scholars. For example, Donghai Wu and Anderson et al. also analyzed the results that the vegetative response lagged behind TWS53,54. However, the transformation of TWS is a complex process, and this may be related to the vegetation type and the degree of climatic aridity53,54, how much of the reduced TWS is absorbed by the vegetative NPP is a question that needs to be continuously researched, and explored, which is of great significance to hydrological and ecological studies. Through the correlation analysis, TWS was found to be one of the important factors affecting vegetation NPP in the YRB, and this conclusion needs to be supported by further research.
This study provides valuable insights for scholars to understand the transformation relationship between vegetation NPP and TWS in the YRB. If future research can solve the problems discussed in this article, it can greatly promote the development of the YRB.
Conclusions
This article explores the spatiotemporal variation characteristics of vegetation NPP and TWS in the YRB, as well as their interactions. The specific conclusion is:
The spatial distribution of NPP in the YRB is extremely uneven, showing significant differences. From the overall distribution, the NPP in the YRB is relatively small in the northwest region, and larger it is in the southeast; From a topographical perspective, it is mainly concentrated in low to medium altitude areas.
From 2000 to 2020, the overall NPP of the YRB showed an upward trend, with 87.72% of areas showing an upward trend in NPP, indicating significant improvement in the ecological environment of the YRB, which may be related to recent policies.
By comparing with climate factors, it was found that the trend of NPP in the YRB was similar to that of sunshine and air temperature, and opposite to that of precipitation. The positive correlation areas of NPP with sunshine, precipitation, and air temperature were 62.76%, 51.57%, and 78.33%, respectively.
The TWS in the YRB is showing an increasing trend year by year, with a positive correlation area of 71.14% with NPP. When TWS in the YRB increases, especially SWS and SM, after a lag period, it will greatly promote plant growth, leading to an increase in NPP, while plant growth continues to consume GWS.
Overall, when studying the mechanism of vegetation NPP changes in the YRB, the factor of TWS cannot be ignored, and policies related to vegetation management should be planned and implemented in conjunction with water management policies.
Electronic supplementary material
Below is the link to the electronic supplementary material.
Author contributions
K.T. designed the research; X.L., B.G., W.Z. and Z.W. researched and analyzed the data; N.C., P.L., B.Z. and B.H. wrote the paper. All authors have read and agreed to the published version of the manuscript.
Data availability
The data is provided in the manuscript.
Declarations
Competing interests
The authors declare no competing interests.
Footnotes
Publisher’s note
Springer Nature remains neutral with regard to jurisdictional claims in published maps and institutional affiliations.
References
- 1.Misra, R. Primary productivity of the biosphere. Agro-Ecosystems 5, 89–90 (1979). [Google Scholar]
- 2.Guo, B., Yang, F., Fan, Y. W. & Zang, W. Q. The dominant driving factors of rocky desertification and their variations in typical mountainous karst areas of Southwest China in the context of global change. Catena 220, 106674 (2023). [Google Scholar]
- 3.Bao, G. et al. Modeling net primary productivity of terrestrial ecosystems in the semi-arid climate of the Mongolian Plateau using LSWI-based CASA ecosystem model. Int. J. Appl. Earth Observ. Geoinf. 46, 84–93 (2016). [Google Scholar]
- 4.Zhang, Y., Wang, Q., Wang, Z., Yang, Y. & Li, J. Impact of human activities and climate change on the grassland dynamics under different regime policies in the Mongolian Plateau. Sci. Total Environ. 698, 134304 (2020). [DOI] [PubMed] [Google Scholar]
- 5.Ruimy, A., Saugie, B. & Dedieu, G. Methodology for the estimation of terrestrial net primary production from remotely sensed data. J. Geophys. Res. 99, 5263–5283 (1994). [Google Scholar]
- 6.Field, C. B., Behrenfeld, M. J., Randerson, J. T. & Falkowski, P. Primary production of the biosphere: integrating terrestrial and oceanic components. Science 281, 237–240 (1998). [DOI] [PubMed] [Google Scholar]
- 7.Cao, H. J. Estimation and Spatiotemporal Evolution of Net Primary Productivity of Vegetation in the Hexi Corridor Based on Random Forests. Master’s thesis, Northwest Normal University (2019).
- 8.Anderson, R. G. & Goulden, M. L. Relationships between climate, vegetation, and energy exchange across a montane gradient. J. Geophys. Res. 116, G01026 (2011). [Google Scholar]
- 9.Du, W. Temporal and Spatial Changes of Forest Biomass in China and Its Response to Climate Change. Master’s thesis, Nanjing Forestry University (2018).
- 10.Jin, K. Spatial and Temporal Changes in Vegetation Cover in China and Their Relationship with Climate and Human Activities. Ph.D. thesis, Northwest A&F University (2019).
- 11.Fang, J. et al. Increasing net primary production in China from 1982 to 1999. Ecol. Soc. Am. 1, 293–297 (2003). [Google Scholar]
- 12.Gang, C. et al. The impacts of land conversion and management measures on the grassland net primary productivity over the Loess Plateau, Northern China. Sci. Total Environ. 645, 827–836 (2018). [DOI] [PubMed] [Google Scholar]
- 13.Yuan, Z. H. et al. The impact of land use/cover change on vegetation coverage in the hunshandak sandy land. J. Soil. Water Conserv. 30, 330–338 (2016). [Google Scholar]
- 14.Sun, Y., Yang, Y., Zhang, Y. & Wang, Z. Assessing vegetation dynamics and their relationships with climatic variability in northern China. Phys. Chem. Earth 87-88, 79–86 (2015). [Google Scholar]
- 15.Zhou, G. & Zhang, X. A natural vegetation NPP model. Chin. J. Plant Ecol. 19, 193 (1995). [Google Scholar]
- 16.Chen, T. et al. Unraveling the relative impacts of climate change and human activities on grassland productivity in Central Asia over the last three decades. Sci. Total Environ. 743, 140649 (2020). [DOI] [PubMed] [Google Scholar]
- 17.Liu, C. et al. Analysis of net primary productivity variation and quantitative assessment of driving forces—A case study of the Yangtze River Basin. Plants 12, 3412 (2023). [DOI] [PMC free article] [PubMed] [Google Scholar]
- 18.Dong, S. Y. & Liu, W. W. Implementing the new development concept to assist in carbon peak and carbon neutrality. People’s Dly (2023).
- 19.Zhang, Y. Z., Gong, J., Yang, J. X. & Peng, J. Evaluation of future trends based on the characteristics of net primary production (NPP) changes over 21 years in the Yangtze River Basin in China. Sustainability 15, 10606 (2023). [Google Scholar]
- 20.Tang, X. Study on Spatio-temporal Characteristics and Prediction of NEP Index in Vegetation Ecosystem of Yangtze River Economic Belt. Master’s Thesis, Yangtze University (2023).
- 21.Zhou, J. Q. & Jiang, Y. Dynamics of cropland productivity in response to climate change in the middle and lower reaches of the Yangtze River from 2000 to 2020. Chin. J. Appl. Environ. Biol. 29, 1–14 (2023). [Google Scholar]
- 22.Tian, K. J. et al. Drought events over the Amazon River Basin (1993–2019) as detected by the climate-driven total water storage change. Remote Sens. 13, 1124 (2021). [Google Scholar]
- 23.Wang, Z. T. et al. Using swarm to detect total water storage changes in 26 global basins (taking the Amazon Basin, Volga Basin and Zambezi Basin as examples). Remote Sens. 13, 2659 (2021). [Google Scholar]
- 24.Xuan, J. H., Chen, Z. W., Zhang, X. F., Liang, C. H. & Wu, B. Combining GRACE and GRACE-FO to derive terrestrial water storage changes in the Yangtze River Basin from 2002 to 2020. J. Geodesy 41, 961–966 (2021). [Google Scholar]
- 25.Xu, Y., Zhu, Q., Wang, G. J. & Wang, Y. W. A comparative study on the spatial characteristics and drivers of net primary productivity of vegetation in watersheds of different climatic zones. Resour. Environ. Yangtze Basin 32, 2137–2146 (2023). [Google Scholar]
- 26.Chao, N. F. et al. Reconstructing a new terrestrial water storage deficit index to detect and quantify drought in the Yangtze River Basin. J. Hydrol. 625, 129972 (2023). [Google Scholar]
- 27.Xu, G. D. et al. How 2022 extreme drought influences the spatiotemporal variations of terrestrial water storage in the Yangtze River Catchment: insights from GRACE-based drought severity index and in-situ measurements. J. Hydrol. 626, 130245 (2023). [Google Scholar]
- 28.Xiong, J. H., Guo, S. L., Wang, J., Yin, J. B. & Li, N. Variation and attribution of terrestrial water storage in the Yangtze River Basin. Geomat. Inf. Sci. Wuhan Univ. 68, 1–11 (2023). [Google Scholar]
- 29.Li, X. Y., Ye, G. M., Cai, C. K. & Su, Z. W. Analysis and prediction of the anomaly water storage in the Yangtze River basin based on GRACE and MODIS. J. Yangtze River Sci. Res. Inst. 35, 130–135 (2018). [Google Scholar]
- 30.Kundzewicz, Z. W. et al. Flood risk and its reduction in China. Adv. Water Resour. 130, 37–45 (2019). [Google Scholar]
- 31.Wei, K. et al. Reflections on the catastrophic 2020 Yangtze River Basin flooding in southern China. Innovation 1, 100038 (2020). [DOI] [PMC free article] [PubMed] [Google Scholar]
- 32.Pan, Z. Z. et al. Exploring the historical and future spatial interaction relationship between urbanization and ecosystem services in the Yangtze River Basin, China. J. Clean. Prod. 428, 139401 (2023). [Google Scholar]
- 33.Yao, R. et al. Urbanization effects on vegetation and surface urban heat islands in China’s Yangtze River Basin. Remote Sens. 9, 540 (2017). [Google Scholar]
- 34.Sun, J. J. Characteristics and Driving Factors of Ecosystem Evolution in the Yangtze River Economic Belt in recent 30 Years. Master’s thesis, Donghua University (2022).
- 35.Jia, L. et al. Spatiotemporal pattern of NPP and its response to climatic factors in the Yangtze River economic belt. Ecol. Indic. 162, 112017 (2024). [Google Scholar]
- 36.Sun, Q. The Spatia-temporal Variation Patterns of Multiple Forest Ecosystem Services in the Yangtze River Basin During 2000–2020. Master’s thesis, Huazhong Agricultural University (2023).
- 37.Cheng, Q., Wan, J., Wang, Q. L., Chen, L. & Zhan, T. Characteristics of vegetation NPP and response to climate change in the Yangtze River Basin from 2000 to 2021. Ecol. Environ. Monit. Three Gorges 3, 1–16 (2024). [Google Scholar]
- 38.Shi, Z. J., Zhu, X. F. & Tang, Y. J. Changes and influencing factors of terrestrial water storage in China based on GRACE satellite data. Air Land Geogr. 46, 1397–1406 (2023). [Google Scholar]
- 39.Chu, J. D., Su, X. L., Wu, H. J., Liu, Y. H. & Feng, K. Analysis of the changes of terrestrial water reserves and their components in China from 2002 to 2021. Water Resour. Conserv. 39, 170–178 (2023). [Google Scholar]
- 40.Rodell, M. et al. Basin scale estimates of evapotranspiration using GRACE and other observations. Geophys. Res. Lett. 31, 20504 (2004). [Google Scholar]
- 41.Guan, Y. et al. Tracing anomalies in moisture recycling and transport to two record-breaking droughts over the Mid-to-lower reaches of the Yangtze River. J. Hydrol. 609, 127787 (2022). [Google Scholar]
- 42.Zhang, Y., Gong, J., Yang, J. & Peng, J. Evaluation of future trends based on the characteristics of net primary production (NPP) changes over 21 years in the Yangtze River Basin in China. Sustainability 15, 10606 (2023). [Google Scholar]
- 43.Liu, C. X. et al. Analysis of net primary productivity variation and quantitative assessment of driving forces—A case study of the Yangtze River Basin. Plants 12, 3412 (2023). [DOI] [PMC free article] [PubMed] [Google Scholar]
- 44.Xu, Y., Lu, Y. G., Zou, B., Xu, M. & Feng, Y. X. Unraveling the enigma of NPP variation in Chinese vegetation ecosystems: the interplay of climate change and land use change. Sci. Total Environ. 912, 169023 (2024). [DOI] [PubMed] [Google Scholar]
- 45.Xue, H. Z., Chen, Y. P., Dong, G. T. & Li, J. Y. Quantitative analysis of spatiotemporal changes and driving forces of vegetation net primary productivity (NPP) in the Qimeng region of Inner Mongolia. Ecol. Indic. 154, 110610 (2023). [Google Scholar]
- 46.Nie, C. et al. The spatio-temporal variations of GPP and its climatic driving factors in the Yangtze River Basin during 2000–2018. Forests 14, 1898 (2023). [Google Scholar]
- 47.Yuan, Z., Jiang, Q. Q. & Yin, J. Impact of climate change and land use change on ecosystem net primary productivity in the Yangtze River and Yellow River Source Region, China. Watershed Ecol. Environ. 5, 125–133 (2023). [Google Scholar]
- 48.Feng, X. K., Zhao, Z. Z., Ma, T. & Hu, B. X. A study of the effects of climate change and human activities on NPP of marsh wetland vegetation in the Yellow River source region between 2000 and 2020. Front. Ecol. Evol. 11, 1123645 (2023). [Google Scholar]
- 49.Jia, L. et al. Spatiotemporal pattern of landscape ecological risk in the Yangtze River Basin and its influence on NPP. Front. Glob. Change 6, 1335116 (2023). [Google Scholar]
- 50.Wang, S. C., Wei, G. E., Gao, M. M. & Fan, Y. M. Investigating the mechanism of urbanization on the net primary productivity of vegetation in the Yangtze River Economic Belt: a comprehensive analysis from global and local effects. Front. Ecol. Evol. 11, 1231487 (2023). [Google Scholar]
- 51.Wang, T. H., Gao, M. F., Fu, Q. & Chen, J. H. Spatiotemporal dynamics and influencing factors of vegetation net primary productivity in the Yangtze River Delta Region, China. Land 13, 440 (2024).
- 52.Kong, R. et al. Detection and attribution of changes in terrestrial water storage across China: climate change versus vegetation greening. Remote Sens. 15, 3104 (2023). [Google Scholar]
- 53.Wu, D. H. et al. Time-lag effects of global vegetation responses to climate change. Glob. Change Biol. 21, 3520–3531 (2015). [DOI] [PubMed] [Google Scholar]
- 54.Anderson, L. O. et al. Remote sensing detection of droughts in amazonian forest canopies. New Phytol. 187(3), 733–750 (2010). [DOI] [PubMed] [Google Scholar]
Associated Data
This section collects any data citations, data availability statements, or supplementary materials included in this article.
Supplementary Materials
Data Availability Statement
The data is provided in the manuscript.


