

Abstract
Radiographic landmark annotation determines patients’ anatomical parameters and influences diagnoses. However, challenges arise from ambiguous region-based definitions, human error, and image quality variations, potentially compromising patient care. Additionally, AI landmark localization often presents its predictions in a probability-based heatmap format, which lacks a corresponding clinical standard for accuracy validation. This Data Descriptor presents a clinical benchmark dataset for pelvic tilt landmarks, gathered through a probabilistic approach to measure annotation accuracy within clinical environments. A retrospective analysis of 115 pelvic sagittal radiographs was conducted for annotating pelvic tilt parameters by five annotators, revealing landmark cloud sizes of 6.04 mm-17.90 mm at a 95% dataset threshold, corresponding to 9.51°–16.55° maximum angular disagreement in clinical settings. The outcome provides a quantified point cloud dataset for each landmark corresponding to different probabilities, which enables assessment of directional annotation distribution and parameter-wise impact, providing clinical benchmarks. The data is readily reusable for AI studies analyzing the same landmarks, and the method can be easily replicated for establishing clinical accuracy benchmarks of other landmarks.
Subject terms: Bone, Bone imaging, Translational research
Background & Summary
Landmark annotation is commonly used in radiographs to evaluate skeletal concerns1,2. Accurate annotation is crucial for determining anatomical parameters and influencing diagnostic decisions3. Traditionally, patient-specific skeletal parameters were annotated on physical radiographs for personalized surgery2,4. With technological advancements, electronic radiographs have emerged as a reliable alternative to the manual ruler method, while providing image augmentation benefits such as zooming, contrast adjustment, and coordinate calculation5,6. Nonetheless, this process remains labor-intensive and prone to human error. Consequently, the adoption of artificial intelligence (AI) for automatic landmarking has gained popularity in recent years4,7,8.
Despite advancements, achieving consistent annotation remains challenging due to the ambiguity of region-based landmark definitions, human error, and variations in image quality, which may potentially result in substandard patient care2. Definitions of radiographic landmarks often lack a definitive “ground truth” point, and the selection of each landmark can influence the associated anatomical parameters, subsequently affecting surgical decisions and leading to non-uniform diagnoses9–11. Quantifying the regions of these landmarks is challenging due to ambiguities in their definition and variations in patient anatomies, radiographic qualities, and pixel sizes. Consequently, comparing landmarks between radiographs remains a difficult task12. On the other hand, developing an AI landmarking algorithm necessitates a “gold standard” training dataset, which itself is subject to landmark ambiguity and human error13. The incorporation of label noise into AI models is inevitable. Studies often report “precise” outcomes by comparing AI results to “gold standard” datasets obtained through manual image annotation12. However, such comparisons often overlook uncertainties in annotation and landmark ambiguities, attributing deviations from the gold standard solely to AI error, while the “gold standard” itself may contain errors originating from human annotation4. Consequently, studies often rely on parameter-based accuracy analyses, such as length or angle measurements between paired landmarks, calculated using the highest possible pixel values11,12,14. The accuracy of such analyses is often reported using statistical summaries such as mean absolute error (MAE) or Intraclass Correlation Coefficient (ICC)11,14–19. Therefore, human and AI accuracy are reported in different formats, making it challenging to compare them under the same framework. There is currently a lack of suitable methods to assess human error on a landmark-specific basis7,8.
Based on clinical standard, this Data Descriptor introduces a clinical benchmark dataset focused on pelvic tilt (PT) landmarks, which is routinely evaluated in hip and spine surgeries. The dataset was compiled through a probabilistic methodology, addressing the aforementioned challenges by presenting results in a probability distribution format. This approach mirrors AI techniques that commonly incorporate pseudo-probabilities to predict landmark locations and generate point-wise estimations7,8,11,20. By adopting a comparable strategy, this Data Descriptor establishes accuracy benchmarks for PT landmarks across various confidence thresholds within clinical contexts. The intent of this dataset is to validate alternative landmark annotation methods, including those rooted in AI technology21.
Methods
Imaging dataset
The imaging dataset used in this Data Descriptor was sourced from an ethically approved research database (2019/ETH09656, St Vincent’s Hospital Human Research Ethics Committee, Sydney, Australia) and is shared under a CC-BY license. To validate the proposed method’s feasibility, this retrospective study designed a streamlined example focusing on the measurement of the pelvic tilt parameter. We sourced a total of 115 consecutive sagittal radiographs (EOS Imaging, France) from our research database (ethics ID: 2019/ETH09656)22. The ethics committee approved the publication of the anonymizaed datasets in this study under CC-BY license. These images were collected from 93 unique patients (62 males and 31 females, with an average age of 64.6 ± 11.4 years) admitted between November 2020 and July 2021 awaiting their hip surgeries. All participating patients provided informed consent for the use of their de-identified data for research purposes. The DICOM images were converted to JPG format to remove all metadata. The files were then renamed in a randomized numerical order for each patient. In cases where a patient had more than one image, the date the image was taken was appended to the patient number in the filename.
Proposed probabilistic method
The proposed method of evaluating landmarking accuracy requires multiple observers to annotate a landmark. The centroid of the annotations (averaged location) from multiple annotators of a specific landmark will be considered as the “ground-truth” point. In order to ensure a consistent scale of annotation distributions, skeletal sizes between images needed to be assimilated. Therefore, an image-specific length parameter was used to scale the different images to a similar size. Next, the ground-truths from all radiographs were collected and superimposed to display all annotations on the same map. The annotation distribution at the orientation of interest (distribution vector) is then used to calculate the probability distribution and its parameter-wise impact.
Calculation of the probabilistic model
Firstly, an image-specific length parameter was proposed as the scaling factor η to standardize the skeletal size across different images and patients, as shown in Eq. (1)23:
| 1 |
where the ηi is the ratio between the standardized skeletal size and the current skeletal size Li of image i, and m is the total amount of images. The length parameter L is selected from a measurement that is identifiable across all images.
To visualize the distribution of landmarks for all images, the centroid of the scaled coordinates was superimposed. The coordinates of landmark j on image i, as annotated by annotator s, can be expressed as Eq. (2).
| 2 |
where n is the total number of annotators, and represent the original and centralized coordinates of landmark j on image i labeled by annotator s, respectively.
The 2D landmarks were subsequently transformed to a coordinate system that represents the orientation of interest θ, as illustrated in Fig. 1 (PTave in our case). The transformation can be expressed as Eq. (3).
| 3 |
where represents the transformed coordinate of the already scaled and centralized landmarks following the direction of interest θ. Similar to the concept of an heatmap in AI representing the confidence of a landmark, serves as the density vector of landmark ambiguity at different confidence levels.
Fig. 1.
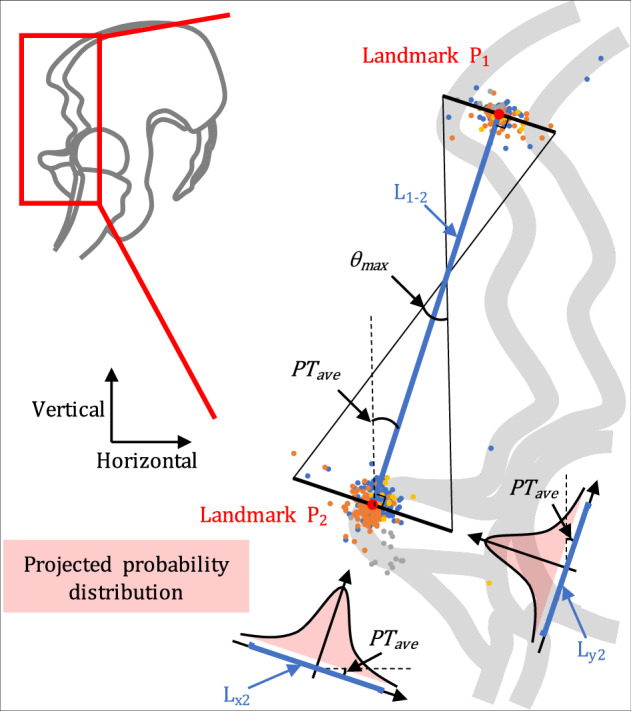
Diagram of calculating the coordinate of each landmark annotation. Using the pelvic tilt defined by Landmark 1 and Landmark 2 as an example, the average distance between the two landmarks is L1-2, and the average pelvic tilt is PTave. The projected error density in the red shadow is obtained by projecting the cloud point distribution of Landmark 2 to the orientation of PTave, and the probability distribution of Landmark 2 can be calculated from the density vector L2. Based on the probability distributions of landmarks, their maximum impact on the pelvic tilt parameter at a certain probability threshold can be calculated as θmax.
The landmark accuracy is calculated from the maximum impact of the point cloud diameter of k% data points from two landmark ends (P1 and P2), approximately equivalent to the impact on angles () and approximately equivalent to the impact on lengths (), as shown in Eq. (4).
| 4 |
where the k% is the percentage of landmarks that define the accuracy threshold, and denotes the maximum length and angular disagreement of the parameters within k% data points; corresponds to the average distance between the two landmarks (P1 and P2) that define the L and θ; and are the lengths of k% data points at the direction of interest (x/y) for point 1 and point 2, respectively, which are calculated from and .
Annotation dataset
Five independent annotators, including one senior surgeon (WW), two orthopedic fellows (JF and VM), and two orthopedic engineers (YC and MB), were equally trained to label the points that defined the PT using a custom-designed MATLAB GUI program24. Two different definitions of PT were used (Fig. 2): the anatomical pelvic tilt (PTa), defined by the anterior pelvic plane (APP), and the mechanical pelvic tilt (PTm), defined by the line connecting the midpoint of the sacral plate and the center of the two femoral heads25. Before annotating an image, it was zoomed in until the annotator was confident in their ability to view and label all the landmarks. Then, each of the landmarks were labeled by clicking on the corresponding locations.
Fig. 2.
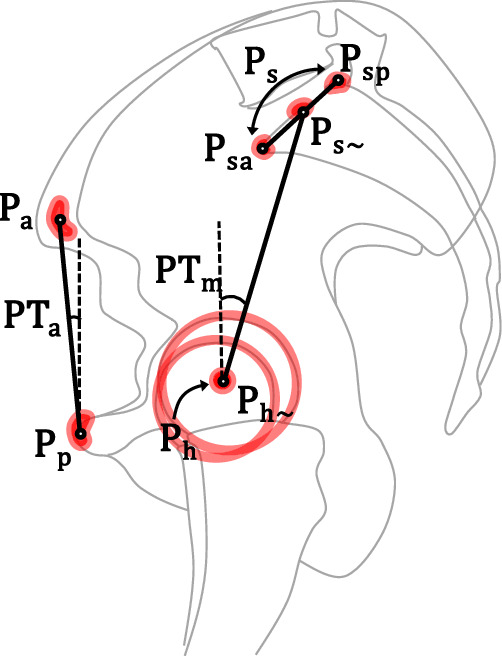
The pelvic tilt landmarks and parameters. PTm is the mechanical pelvic tilt defined by the vertical line and the line connecting the center of femoral heads and the midpoint of sacral plate. The two points defining the latter line can either be calculated from annotating the bone contours, with six points defining the two femoral head contours and calculating their center (Ph), and two points annotating the anterior (Psa) and posterior (Psp) ends of sacral plate and calculating its midpoint (Ps), or be estimated directly with one point for the center of femoral heads (Ph~) and one point for the midpoint of sacral plate (Ps~). PTa is the anatomical pelvic tilt defined by the anterior pelvic plane, which was annotated by one point for the pubic tubercles (Pp) and one point for the center of anterior superior iliac spines (Pa).
For the annotation of PTa, one point was labeled for the center of the anterior superior iliac spines (ASISs, labeled as Pa), and one point for the anterosuperior pubic tubercle (Pp). For the annotation of PTm, two methods of labeling were performed. The first, calculation method used six points on each image to define the round femoral head contours (three points each) in order to calculate the center of the femoral heads (Ph), as well as two points to define the anterior (Psa) and posterior (Psp) ends of the sacral plate to calculate the sacral plate midpoint (Ps). The second, estimation method (PTm~) used only two points, one to estimate the center of the femoral heads (Ph~), and one to estimate the midpoint of the sacral plate (Ps~). The annotators YC and MB repeated these two rounds of measurements for intra-annotator reproducibility, with at least a six-week interval24.
Benchmark dataset
In our dataset, two image-specific length parameters were selected to scale the anatomies of pelvis to a similar size. Thus, the Eq. (1) was modified to:
where Li and are the distances between Pa and Pp, Ph and Ps, respectively (Fig. 2).
According to Eq. 2 to Eq. 4, the coordinate of each landmark on each image was scaled, centralized, and transformed to the orientation at interest for their density distribution. In our dataset, the orientation at interest θ is PTave (Fig. 1). Thus, the distribution of in Eq. (3) represents the distribution vector of landmark ambiguity that impact the angular measurement at k% confidence level. They are provided as the benchmark dataset for the clinical accuracy benchmark of measuring PT.
The distributions of landmark clouds, both prior to transformation and after centralization, are visualized in Fig. 3. This visualization aids in identifying variations in landmark distributions (random errors) and annotator biases (systematic errors, e.g., Pp). For the measurement of PTm, the calculation method proved superior to the estimation method, and as such, it was chosen as the clinical benchmark accuracy for Ps and Ph landmarks. The diameters of the point clouds and their impact on PT parameters at different probability densities (50%, 75%, and 95%) are depicted in Fig. 4. Notably, at a 95% probability density, the cloud diameters for Ph, Ps, Pp, and Pa were 6.05 mm, 9.10 mm, 6.04 mm, and 17.90 mm, respectively. These measurements correspond to maximum angular disagreements of 16.55° for PTa and 9.51° for PTm24.
Fig. 3.

Scaled data point distribution of each landmark. Landmark labels refer to the diagram on the left-hand side.
Fig. 4.
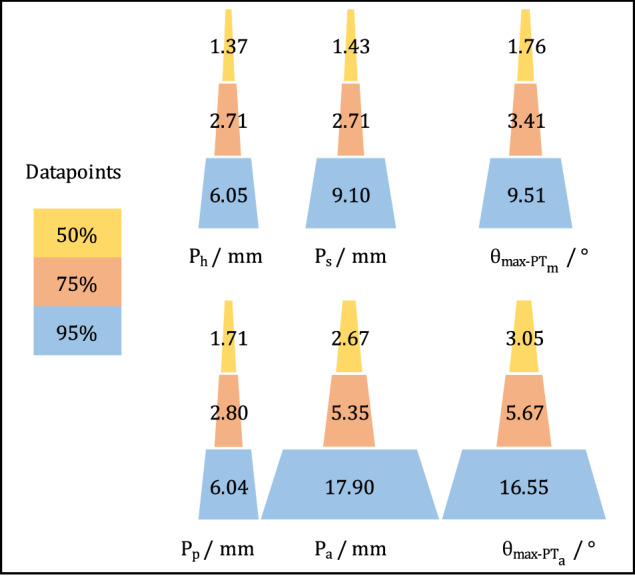
The cloud diameter of each landmark (calculation method) and its parameter-wise maximum impact at 50%, 75%, and 95% data points. Ph, Ps, Pp, and Pa stand for the point of femoral head center calculated by annotating six points, midpoint of sacral plate calculated from two points denoting its anterior and posterior ends, pubic tubercles, and the center of anterior superior iliac spines, respectively. θmax-PTm and θmax-PTa are the maximum angular impact at a certain probability threshold, which are caused by the pair of landmarks Ph-Ps and Pp-Pa that defines them.
Data Records
The dataset is available at figshare22,24, which comprises three distinct data records and a MATLAB code file that are published under CC-BY license:
Imaging Dataset: This consists of 115 de-identified lateral pelvic radiographs, stored in the *.jpg format22.
Annotation Dataset: This is a.csv file where the first column corresponds to the file names in the ‘Imaging dataset’. The remaining columns in each row represent the coordinates of the landmarks for the corresponding image file24.
Benchmark Dataset: This is a.csv data file that includes the maximum length and angular disagreement of the parameters at different data probability thresholds24.
MATLAB Code: This is a.m file that encapsulates all the codes utilized to record the coordinates of the landmark annotations24.
Additionally, comprehensive documentation and tutorials related to this Data Descriptor are accessible on our project website at https://landmarkaccuracy.com/.
Technical Validation
Measurements validation
The agreement of measurements was evaluated using the commonly employed ICC and MAE, and the results were compared with those from other studies. The MAE, along with inter- and intra-annotator ICCs, were computed using SPSS software (SPSS Inc., IBM)26, and the results are presented in Table 1. All parameters showcased excellent reliability, with ICCs exceeding 0.926.
Table 1.
The accuracy analysis using Intraclass Correlation Coefficient (ICC) and Mean Absolute Error (MAE) ± Standard Deviation (SD).
| Statistics | PTm | PTm~ | PTa |
|---|---|---|---|
| ICC inter-rater | 0.982 | 0.976 | 0.920 |
| ICC intra-rater 1 | 0.960 | 0.931 | 0.966 |
| ICC intra-rater 2 | 0.994 | 0.994 | 0.990 |
| MAE (°) | 0.74 ± 0.43 | 1.18 ± 0.51 | 1.26 ± 1.28 |
Consistent with previous studies17,27–30, our annotation data exhibited excellent reliability when measuring these radiographic landmarks (Table 1). The mean absolute angular disagreement, ranging from 1.11 ± 1.52° to 1.90 ± 2.41° for PT measurements provides a reference for standard clinical settings (Table 1), which is in line with the existing literature9,17,31,32.
Usage Notes
This database was conceived to set accuracy benchmarks for measuring PT in clinical settings, serving as a practical model for establishing accuracy benchmarks for other anatomical landmarks. We kindly request users to respect privacy guidelines and refrain from any attempts to re-identify patients, institutions, or hospitals involved.
For users developing benchmark datasets for other landmarks, it is essential to consider four key factors:
In situations where multiple clinical annotation methods exist for a single landmark, the method with the highest degree of accuracy should be chosen as the ultimate clinical accuracy benchmark. As demonstrated in our Data Descriptor, surgeons either identify anatomical contours to calculate the location (Ph and Ps), or directly estimate the landmark location (Ph~ and Ps~). In such scenarios, the method exhibiting greater precision (PTm, in this instance) ought to be acknowledged as the clinical standard of reference.
Aligning with the philosophy of the clinical environment, annotations deemed inadequate should not be intentionally excluded, as long as the data collection process aligns with clinical standards. For instance, in Fig. 3, the clusters of sacrum-related landmarks (Psa, Psp, Ps, Ps~) exhibit extreme outliers that follow a distinct pattern. Upon further investigation, these outliers were attributed to patients with sacralization or lumbarization of the fifth lumbar and sacrum, resulting in inaccurate identification of L5 and S1 landmarks. While the removal of these inaccuracies may improve data quality and potentially enhance AI training outcomes, these variables form part of the clinical decision-making process and should thus be retained when creating a clinical benchmark dataset.
The choice of the scaling factor η should prioritize length parameters that are as long as possible to minimize the influence of label noise. These parameters should also be relatively immune to anatomical variation and image quality and should ideally represent the scale of a skeleton in the best possible way.
The provided MATLAB code is designed exclusively for annotating pelvic tilt landmarks. However, it can be adapted to support other landmark annotation tasks. Alternatively, other coordinate documentation software can be used for this task.
For those using our dataset for AI training, we recommend splitting the training, validation, and testing subsets based on the patient number, which is the first part of the file name. This ensures that images from the same patient are not split across different subsets, preventing any bias that could arise from the model learning a patient’s anatomical features during training and then encountering those same features in the testing phase33,34.
Limitations
First, the “ground truth” location of landmarks remains subjective and susceptible to human error. While our methodology mitigates this error by involving five clinical annotators, and the results are comparable to existing studies, the annotators’ experience levels may vary significantly. Engaging more annotators with higher experience levels could potentially enhance the annotation results, but this would also demand substantial labor resources. Second, stereoradiographs were utilized in this Data Descriptor due to their consistent pixel sizing across various images35. While the measurement results align with current literature using conventional radiographs, it’s crucial to acknowledge that different imaging techniques might produce varying outcomes. Third, the MATLAB program employed in this Data Descriptor to simulate clinical practice for navigating coordinates and recording viewing information differs from the actual clinical setting that uses the Picture Archiving and Communication System (PACS). Fourth, the choice of length parameters as the scaling factor might be imprecise, especially for potential future studies focusing on smaller regions where the scaling factor could be more sensitive to label noise. Fifth, the relatively small sample size of our dataset is a potential limitation. While we focused on introducing the novel probabilistic method with minimal labor cost and encouraging future researchers to replicate this process for other landmarks, this dataset may not fully represent the broader anatomical diversity of the patient population. Last, while we suggest the potential for generalizing this method to other landmark analyses, additional evaluation of its applicability in different contexts is necessary.
Acknowledgements
We thank the professional consultations and landmark annotations from Dr. John Farey, and the clinical support from Lynette McDonald from the Royal North Shore Hospital, St. Leonards, NSW, Australia.
Author contributions
Yuan Chai: Conceptualization; Data curation; Formal analysis; Investigation; Methodology; Project administration; Resources; Software; Supervision; Validation; Visualization; Writing - original draft; Writing - review & editing. A. Mounir Boudali: Data curation; Formal analysis; Investigation; Software; Validation; Visualization; Writing - review & editing. Vincent Maes: Data curation; Writing - review & editing. William L. Walter: Data curation; Formal analysis; Funding acquisition; Investigation; Resources; Supervision; Validation; Writing - review & editing.
Code availability
The MATLAB code employed to capture all the annotation coordinates is included and is freely available for use and modification24. Any alternative software capable of recording coordinates can be utilized for this purpose.
Competing interests
The authors declare no competing interests.
Footnotes
Publisher’s note Springer Nature remains neutral with regard to jurisdictional claims in published maps and institutional affiliations.
References
- 1.Rischen, R. J., Breuning, K. H., Bronkhorst, E. M. & Kuijpers-Jagtman, A. M. Records needed for orthodontic diagnosis and treatment planning: a systematic review. PLoS one8, e74186 (2013). [DOI] [PMC free article] [PubMed] [Google Scholar]
- 2.Wang, C.-W. et al. Evaluation and comparison of anatomical landmark detection methods for cephalometric x-ray images: a grand challenge. IEEE transactions on medical imaging34, 1890–1900 (2015). [DOI] [PubMed] [Google Scholar]
- 3.Chai, Y., Boudali, A. M., Khadra, S. & Walter, W. L. The Sacro-femoral-pubic Angle Is Unreliable to Estimate Pelvic Tilt: A Meta-analysis. Clinical Orthopaedics and Related Research®, 10.1097 (2022). [DOI] [PMC free article] [PubMed]
- 4.Reyes, M. et al. On the interpretability of artificial intelligence in radiology: challenges and opportunities. Radiology: artificial intelligence2, e190043 (2020). [DOI] [PMC free article] [PubMed] [Google Scholar]
- 5.Patel, S. R., Toms, A. P., Rehman, J. M. & Wimhurst, J. A reliability study of measurement tools available on standard picture archiving and communication system workstations for the evaluation of hip radiographs following arthroplasty. JBJS93, 1712–1719 (2011). [DOI] [PubMed] [Google Scholar]
- 6.Segev, E. et al. Intra-and interobserver reliability analysis of digital radiographic measurements for pediatric orthopedic parameters using a novel PACS integrated computer software program. Journal of children’s orthopaedics4, 331–341 (2010). [DOI] [PMC free article] [PubMed] [Google Scholar]
- 7.Weng, C.-H. et al. Automatic recognition of whole-spine sagittal alignment and curvature analysis through a deep learning technique. European Spine Journal31, 2092–2103 (2022). [DOI] [PubMed] [Google Scholar]
- 8.Yeh, Y.-C. et al. Deep learning approach for automatic landmark detection and alignment analysis in whole-spine lateral radiographs. Scientific reports11, 1–15 (2021). [DOI] [PMC free article] [PubMed] [Google Scholar]
- 9.Eckman, K., Hafez, M. A., Jaramaz, B., Levison, T. J. & DiGioia, A. M. III Accuracy of pelvic flexion measurements from lateral radiographs. Clinical Orthopaedics and Related Research®451, 154–160 (2006). [DOI] [PubMed] [Google Scholar]
- 10.McClure, S. R., Sadowsky, P. L., Ferreira, A. & Jacobson, A. in Seminars in Orthodontics. 98–110 (Elsevier).
- 11.Zeng, M., Yan, Z., Liu, S., Zhou, Y. & Qiu, L. Cascaded convolutional networks for automatic cephalometric landmark detection. Medical Image Analysis68, 101904 (2021). [DOI] [PubMed] [Google Scholar]
- 12.Vrtovec, T. & Ibragimov, B. Spinopelvic measurements of sagittal balance with deep learning: systematic review and critical evaluation. European Spine Journal, 1–15 (2022). [DOI] [PubMed]
- 13.Chai, Y., Maes, V., Boudali, A. M., Rackel, B. & Walter, W. L. Inadequate Annotation and Its Impact on Pelvic Tilt Measurement in Clinical Practice. Journal of Clinical Medicine13, 1394 (2024). [DOI] [PMC free article] [PubMed] [Google Scholar]
- 14.Payer, C., Štern, D., Bischof, H. & Urschler, M. Integrating spatial configuration into heatmap regression based CNNs for landmark localization. Medical image analysis54, 207–219 (2019). [DOI] [PubMed] [Google Scholar]
- 15.Mast, N. H., Impellizzeri, F., Keller, S. & Leunig, M. Reliability and agreement of measures used in radiographic evaluation of the adult hip. Clinical Orthopaedics and Related Research®469, 188–199 (2011). [DOI] [PMC free article] [PubMed] [Google Scholar]
- 16.Kyrölä, K. K. et al. Intra-and interrater reliability of sagittal spinopelvic parameters on full-spine radiographs in adults with symptomatic spinal disorders. Neurospine15, 175 (2018). [DOI] [PMC free article] [PubMed] [Google Scholar]
- 17.Berthonnaud, E. et al. A variability study of computerized sagittal spinopelvic radiologic measurements of trunk balance. Clinical Spine Surgery18, 66–71 (2005). [DOI] [PubMed] [Google Scholar]
- 18.Lin, A. et al. Deep learning-enabled coronary CT angiography for plaque and stenosis quantification and cardiac risk prediction: an international multicentre study. The Lancet Digital Health4, e256–e265 (2022). [DOI] [PMC free article] [PubMed] [Google Scholar]
- 19.Veilleux, N. J., Kalore, N. V., Vossen, J. A. & Wayne, J. S. Automatic characterization of pelvic and sacral measures from 200 subjects. JBJS102, e130 (2020). [DOI] [PubMed] [Google Scholar]
- 20.Tompson, J. J., Jain, A., LeCun, Y. & Bregler, C. Joint training of a convolutional network and a graphical model for human pose estimation. Advances in neural information processing systems27 (2014).
- 21.Tannast, M., Fritsch, S., Zheng, G., Siebenrock, K. A. & Steppacher, S. D. Which radiographic hip parameters do not have to be corrected for pelvic rotation and tilt? Clinical Orthopaedics and Related Research®473, 1255–1266 (2015). [DOI] [PMC free article] [PubMed] [Google Scholar]
- 22.Chai, Y. Sagittal Pelvic Radiographs: A Dataset for Clinical Quantification of Radiographic Annotation Accuracy. figshare. Figure.10.6084/m9.figshare.23820879.v1 (2023).
- 23.Cina, A. et al. 2-step deep learning model for landmarks localization in spine radiographs. Scientific Reports11, 1–12 (2021). [DOI] [PMC free article] [PubMed] [Google Scholar]
- 24.Chai, Y. Data records for Clinical Quantification of Radiographic Annotation Accuracy. figshare. Dataset.10.6084/m9.figshare.23831553.v1 (2023).
- 25.Chai, Y., Boudali, A. M. & Walter, W. L. Correlations Analysis of Different Pelvic Tilt Definitions: A Preliminary Study. HSS Journal®19, 187–192 (2023). [DOI] [PMC free article] [PubMed] [Google Scholar]
- 26.Koo, T. K. & Li, M. Y. A guideline of selecting and reporting intraclass correlation coefficients for reliability research. Journal of chiropractic medicine15, 155–163 (2016). [DOI] [PMC free article] [PubMed] [Google Scholar]
- 27.Bjarnason, J., Pripp, A. & Reikeras, O. Reliability of measures used in radiographic evaluation of the adult hip. Skeletal Radiology44, 935–939 (2015). [DOI] [PubMed] [Google Scholar]
- 28.Kutty, S. et al. Reliability and predictability of the centre-edge angle in the assessment of pincer femoroacetabular impingement. International orthopaedics36, 505–510 (2012). [DOI] [PMC free article] [PubMed] [Google Scholar]
- 29.Tyrakowski, M., Yu, H. & Siemionow, K. Pelvic incidence and pelvic tilt measurements using femoral heads or acetabular domes to identify centers of the hips: comparison of two methods. European Spine Journal24, 1259–1264 (2015). [DOI] [PubMed] [Google Scholar]
- 30.Ilharreborde, B. et al. Angle measurement reproducibility using EOSthree-dimensional reconstructions in adolescent idiopathic scoliosis treated by posterior instrumentation. Spine36, E1306–E1313 (2011). [DOI] [PubMed] [Google Scholar]
- 31.Gille, O., Champain, N., Benchikh-El-Fegoun, A., Vital, J.-M. & Skalli, W. Reliability of 3D reconstruction of the spine of mild scoliotic patients. Spine32, 568–573 (2007). [DOI] [PubMed] [Google Scholar]
- 32.Imai, N., Ito, T., Suda, K., Miyasaka, D. & Endo, N. Pelvic flexion measurement from lateral projection radiographs is clinically reliable. Clinical Orthopaedics and Related Research®471, 1271–1276 (2013). [DOI] [PMC free article] [PubMed] [Google Scholar]
- 33.Chai, Y. Letter to the Editor Regarding the Article “Comparison of Transfer Learning Models in Pelvic Tilt and Rotation Measurement in Pediatric Anteroposterior Pelvic Radiographs”. Journal of Imaging Informatics in Medicine, 1–2 (2024). [DOI] [PMC free article] [PubMed]
- 34.Chai, Y. et al. Evaluating Pelvic Tilt Using the Pelvic Antero-posterior Projection Images-A Systematic Review. The Journal of Arthroplasty (2023). [DOI] [PubMed]
- 35.Chai, Y., Boudali, A. M., Jenkins, E., Maes, V. & Walter, W. L. Advances in Imaging for Pre-Surgical Planning in Hip Resurfacing Arthroplasty. Orthopaedics & Traumatology: Surgery & Research, 103908 (2024). [DOI] [PubMed]
Associated Data
This section collects any data citations, data availability statements, or supplementary materials included in this article.
Data Citations
- Chai, Y. Sagittal Pelvic Radiographs: A Dataset for Clinical Quantification of Radiographic Annotation Accuracy. figshare. Figure.10.6084/m9.figshare.23820879.v1 (2023).
- Chai, Y. Data records for Clinical Quantification of Radiographic Annotation Accuracy. figshare. Dataset.10.6084/m9.figshare.23831553.v1 (2023).
Data Availability Statement
The MATLAB code employed to capture all the annotation coordinates is included and is freely available for use and modification24. Any alternative software capable of recording coordinates can be utilized for this purpose.