

Abstract
INTRODUCTION
This study aimed to explore the potential of whole brain white matter patterns as novel neuroimaging biomarkers for assessing cognitive impairment and disability in older adults.
METHODS
We conducted an in‐depth analysis of magnetic resonance imaging (MRI) and amyloid positron emission tomography (PET) scans in 454 participants, focusing on white matter patterns and white matter inter‐subject variability (WM‐ISV).
RESULTS
The white matter pattern ensemble model, combining MRI and amyloid PET, demonstrated a significantly higher classification performance for cognitive impairment and disability. Participants with Alzheimer's disease (AD) exhibited higher WM‐ISV than participants with subjective cognitive decline, mild cognitive impairment, and vascular dementia. Furthermore, WM‐ISV correlated significantly with blood‐based biomarkers (such as glial fibrillary acidic protein and phosphorylated tau‐217 [p‐tau217]), and cognitive function and disability scores.
DISCUSSION
Our results suggest that white matter pattern analysis has significant potential as an adjunct neuroimaging biomarker for clinical decision‐making and determining cognitive impairment and disability.
Highlights
The ensemble model combined both magnetic resonance imaging (MRI) and amyloid positron emission tomography (PET) and demonstrated a significantly higher classification performance for cognitive impairment and disability.
Alzheimer's disease (AD) revealed a notably higher heterogeneity compared to that in subjective cognitive decline, mild cognitive impairment, or vascular dementia.
White matter inter‐subject variability (WM‐ISV) was significantly correlated with blood‐based biomarkers (glial fibrillary acidic protein and phosphorylated tau‐217 [p‐tau217]) and with the polygenic risk score for AD.
White matter pattern analysis has significant potential as an adjunct neuroimaging biomarker for clinical decision‐making processes and determining cognitive impairment and disability.
Keywords: cognitive impairment, functional disability, MRI and PET imaging, neurodegeneration, white matter pattern
1. BACKGROUND
Neurodegenerative disorders are characterized by the pathological deposition of proteins, such as amyloid, tau, alpha‐synuclein, and transactive response DNA‐binding protein 43 (TDP‐43), in the brain. 1 This accumulation leads to functional and structural abnormalities in the neurons and glial cells of certain brain regions and causes neurodegenerative disorders such as Alzheimer's disease (AD), vascular cognitive impairment, Lewy body dementia, and frontotemporal lobar degeneration. 2 These conditions are common causes of cognitive impairment, disability, and dementia in older adults. Mild cognitive impairment (MCI) could be diagnosed if cognitive impairment was evident without a clear disability. 3 When cognitive decline is paired with significant daily life disability, the condition is classified as dementia. 4 The clinical picture is often enriched with results of brain imaging, such as amyloid positron emission tomography (PET) and magnetic resonance imaging (MRI), in conjunction with biomarker findings in the blood and cerebrospinal fluid, such as amyloid beta protein and phosphorylated tau‐181 (p‐tau181) or 217. 5 , 6 This comprehensive approach allows a more precise estimation of the underlying pathology in clinical cases of MCI or dementia. 7
The diagnostic processes for dementia present clinical challenges. First, in the cognitive assessment phase, screening tests designed for preliminary evaluations often lack sufficient validity and reliability. 8 , 9 In contrast, detailed neuropsychological assessments, which provide a more comprehensive picture, are expensive and can take almost 2 h, rendering them less feasible for older individuals. 10 , 11 Hence, supplementary information that can guide decisions in conducting a comprehensive cognitive assessment is of great clinical value. Second, determining the level of independence in performing daily functions among older adults is a complex matter. 12 , 13 Comprehensive dementia cohort studies allocate ≈45 min to 1 h to determine the independent daily functioning of each study participant using the Clinical Dementia Rating (CDR) scale. 14 In addition, a 30‐min interview focusing on instrumental activities of daily living (IADLs) further verifies individual independence. 15 , 16 However, such thorough evaluations are challenging to implement in typical clinical settings, owing to the time and cost constraints. Moreover, this difficulty is compounded in the case of older adults living alone, senior couples without children, or when reliable caregivers are unavailable. 17 , 18 Therefore, additional data or tools that can assist or provide supplementary insights into the ability of the patient to live independently are valuable for clinical assessments.
Recent advances in neuroimaging and reduced testing costs have led to an increased use of brain MRI and amyloid PET for the diagnosis of neurodegenerative diseases. 19 , 20 However, white matter signal changes identified on MRI or amyloid PET scans associated with conditions like small vessel disease, neuroinflammation, and hypoperfusion, as well as symptoms including cognitive decline, depression, and disability, have received less attention in research. 21 , 22 , 23 Furthermore, emerging evidence points to the heterogeneity of white matter pathologies. 24 To our knowledge, no previous studies have explored the clinical utility of incorporating signals from the white matter in both brain MRI and amyloid PET.
This study aimed to determine whether whole brain white matter patterns, potentially indicative of a heterogeneous pathology including cerebrovascular and inflammatory burdens, can predict cognitive impairment or functional disability in older adults. We analyzed white matter patterns in each participant across 360 cortical gray matter regions, defined by cortical connections identified in our previous research. By employing T2‐MRI, amyloid PET, and ensemble imaging, we evaluated their predictive accuracy for cognitive decline and disability. Finally, we examined how the heterogeneity of whole brain white matter patterns varies according to clinical diagnoses and assessed their potential association with blood‐based biomarkers and clinical characteristics, thereby providing a supplementary perspective that enhances diagnostic insights and deepens our understanding of patient pathophysiology in a clinical setting.
2. METHODS
2.1. Participants
This study is a part of the ongoing Biobank Innovations for Chronic Cerebrovascular Disease With ALZheimer's Disease Study (BICWALZS). 25 Initiated in October 2016 by the Korea Disease Control and Prevention Agency, BICWALZS falls under the umbrella of the Korea Biobank Project, a national effort that is designed to enhance the foundation of biomedical and health‐related research. For our study, we collaborated with memory clinics from five university‐affiliated hospitals and a community‐centered geriatric mental health center. The individuals who visited specialized neurology or psychiatric outpatient memory clinics and volunteered to participate in our study were designated as the study participants. The main goal of this initiative was to foster, supervise, and optimize the use of human biological samples in research by leveraging real‐world data, particularly focusing on subjective cognitive decline (SCD), MCI, AD, and vascular dementia (VaD). Comprehensive evaluations were conducted for each participant, including clinical reviews, blood tests, and an extensive neuropsychological test suite. A selected group of participants underwent brain MRI and 18F‐flutemetamol amyloid PET scans.
For this study, we applied the following inclusion criteria: (1) completion of a clinical interview; (2) completion of neuropsychological tests; (3) consent to undergo brain MRI scans, with data of sufficient quality for further analysis; and (4) consent to undergo amyloid PET scans, with data of sufficient quality for further analysis. The exclusion criteria were: (1) significant hearing or visual impairments affecting interview participation; (2) potential behavioral‐variant frontotemporal lobar degeneration or Lewy body dementia; (3) a history of neurological disorders, such as brain tumors, subarachnoid hemorrhage, epilepsy, encephalitis, or metabolic encephalopathy; (4) psychiatric disorders, including mental retardation, schizophrenia, bipolar disorder, or other psychiatric conditions; (5) use of psychoactive substances other than alcohol; and (6) physical illnesses, such as cancer, renal or hepatic failure, severe asthma, or chronic obstructive pulmonary disease, which could interfere with participation in the study.
The BICWALZS trial was recorded in the Korean National Clinical Trial Registry under the Clinical Research Information Service (identifier: KCT0003391). All the participants and their caregivers provided written informed consent for participation in this study. This study was approved by the institutional review board of the Korea Brain Research Institute (IRB number: KBRI‐202206‐BR‐0001). A more detailed description of BICWALZS was published previously. 25
RESEARCH IN CONTEXT
Systematic review: The authors reviewed the available scientific literature and cited relevant publications related to white matter abnormalities in Alzheimer's disease (AD) and blood‐based biomarkers for AD.
Interpretation: We demonstrated that white matter patterns across AD participants were different from those in the other groups and were associated with changes in blood‐based biomarkers, polygenic risk scores, cognitive function, and disability. Our results suggest the importance of white matter patterns in diagnosing cognitive impairment and functional disability.
Future directions: Further validation through longitudinal data analysis is necessary to determine whether the white matter inter‐subject variability (WM‐ISV) can predict the progression of cognitive impairment or disability.
2.2. Clinical diagnosis, cognitive function, and disability assessment
The clinical diagnosis of the study participants was conducted as follows. The criteria for SCD encompassed reports of cognitive decline from either the individual or informant, with no detectable impairments in the objective cognitive tests or daily activities. MCI assessment was based on the expanded criteria set forth by the Mayo Clinic. 26 Participants diagnosed with AD were aligned with the foundational clinical criteria proposed by the National Institute on Aging in collaboration with the Alzheimer's Association in 2011. 27 Finally, the patients with VaD were assessed according to the major vascular neurocognitive disorder criteria highlighted in the fifth edition of the Diagnostic and Statistical Manual of Mental Disorders (DSM‐5). 28 The cognitive function was assessed using a standardized neuropsychological test battery called the Seoul Neuropsychological Screening Battery. 29 This battery encompasses tests of general cognitive function and several cognitive domain capacities. The general cognitive function was assessed using the Mini‐Mental State Examination (MMSE). The verbal memory function was evaluated using the delayed recall scores from the Seoul Verbal Learning Test. For visuospatial memory, the delayed recall scores were assessed using the Rey Complex Figure Test. The depressive symptoms and disability were assessed using the Korean Short‐Form Geriatric Depression Scale and Seoul Instrumental Activities of Daily Living, respectively.
2.3. Amyloid PET and MRI data acquisition
The participants underwent PET/computerized tomography (CT) scans at multiple facilities, following a similar protocol. The participants received an injection of 18F‐flutemetamol into the antecubital vein at an average dose of 185 MBq. After a 90‐min interval, a 20‐min PET scan was conducted. The 18F‐flutemetamol PET scans were aligned with the individual MRI scans and subsequently adjusted to a T1‐weighted MRI template. The amyloid positivity of the participants was evaluated using a visual rating by experienced nuclear medicine specialists who were blinded to the clinical information of the participants. To compare amyloid deposition between participants classified as positive and negative based on visual ratings, we used the standardized uptake value ratio based on the pons region; a distinct difference was observed between the two groups (two‐sample t‐tests, p < 0.0001, Figure S1). This difference was also evident when using the Centiloid method with the whole cerebellum as the reference 30 (two‐sample t‐tests, p < 0.0001). The data from the MRI scans were collected using a 3.0T MRI scanner. The scans encompassed structural MRI techniques such as three‐dimensional (3D) T1, T2, and T2 fluid‐attenuated inversion recovery (FLAIR) imaging.
2.4. Data processing
In this study, we reanalyzed the T1‐weighted MRI, T2‐FLAIR, and amyloid PET data of 454 participants from the BICWALZS database. 25 Detailed information about the participants is presented in Table 1. We segmented the T1‐weighted MRI image of each individual into gray matter, white matter, and cerebral blood flow in the individual space using the DARTEL toolbox in SPM12 (https://www.fil.ion.ucl.ac.uk/spm/software/spm12/). 31 The inverse non‐linear transformation derived from individual T1‐weighted MRI to the ICBM (International Consortium for Brain Mapping) template was applied to the white matter population connection label map (pCLM) 32 to construct an individual pCLM. T2‐FLAIR and amyloid PET images were co‐registered to the T1‐weighted MRI images. We generated an ensemble image by multiplying signals from T2‐FLAIR and amyloid PET to reflect white matter hyperintensities and the accumulation of amyloid beta within the white matter. To extract white matter patterns, T2‐FLAIR, amyloid PET, and ensemble images were overlapped with the individual pCLM.
TABLE 1.
Demographic characteristics of the participants according to clinical diagnosis.
| Stratification by clinical diagnosis | |||||||
|---|---|---|---|---|---|---|---|
| All participants (n = 454) | SCD (n = 49) | MCI (n = 259) | AD (n = 103) | VaD (n = 43) | p‐value a | Post‐hoc b | |
| Variables c | |||||||
| Age, median (IQR), years | 73 (68, 78) | 69 (63, 73) | 73 (67, 78) | 76 (70, 80) | 75 (69, 79) | <0.001 | a, b, c |
| Females, no. (%) | 318 (70.0) | 38 (77.6) | 190 (73.4) | 64 (62.1) | 26 (60.5) | 0.054 | ‐ |
| Education, median (IQR), years | 7 (6, 12) | 9 (6, 12) | 6 (6, 12) | 9 (6, 12) | 6 (6, 9) | 0.117 | ‐ |
| Body mass index, median (IQR) | 23.7 (21.7, 25.7) | 24.5 (21.8, 26.0) | 24.0 (22.1, 25.9) | 22.8 (20.8, 24.7) | 23.9 (21.6, 26.2) | 0.007 | D |
| Comorbidity, no. (%) | |||||||
| Diabetes | 109 (24.0) | 12 (24.5) | 54 (20.8) | 23 (22.3) | 20 (46.5) | 0.004 | e, f |
| Hypertension | 254 (55.9) | 26 (53.1) | 133 (51.4) | 66 (64.1) | 29 (67.4) | 0.059 | ‐ |
| SGDS, median (IQR) | 5 (2, 11) | 3 (1, 7) | 6 (2, 12) | 4 (1, 9) | 8 (2, 13) | 0.004 | A |
| APOE genotype, no. (%) | |||||||
| ε4 allele carrier | 138 (30.2) | 7 (14.3) | 63 (24.3) | 55 (53.4) | 12 (27.9) | <0.001 | b, d, f |
| Clinical characteristics d | |||||||
| General cognition, median (IQR) | −1.37 (−2.71, −0.23) | 0.14 (−0.71, 0.70) | −0.91 (−2.12, −0.01) | −3.45 (−5.10, −2.22) | −3.22 (−5.03, −1.66) | <0.001 | a, b, c, d, e |
| Verbal memory, median (IQR) | −1.32 (−2.09, −0.33) | 0.11 (−0.54, 0.34) | −0.99 (−1.86, −0.22) | −2.09 (−2.52, −1.65) | −1.76 (−2.09, −0.99) | <0.001 | a, b, c, d, e |
| Visuospatial memory, median (IQR) | −0.93 (−1.71, −0.04) | 0.05 (−0.50, 0.86) | −0.70 (−1.40, 0.08) | −1.91 (−2.24, −1.43) | −1.43 (−1.78, −0.78) | <0.001 | a, b, c, d, e, f |
| Disability, median (IQR) | 5 (2, 12) | 2 (1, 4) | 4 (1.5, 7) | 14 (8, 20) | 18 (11, 24.5) | <0.001 | b, c, d, e |
| Biomarker characteristics | |||||||
| GFAP, median (IQR) | 162 (113, 225) | 125 (91, 163) | 145 (101, 201) | 229 (186, 306) | 139 (107, 208) | <0.001 | b, d, f |
| NfL, median (IQR) | 30.4 (21.4, 44.5) | 21.2 (15.3, 29.8) | 28.6 (20.5, 39.0) | 37.2 (27.8, 57.7) | 35.3 (27.2, 52.3) | <0.001 | a, b, c, d |
| p‐tau217, median (IQR) | 0.26 (0.16, 0.60) | 0.19 (0.14, 0.27) | 0.23 (0.15, 0.46) | 0.68 (0.39, 1.07) | 0.21 (0.14, 0.33) | <0.001 | b, d, f |
| Polygenic risk score for AD, median (IQR) | 0.023 (0.002, 0.051) | 0.010 (−0.009, 0.024) | 0.017 (−0.001, 0.039) | 0.055 (0.034, 0.071) | 0.013 (−0.006, 0.036) | <0.001 | b, d, f |
Abbreviations: AD, Alzheimer's disease; APOE, apolipoprotein E gene; GFAP, glial fibrillary acidic protein; IQR, interquartile range; MCI, mild cognitive impairment; NfL, neurofilament light; SCD, subjective cognitive decline; SGDS, Short‐form Geriatric Depression Scale; VaD vascular dementia.
Analysis of variance was used for normally‐distributed continuous variables, the Kruskal‐Wallis test was used for continuous variables that are not normally distributed, and the chi‐square test was used for categorical variables.
Post‐hoc analysis employed Dunn's test for continuous variables and chi‐square test for categorical variables, utilizing Bonferroni's adjustment to manage multiple comparisons: statistically significant difference between (a) SCD and MCI; (b) SCD and AD; (c) SCD and VaD; (d) MCI and AD; (e) MCI and VaD; and (f) AD and VaD.
The numbers of participants for each variable: education (n = 453), body mass index (n = 453), general cognition (n = 452), verbal memory (n = 450), visuospatial memory (n = 443), plasma GFAP (n = 398), plasma NfL (n = 398), plasma p‐tau217 (n = 372), polygenic risk score for AD (n = 452), and unspecified variables (n = 454).
General cognition, verbal memory, visuospatial memory, and disability were assessed using the Mini‐Mental Status Examination, Seoul Verbal Learning Test ‐ delayed recall, Rey Complex Figure Test ‐ delayed recall score, and Seoul instrumental activity of daily living assessments, respectively. General cognition, verbal memory, and visuospatial memory scores are represented as age‐, sex‐, and education‐adjusted z‐scores based on standardized normative data.
2.5. Multimodal classification
We extracted the white matter patterns of each participant from the T2‐FLAIR, amyloid PET, and ensemble images by averaging the intensity of the 360 cortical connection labels in the white matter (1 model × 360 regions). Using the extracted white matter patterns, we conducted binary classification using a support vector machine (SVM) for pairwise comparison. A linear classifier (hyperparameter C = 1) was trained using the training white matter patterns, and the testing patterns were tested. The leave‐one‐subject‐out cross‐validation method was applied to determine the mean classification accuracy. 33 , 34 , 35 For the statistical comparison of the classification accuracy, we conducted one‐way analysis of variance (ANOVA) and paired Student's t‐tests, using Bonferroni correction for three tests across the models (adjusted p‐value = 0.0167()). All procedures are summarized in Figure 1.
FIGURE 1.
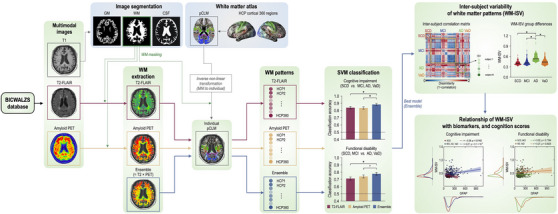
An analysis pipeline for cognitive impairment and functional disability prediction using whole brain white matter patterns. AD, Alzheimer's disease; CSF, cerebrospinal fluid; GM, gray matter; HCP, Human Connectome Project; MCI, mild cognitive impairment; pCLM, connection label map; PET, positron emission tomography; SCD, subjective cognitive decline; T2‐FLAIR, T2‐weighted fluid‐attenuated inversion recovery; VaD, vascular dementia; WM, white matter.
2.6. Inter‐subject variability of white matter patterns
To test the white matter inter‐subject variability (WM‐ISV) across the participants in the SCD, MCI, AD, and VaD groups, we constructed a representational geometry of white matter patterns by calculating the pairwise dissimilarity of white matter patterns using the correlation distance in each group. 36
For each participant, the averaged intensities were calculated in the Human Connectome Project (HCP) regions of interest (ROIs). The white matter patterns correspond to the average intensities . For the pairwise dissimilarity of the white matter patterns, the correlation distance was defined as follows:
The WM‐ISV of each participant was calculated by averaging the correlation distance of that participant to that of the other participants within the same group. To statistically evaluate the group differences in the ISV, we conducted a one‐way ANOVA. We then conducted two‐sample Student's t‐tests as post‐hoc tests to evaluate group differences. For multiple testing, Bonferroni correction was employed by simply dividing α by the number of tests (adjusted p‐value = 0.0083).
2.7. Statistical analysis of WM‐ISV with blood‐based biomarkers, polygenic risk score (PRS), cognitive function, and disability
Recently, several blood‐based biomarkers have been proposed for studying AD and other neurodegenerative brain disorders. 37 Among them, biomarkers such as p‐tau‐217, which reflects the extent of phosphorylated tau pathology; glial fibrillary acidic protein (GFAP), which is indicative of non‐specific inflammatory tissue reactions; and neurofilament light chain (NfL), which represents the degree of neural damage, have been validated through extensive research. 38 To measure the blood‐based biomarkers, we used an ultrasensitive immunoassay technology called a single molecular array (Simoa Assay), which allows the detection of proteins at the lowest possible levels. We also assessed the polygenic risk score (PRS) for amyloid positivity using our data set. Finally, we analyzed the possible associations between the blood‐based biomarkers and PRSs with WM‐ISV. The values for GFAP, NfL, and harmonized p‐tau217 were obtained. The AD‐related PRS was also obtained as a polygenic risk score. The associations of the WM‐ISV with the blood‐based biomarkers and PRSs were analyzed using correlation analysis. To test the association between the WM‐ISV, cognitive function, and disability, we conducted a correlation analysis of the WM‐ISV with the general cognition, verbal memory, visuospatial memory, and IADL scores. Finally, to examine whether the association between the WM‐ISV, biomarkers, and clinical characteristics persisted even when potential covariates were considered, we performed a generalized linear model analysis and measured the effect size of the WM‐ISV using partial eta squared.
3. RESULTS
3.1. General characteristics of the study participants
The general characteristics of the 454 study participants are presented in Table 1, according to their clinical diagnoses. In brief, 70% of participants were female, and the median age was 73 years. Statistically significant differences in demographic and biomarker characteristics were noted across various neurodegenerative disease stages. Participants with SCD were younger than those diagnosed with MCI, AD, or VaD, without significant sex distribution variations across these diagnoses. Moreover, participants diagnosed with AD had a higher prevalence of apolipoprotein E (APOE) ε4 allele carriers than participants with the other three diagnoses, and participants with VaD had a higher incidence of diabetes than participants with AD or MCI. The cognitive and disability measures—including general cognition, verbal and visuospatial memory, and disability scores—indicated a pattern of decline moving from SCD through MCI, AD, and VaD. The blood‐based neuronal injury biomarker, NfL, showed a gradual increase from SCD to MCI, AD, and VaD. The blood‐based inflammatory biomarker GFAP and tau biomarker p‐tau217 exhibited the highest levels in the patients with AD. In summary, upon assessing the overall demographics, genetic information, biomarker characteristics, and cognitive function, we determined that the characteristics of the study participants according to their clinical diagnoses were highly valid.
3.2. Multi‐modal classification results
Figure 2 shows the classification accuracy of cognitive impairment and functional disability in the patients with neurodegenerative disorders. Statistical model differences were observed in the classification of cognitive impairment (one‐way ANOVA: F (1, 2) = 6.4; p = 0.0017). The ensemble model (mean ± standard error of the mean: 0.8833 ± 0.0151) showed a significantly higher classification accuracy than did the T2‐FLAIR (0.8392 ± 0.0173, p = 8.1 × 10‐4) and amyloid PET models (0.8348 ± 0.0174, p = 3.3 × 10‐4; Figure 2A). However, there was no significant difference between the T2‐FLAIR and amyloid PET images (p = 0.8058).
FIGURE 2.
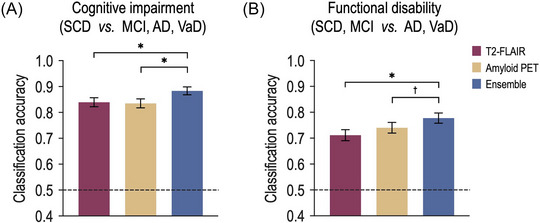
Prediction of cognitive impairment and functional disability utilizing white matter patterns. (A) For the cognitive impairment, the classification accuracy of the ensemble model was significantly higher than those of the T2‐FLAIR and amyloid PET models. (B) For the functional disability, the ensemble model showed a significantly higher classification accuracy compared to those of the T2‐FLAIR and amyloid PET models. AD, Alzheimer's disease; MCI, mild cognitive impairment; SCD, subjective cognitive decline; and VaD, vascular dementia. *indicates p < 0.005, †indicates p < 0.1.
Significant model differences were observed in the functional disability classification (F (1, 2) = 4.2; p = 0.0154). Moreover, the ensemble model (0.7775 ± 0.0195) showed significantly higher accuracy than did the T2‐FLAIR model (0.7115 ± 0.0213, p = 0.0035), and a tendency for statistically significant difference with the amyloid PET model (0.7401 ± 0.0206; p = 0.0651; Figure 2B). However, there was not statistically significant difference in the classification accuracy of the T2‐FLAIR model relative to that of the amyloid PET model (p = 0.2637).
3.3. Group differences in WM‐ISV
Figure 3 illustrates the WM‐ISV calculation and its group comparisons. ANOVA results revealed a highly significant overall effect (F = 35.3, p = 1.7 × 10‐20), providing strong evidence of differences between the subject groups.
FIGURE 3.
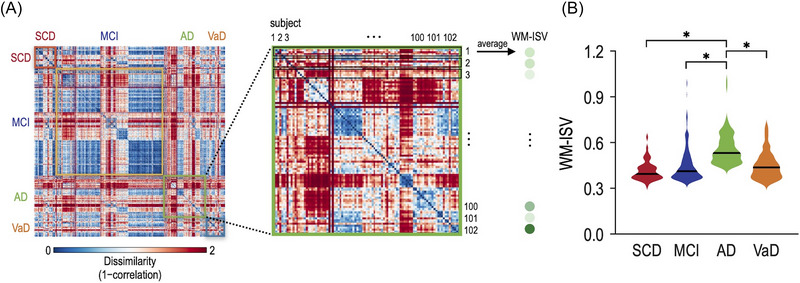
White matter inter‐subject variability (WM‐ISV) derived from the ensemble model and WM‐ISV differences across the groups. (A) WM‐ISV was calculated by the pairwise dissimilarity of white matter patterns using the correlation distance in each group. (B) The AD group demonstrated significantly higher WM‐ISV compared with the SCD, MCI, and VaD groups. AD, Alzheimer's disease; MCI, mild cognitive impairment; SCD, subjective cognitive decline; and VaD, vascular dementia.
In the pairwise comparisons, individuals with SCD (mean ± standard error of the mean: 0.4144 ± 0.0090) exhibited a highly significant difference from those with AD (0.5606 ± 0.0100, p = 2.0 × 10‐16), indicating notable differences in their white matter patterns. Similarly, the comparison between MCI (0.4499 ± 0.0069) and AD demonstrated a statistically significant difference (p = 7.3 × 10‐17), indicating that white matter patterns in these conditions are unique. Furthermore, the comparison between AD and VaD (0.4499 ± 0.0135) revealed a statistically significant difference (p = 4.9 × 10‐9), revealing insights into the variations in the white matter patterns between these related neurodegenerative diseases. However, it is important to note that the differences between SCD and MCI (p = 0.0299), SCD and VaD (p = 0.0285), and MCI and VaD (p = 0.9974) were not statistically significant after Bonferroni correction for six tests (adjusted p‐value = 0.0083 ()). In addition, the APOE ε4 allele is a major genetic risk factor for AD; thus, we investigated whether APOE ε4 allele carriers influence WM‐ISV values by examining differences in WM‐ISV between APOE ε4 allele carriers and non‐carriers within each diagnostic group. We found that the WM‐ISV was significantly higher among APOE ε4 allele carriers in the MCI group (two‐sample t‐tests, p = 0.0064); no statistically significant differences were observed in other diagnostic groups.
3.4. Relationship between WM‐ISV patterns and biomarkers
Next, we explored the relationship between the WM‐ISV and biomarkers of neurodegenerative disorders by performing subgroup analyses based on disease status, cognitive impairment, and disability (Figure 4). To assess whether this relationship persisted after adjusting for potential covariates, we used generalized linear models and estimated the effect size of the WM‐ISV on each biomarker using the partial eta‐squared coefficient (Table 2).
FIGURE 4.
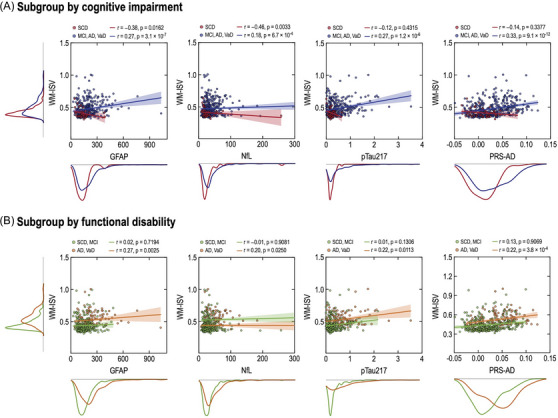
Associations of white matter inter‐subject variability (WM‐ISV) with blood‐based biomarker and the polygenic risk score. The unit of GFAP, NfL, and p‐tau217 is pg/mL. GFAP, glial fibrillary acidic protein; NfL, neurofilament light.
TABLE 2.
Generalized linear model for the association of white matter inter‐subject variability (WM‐ISV) with the biomarker and clinical characteristics of the study participants (n = 454).
| Independent variable: WM‐ISV | |||||
|---|---|---|---|---|---|
| Non‐adjusted model | Adjusted model | ||||
| Dependent variables a | β (SE) | p‐value | β (SE) | p‐value b | η p 2 of WM‐ISV c |
| Biomarker characteristics | |||||
| Plasma GFAP | 0.98 (0.25) | < 0.001 | 0.74 (0.26) | 0.006 | 0.024 (small) |
| Plasma NfL | 0.97 (0.55) | 0.080 | 0.70 (0.40) | 0.077 | – |
| Plasma p‐tau217 | 2.49 (0.41) | <0.001 | 2.05 (0.40) | <0.001 | 0.066 (medium) |
| Polygenic risk score for AD | 0.08 (0.01) | <0.001 | 0.05 (0.01) | <0.001 | 0.037 (medium) |
| Clinical characteristics | |||||
| General cognition | −4.95 (0.98) | <0.001 | −4.48 (0.98) | <0.001 | 0.045 (small) |
| Verbal memory | −3.57 (0.45) | <0.001 | −2.83 (0.48) | <0.001 | 0.075 (medium) |
| Visuospatial memory | −4.00 (0.44) | <0.001 | −3.21 (0.45) | <0.001 | 0.106 (medium) |
| Disability | 2.17 (0.38) | <0.001 | 1.64 (0.40) | <0.001 | 0.033 (small) |
Abbreviations: AD, Alzheimer's disease; GFAP, glial fibrillary acidic protein; NfL, neurofilament light.
The number of participants for each dependent variable analysis was as follows: general cognition (n = 447), verbal memory (n = 446), visuospatial memory (n = 439), disability (n = 449), plasma GFAP (n = 393), plasma NfL (n = 393), plasma p‐tau217 (n = 367), and polygenic risk score for AD (n = 447). Some cognitive measures were missed in small proportions, and blood‐based biomarkers were assessed in only a subset of participants from the biobank consortium.
p‐values for the model were calculated after adjusting for age, sex, education, body mass index, diabetes, hypertension, depressive symptoms, APOE ε4 allele carriers, and institutions. The independent variable was directly incorporated into the model and all covariates were included using a stepwise method for the parsimonious model.
We measured the effect size of inter‐subject variability of white matter patterns (WM‐ISV) using partial eta squared (η p 2) in the significant model. According to consensus, η p 2 > 0.14, η p 2 > 0.06, and η p 2 > 0.01 represent small, medium, and large effect sizes, respectively.
Figure 4 shows the intricate relationships between WM‐ISV and biomarkers in the study participants. In the subgroup analysis based on cognitive impairment, individuals without cognitive impairment (SCD) showed a significant negative correlation between white matter patterns with GFAP (r = ‐0.38, p = 0.0162), whereas individuals with cognitive impairment (MCI, AD, VaD) exhibited positive correlations (r = 0.27, p = 3.1 × 10‐7). Similarly, NfL exhibited a significant negative correlation in the individuals with SCD (r = ‐0.46, p = 0.0033) and a significant positive correlation in the individuals diagnosed with MCI, AD, or VaD (r = 0.18, p = 6.7 × 10‐4). This tendency toward correlation was also observed in p‐tau217 (SCD: r = ‐0.12, p = 0.4315; MCI, AD, VaD: r = 0.27, p = 1.2 × 10‐6) and PRS‐AD (SCD: r = ‐0.14, p = 0.3377; MCI, AD, VaD: r = 0.33, p = 9.1 × 10‐12), indicating significant correlations in the individuals with MCI, AD, and VaD but not in the individuals with SCD.
In the subgroup analysis based on functional disability, the GFAP level significantly positively correlated with WM‐ISV in individuals with functional disabilities (AD, VaD; r = 0.27, p = 0.0025). However, this correlation was not significant in the individuals with SCD or MCI (p = 0.7194). Similarly, NfL exhibited a significant positive correlation in the individuals with AD and VaD (p = 0.0250), whereas this correlation was not significant in the individuals with SCD and MCI (p = 0.9081). These patterns were observed in p‐tau217 (SCD, MCI: r = 0.10, p = 0.1306; AD, VaD: r = 0.22, p = 0.0113) and PRS‐AD (SCD, MCI: r = 0.13, p = 0.9069; AD, VaD: r = 0.29, p = 3.8 × 10‐4). In all the participants, significant associations were observed between the WM‐ISV and certain biomarkers. In the generalized linear model, after adjusting for covariates, the WM‐ISV was significantly associated with plasma GFAP (small effect size, p = 0.006), plasma p‐tau217, and PRS‐AD (medium effect size, both p < 0.001). Notably, the association with the plasma NfL levels was not significant. In addition, in the association between biomarkers and WM‐ISV in each group, there were significant positive correlations between WM‐ISV and NfL for VaD (r = 0.35, p = 0.0380), and WM‐ISV and PRS‐AD for MCI (r = 0.16, p = 0.0095). Furthermore, the correlation between WM‐ISV and p‐tau217 for MCI tended to be positive (r = 0.12, p = 0.0911) (Figure S2).
3.5. Relationship between WM‐ISV patterns and cognition scores
Finally, we examined the association between the WM‐ISV and the clinical characteristics of the neurodegenerative disorders. This analysis was conducted in a manner similar to that performed in the above examination of the relationship between WM‐ISV and biomarker characteristics (Figure 5 and Table 2).
FIGURE 5.
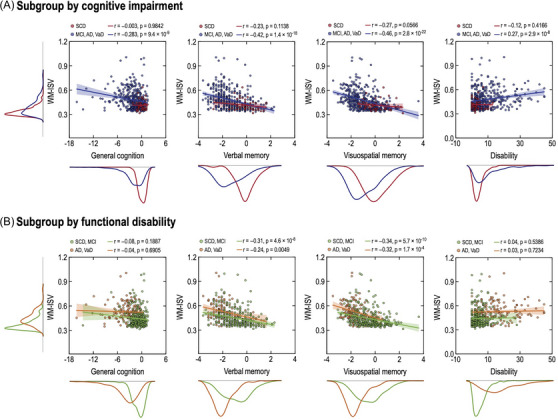
Associations of white matter inter‐subject variability (WM‐ISV) with cognitive function and disability. The unit of general cognition, verbal memory, and visuospatial memory is the z‐score.
Figure 5 presents the relationships between the WM‐ISV, cognition, and disability scores. In the subgroup analysis based on the cognitive impairment, a noteworthy negative correlation was observed between general cognition and white matter patterns exhibiting this relationship (r = ‐0.283, p = 7.5 × 10‐9). Verbal memory displayed a non‐significant negative correlation among the individuals without cognitive impairment (SCD: r = ‐0.29, p = 0.1138), whereas the correlation became significant for those with cognitive impairment (MCI, AD, VaD: r = ‐0.42, p = 1.2 × 10‐18). Similarly, the visuospatial memory exhibited a negative correlation with white matter patterns in the individuals without cognitive impairment (SCD: r = ‐0.27, p = 0.0566), which was strengthened and became highly significant in those with cognitive impairment (MCI, AD, VaD: r = ‐0.46, p = 2.3 × 10‐22). The relationship between disability and white matter patterns was non‐significant in the individuals without cognitive impairment (SCD: r = ‐0.12, p = 0.4166), but showed a significant positivity in those with cognitive impairment (MCI, AD, VaD: r = 0.27, p = 2.9 × 10‐8).
In the subgroup analysis based on the functional disability, general cognition showed a non‐significant negative correlation among the individuals with (AD, VaD: r = ‐0.04, p = 0.6742) and without functional disability (SCD, MCI: r = ‐0.08, p = 0.1789). Verbal memory displayed a strong negative correlation among the individuals with (AD, VaD: r = ‐0.24, p = 0.0046) and without functional disability (SCD, MCI: r = ‐0.30, p = 5.2 × 10‐8). Visuospatial memory exhibited a highly significant negative correlation for the individuals with (AD, VaD: r = ‐0.32, p = 1.5 × 10‐4) and without functional disability (SCD, MCI: r = ‐0.34, p = 6.5 × 10‐10). However, IADL showed a non‐significant correlation in the individuals with (AD, VaD: r = 0.03, p = 0.7014) and without functional disability (SCD, MCI: r = 0.04, p = 0.5129). These results provide valuable insights into the complex associations between white matter patterns and cognition scores, distinguishing between the significant and non‐significant correlations across the various cognitive domains.
In all the participants, significant associations were observed between the clinical characteristics and WM‐ISV (Table 2). By utilizing a generalized linear model and adjusting for covariates, the WM‐ISV was significantly correlated with general cognition, verbal memory, visuospatial memory, and disability scores (all p < 0.001). The effect sizes of the WM‐ISV were small for general cognition and disability and medium for both verbal and visuospatial memory.
4. DISCUSSION
In this study, we successfully extracted comprehensive white matter patterns from an ensemble of MRI and amyloid PET images of older adults with cognitive complaints. We then applied these whole brain white matter patterns to a machine learning model to predict cognitive impairment and functional disability, which are typically assessed by physicians through detailed clinical evaluations and multiple tests. Notably, high signals were observed within the white matter on T2‐FLAIR and amyloid PET (Figure S3). However, the observed alterations in white matter patterns demonstrated heterogeneity among individuals. This suggests that they might reflect a variety of pathologies, including cerebrovascular burden, inflammation, demyelination, and hypoperfusion. We subsequently extracted WM‐ISV data from these patterns (Figure 3A) and found that participants in the AD group exhibited higher WM‐ISV than those in the SCD, MCI, and VaD groups (Figure 3B). Moreover, WM‐ISV in older adults with cognitive complaints was associated with blood‐based biomarkers linked to neurodegenerative processes—such as GFAP for inflammation, NfL for neural injury, and p‐tau217 for tau pathology—as well as a PRS for AD, even after adjusting for potential covariates. In addition, we identified a potential association between WM‐ISV and neuropsychological test and disability scores in the study participants, underscoring its utility as a biomarker in various clinical and research settings.
A significant contribution of our study is the development of a novel neuroimaging analysis method that shows promise for clinical applications. In a clinical context, determining whether patients presenting with cognitive complaints have measurable cognitive impairment or functional disability is critical for accurate diagnosis and treatment planning. Typically, this assessment relies on comprehensive, labor‐intensive neuropsychological tests and structured clinical assessments, which can be costly and sometimes lack reproducibility. The growing demographics of older adults living alone or solely with a spouse, often in the absence of a reliable caregiver, present further challenges for accurately evaluating cognitive impairment and disability. To meet this critical need in clinical practice, we successfully extracted whole brain white matter patterns from both T2‐FLAIR and amyloid PET and predicted cognitive impairment and functional disability. We believe that our method can provide supplementary information and helpful diagnostic insights for physicians in clinical settings, especially when reliable caregivers are lacking. Furthermore, our research established a meaningful link between WM‐ISV (associated with white matter heterogeneity) and APOE ε4 allele carrier status (Figure S4), the recently emphasized blood‐based biomarkers GFAP and p‐tau217, a PRS for AD, and detailed cognitive tests and disability scores. This association underscores the potential use of WM‐ISV as a neural correlate, offering new insights into the pathophysiology of neurodegenerative diseases and aiding in the decision‐making process for further in‐depth evaluations and biomarker studies.
Another contribution of our study is the emphasis on white matter pattern analysis in neuroimaging modalities. White matter is crucial at both the microscale (containing essential glial cells for central nervous system functions) and macroscale levels (mediating functional integration across cortical brain regions). 39 , 40 Patients with white matter signal changes on MRI or PET often exhibit symptoms like cognitive decline, bradykinesia, and depression, severely affecting their daily independence. 41 , 42 However, signals generated from the white matter in neuroimaging studies have been relatively underappreciated. One challenge in studying white matter signal is the diversity of the types and locations of changes that can occur in the brain. In addition, even lesions that appear similar to white matter hyperintensities may arise from various pathophysiologies. In this study, we analyzed white matter signal changes from T2‐FLAIR and amyloid PET images across 360 brain regions assumed to be connected to gray matter and successfully used these patterns to predict cognitive impairment and functional disability. The clinical utility of the white matter patterns we analyzed is likely due to their ability to reflect diverse pathophysiologies coexisting within the white matter. Although our study did not specifically associate the extracted white matter patterns or WM‐ISV with any single pathology, the methodology we developed is valuable because it captures the complex and coexistent pathophysiology within various white matter regions, offering possible clinical and research implications. In addition, we found that WM‐ISV has a positive association with GFAP and p‐tau217, reflecting inflammation and tau pathology, respectively. Considering the existing research that identifies cerebrovascular burden, inflammation, and demyelination as key factors in white matter signal changes, the white matter patterns or WM‐ISV values that we extracted may reflect these pathologies, thereby correlating with biomarker and clinical characteristics. 24
By utilizing multimodal T2‐FLAIR and amyloid PET images, we tested the potential of whole brain white matter patterns as novel neuroimaging biomarkers for assessing cognitive impairment and disability in older adults. The current method differs from previous neuroimaging approaches for the diagnosis of neurodegenerative diseases, which use gray matter volumes, cerebrospinal fluid (CSF)–related features, or white matter hyperintensity. Because the white matter transfers information about functions across the cortical brain regions in the gray matter, 32 , 40 and the use of the white matter atlas can represent functions to 360 cortical gray matter regions as WM patterns, 32 we were able to observe the changes in WM signals indirectly among the groups involved in neurodegenerative diseases. Using the WM patterns extracted from the T2‐FLAIR and amyloid PET images, we classified the cognitive impairment and functional disability of participants. When we used multimodal T2‐FLAIR and amyloid PET images (e.g., ensemble image), the classification performance significantly improved compared with using a single modality. These findings are in line with previous AD studies using machine learning and multimodality imaging data. 43 , 44 , 45 Therefore, our findings indicate the feasibility of using multimodal neuroimaging data and white matter patterns to classify cognitive impairments and functional disabilities in patients with neurodegenerative disorders. This is expected to contribute to expanding the critical role of white matter in the classification of neurodegenerative diseases.
Our study has some limitations. First, our approach to examining the relationship between the WM‐ISV, biomarkers, and clinical characteristics was cross‐sectional. Therefore, further validation through longitudinal data analysis is necessary to determine whether the WM‐ISV can predict the progression of cognitive impairment or disability. Second, the limited application of covariates may have overlooked potential confounders. Third, our study was conducted exclusively in an East Asian population; thus, additional research is required to establish its global applicability. Fourth, the number of participants in the SCD and VaD groups was relatively small; in particular, the number of APOE ε4 allele carriers was limited, which necessitates caution in interpreting the findings.
In summary, our study utilized whole brain white matter patterns derived from T2‐FLAIR and amyloid PET to predict cognitive impairment and functional disability, demonstrating the potential of these patterns as novel neuroimaging biomarkers. This approach reflects complex white matter pathologies and correlates with clinical and biomarker characteristics, suggesting its utility in differential diagnosis and candidate selection for further workup in clinical settings. Future research is required to expand our findings through larger, longitudinal studies to confirm the utility of white matter patterns and WM‐ISV, their associations with various white matter pathophysiology, and the structural–functional couplings derived from functional MRI (fMRI).
CONFLICT OF INTEREST STATEMENT
The authors declare that there are no potential conflicts of interest. Author disclosures are available in the Supporting Information.
CONSENT STATEMENT
The BICWALZS trial was recorded in the Korean National Clinical Trial Registry under the Clinical Research Information Service (identifier: KCT0003391). All the participants and their caregivers provided written informed consent for participation in this study. This study was approved by the institutional review board of the Korea Brain Research Institute (IRB number: KBRI‐202206‐BR‐0001).
Supporting information
Supporting Information
Supporting Information
Supporting Information
Supporting Information
Supporting Information
ACKNOWLEDGMENTS
This study was conducted using biospecimens and data from the Biobank Innovations for Chronic Cerebrovascular Disease With ALZheimer's Disease Study (BICWALZS) consortium, which was funded by the Korea Disease Control and Prevention Agency for the Korea Biobank Project (#6637‐303). This research was supported by grants from the National Research Foundation of Korea (NRF), funded by the Ministry of Science and ICT (NRF‐2019R1A5A2026045), and grants from the Korea Health Industry Development Institute (KHIDI), funded by the Ministry of Health and Welfare (HR21C1003,, HI22C0724, HR22C1734, HV22C0073, and HV22C0164), to H.W.R., S.J.S., and C.H.H. This research was supported by the Korea Brain Research Institute (KBRI) Basic Research Program, funded by the Ministry of Science and ICT (24‐BR‐05‐01, 24‐BR‐05‐02) to D.L.
Roh HW, Chauhan N, Seo SW, et al. Assessing cognitive impairment and disability in older adults through the lens of whole brain white matter patterns. Alzheimer's Dement. 2024;20:6032–6044. 10.1002/alz.14094
Hyun Woong Roh and Dongha Lee equally contributed to this study and are the co‐first authors.
Contributor Information
Sang Joon Son, Email: sjsonpsy@ajou.ac.kr.
Chang Hyung Hong, Email: antiaging@ajou.ac.kr.
Dongha Lee, Email: donghalee@kbri.re.kr.
REFERENCES
- 1. Wilson DM 3rd, Cookson MR, Van Den Bosch L, Zetterberg H, Holtzman DM, Dewachter I. Hallmarks of neurodegenerative diseases. Cell. 2023;186:693‐714. [DOI] [PubMed] [Google Scholar]
- 2. Erkkinen MG, Kim MO, Geschwind MD. Clinical neurology and epidemiology of the major neurodegenerative diseases. Cold Spring Harb Perspect Biol. 2018;10:a033118. [DOI] [PMC free article] [PubMed] [Google Scholar]
- 3. Petersen RC, Caracciolo B, Brayne C, Gauthier S, Jelic V, Fratiglioni L. Mild cognitive impairment: a concept in evolution. J Intern Med. 2014;275:214‐228. [DOI] [PMC free article] [PubMed] [Google Scholar]
- 4. Knopman DS, Petersen RC. Mild cognitive impairment and mild dementia: a clinical perspective. Mayo Clin Proc. 2014;89:1452‐1459. [DOI] [PMC free article] [PubMed] [Google Scholar]
- 5. Hansson O. Biomarkers for neurodegenerative diseases. Nat Med. 2021;27:954‐963. [DOI] [PubMed] [Google Scholar]
- 6. Jack CR Jr, Bennett DA, Blennow K, et al. NIA‐AA Research Framework: toward a biological definition of Alzheimer's disease. Alzheimers Dement. 2018;14:535‐562. [DOI] [PMC free article] [PubMed] [Google Scholar]
- 7. Chouliaras L, O'Brien JT. The use of neuroimaging techniques in the early and differential diagnosis of dementia. Mol Psychiatry. 2023;28(10):4084‐4097. [DOI] [PMC free article] [PubMed] [Google Scholar]
- 8. Arevalo‐Rodriguez I, Smailagic N, Roqué‐Figuls M, et al. Mini‐Mental State Examination (MMSE) for the early detection of dementia in people with mild cognitive impairment (MCI). Cochrane Database Syst Rev. 2021;7:CD010783. [DOI] [PMC free article] [PubMed] [Google Scholar]
- 9. Creavin ST, Wisniewski S, Noel‐Storr AH, et al. Mini‐Mental State Examination (MMSE) for the detection of dementia in clinically unevaluated people aged 65 and over in community and primary care populations. Cochrane Database Syst Rev. 2016;2016:CD011145. [DOI] [PMC free article] [PubMed] [Google Scholar]
- 10. Salmon DP, Bondi MW. Neuropsychological assessment of dementia. Annu Rev Psychol. 2009;60:257‐282. [DOI] [PMC free article] [PubMed] [Google Scholar]
- 11. Belleville S, Fouquet C, Hudon C, Zomahoun HTV, Croteau J, Consortium for the Early Identification of Alzheimer's d‐Q . Neuropsychological measures that predict progression from mild cognitive impairment to Alzheimer's type dementia in older adults: a systematic review and meta‐analysis. Neuropsychol Rev. 2017;27:328‐353. [DOI] [PMC free article] [PubMed] [Google Scholar]
- 12. Jorm AF. Disability in dementia: assessment, prevention, and rehabilitation. Disabil Rehabil. 1994;16:98‐109. [DOI] [PubMed] [Google Scholar]
- 13. Dzien C, Unterberger P, Hofmarcher P, Winner H, Lechleitner M. Detecting disabilities in everyday life: evidence from a geriatric assessment. BMC Geriatr. 2022;22:717. [DOI] [PMC free article] [PubMed] [Google Scholar]
- 14. Morris JC. Clinical dementia rating: a reliable and valid diagnostic and staging measure for dementia of the Alzheimer type. Int Psychogeriatr. 1997;9(Supp 1):173‐176. [DOI] [PubMed] [Google Scholar]
- 15. Gold DA. An examination of instrumental activities of daily living assessment in older adults and mild cognitive impairment. J Clin Exp Neuropsychol. 2012;34:11‐34. [DOI] [PubMed] [Google Scholar]
- 16. Sikkes SA, Rotrou J. A qualitative review of instrumental activities of daily living in dementia: what's cooking? Neurodegener Dis Manag. 2014;4:393‐400. [DOI] [PubMed] [Google Scholar]
- 17. Mudrazija S, Angel JL, Cipin I, Smolic S. Living alone in the United States and Europe: the impact of public support on the independence of older adults. Res Aging. 2020;42:150‐162. [DOI] [PMC free article] [PubMed] [Google Scholar]
- 18. Sun H, Schafer MH. Isolation or replenishment? The case of partner network exclusivity and partner loss in later life. J Gerontol B Psychol Sci Soc Sci. 2023;78:705‐717. [DOI] [PMC free article] [PubMed] [Google Scholar]
- 19. Lorking N, Murray AD, O'Brien JT. The use of positron emission tomography/magnetic resonance imaging in dementia: a literature review. Int J Geriatr Psychiatry. 2021;36:1501‐1513. [DOI] [PubMed] [Google Scholar]
- 20. Rittman T. Neurological update: neuroimaging in dementia. J Neurol. 2020;267:3429‐3435. [DOI] [PMC free article] [PubMed] [Google Scholar]
- 21. Garnier‐Crussard A, Bougacha S, Wirth M, et al. White matter hyperintensity topography in Alzheimer's disease and links to cognition. Alzheimers Dement. 2022;18:422‐433. [DOI] [PMC free article] [PubMed] [Google Scholar]
- 22. Ottoy J, Ozzoude M, Zukotynski K, et al. Vascular burden and cognition: mediating roles of neurodegeneration and amyloid PET. Alzheimers Dement. 2023;19:1503‐1517. [DOI] [PubMed] [Google Scholar]
- 23. Ottoy J, Ozzoude M, Zukotynski K, et al. Amyloid‐PET of the white matter: relationship to free water, fiber integrity, and cognition in patients with dementia and small vessel disease. J Cereb Blood Flow Metab. 2023;43:921‐936. [DOI] [PMC free article] [PubMed] [Google Scholar]
- 24. Garnier‐Crussard A, Cotton F, Krolak‐Salmon P, Chételat G. White matter hyperintensities in Alzheimer's disease: beyond vascular contribution. Alzheimers Dement. 2023;19:3738‐3748. [DOI] [PubMed] [Google Scholar]
- 25. Roh HW, Kim NR, Lee DG, et al. Baseline clinical and biomarker characteristics of biobank innovations for chronic cerebrovascular disease with Alzheimer's disease study: bICWALZS. Psychiatry Investig. 2022;19:100‐109. [DOI] [PMC free article] [PubMed] [Google Scholar]
- 26. Winblad B, Palmer K, Kivipelto M, et al. Mild cognitive impairment–beyond controversies, towards a consensus: report of the International Working Group on Mild Cognitive Impairment. J Intern Med. 2004;256:240‐246. [DOI] [PubMed] [Google Scholar]
- 27. McKhann GM, Knopman DS, Chertkow H, et al. The diagnosis of dementia due to Alzheimer's disease: recommendations from the National Institute on Aging‐Alzheimer's Association workgroups on diagnostic guidelines for Alzheimer's disease. Alzheimers Dement. 2011;7:263‐269. [DOI] [PMC free article] [PubMed] [Google Scholar]
- 28. Sachdev PS, Blacker D, Blazer DG, et al. Classifying neurocognitive disorders: the DSM‐5 approach. Nat Rev Neurol. 2014;10:634‐642. [DOI] [PubMed] [Google Scholar]
- 29. Ahn HJ, Chin J, Park A, et al. Seoul Neuropsychological Screening Battery‐dementia version (SNSB‐D): a useful tool for assessing and monitoring cognitive impairments in dementia patients. J Korean Med Sci. 2010;25:1071‐1076. [DOI] [PMC free article] [PubMed] [Google Scholar]
- 30. Kim SJ, Ham H, Park YH, et al. Development and clinical validation of CT‐based regional modified Centiloid method for amyloid PET. Alzheimers Res Ther. 2022;14:157. [DOI] [PMC free article] [PubMed] [Google Scholar]
- 31. Ashburner J. A fast diffeomorphic image registration algorithm. Neuroimage. 2007;38:95‐113. [DOI] [PubMed] [Google Scholar]
- 32. Lee D, Park HJ. A populational connection distribution map for the whole brain white matter reveals ordered cortical wiring in the space of white matter. Neuroimage. 2022;254:119167. [DOI] [PubMed] [Google Scholar]
- 33. Plant C, Teipel SJ, Oswald A, et al. Automated detection of brain atrophy patterns based on MRI for the prediction of Alzheimer's disease. Neuroimage. 2010;50:162‐174. [DOI] [PMC free article] [PubMed] [Google Scholar]
- 34. Challis E, Hurley P, Serra L, Bozzali M, Oliver S, Cercignani M. Gaussian process classification of Alzheimer's disease and mild cognitive impairment from resting‐state fMRI. Neuroimage. 2015;112:232‐243. [DOI] [PubMed] [Google Scholar]
- 35. Chen H, Li W, Sheng X, et al. Machine learning based on the multimodal connectome can predict the preclinical stage of Alzheimer's disease: a preliminary study. Eur Radiol. 2022;32:448‐459. [DOI] [PubMed] [Google Scholar]
- 36. Zhang Y, Xu T, Han X, et al. Enhanced intersubject similarity in functional connectivity by long‐term abacus training. Cereb Cortex. 2023;33:8633‐8644. [DOI] [PubMed] [Google Scholar]
- 37. Hansson O, Blennow K, Zetterberg H, Dage J. Blood biomarkers for Alzheimer's disease in clinical practice and trials. Nat Aging. 2023;3:506‐519. [DOI] [PMC free article] [PubMed] [Google Scholar]
- 38. Teunissen CE, Verberk IMW, Thijssen EH, et al. Blood‐based biomarkers for Alzheimer's disease: towards clinical implementation. Lancet Neurol. 2022;21:66‐77. [DOI] [PubMed] [Google Scholar]
- 39. Fields RD. Neuroscience. Change in the brain's white matter. Science. 2010;330:768‐769. [DOI] [PMC free article] [PubMed] [Google Scholar]
- 40. Park HJ, Friston K. Structural and functional brain networks: from connections to cognition. Science. 2013;342:1238411. [DOI] [PubMed] [Google Scholar]
- 41. Dichgans M, Leys D. Vascular cognitive impairment. Circ Res. 2017;120:573‐591. [DOI] [PubMed] [Google Scholar]
- 42. Qiu T, Liu ZQ, Rheault F, et al. Structural white matter properties and cognitive resilience to tau pathology. Alzheimers Dement. 2024;20:3364‐3377. [DOI] [PMC free article] [PubMed] [Google Scholar]
- 43. Lei B, Chen S, Ni D, Wang T. Discriminative learning for Alzheimer's disease diagnosis via canonical correlation analysis and multimodal fusion. Front Aging Neurosci. 2016;8:77. [DOI] [PMC free article] [PubMed] [Google Scholar]
- 44. Hao X, Bao Y, Guo Y, et al. Multi‐modal neuroimaging feature selection with consistent metric constraint for diagnosis of Alzheimer's disease. Med Image Anal. 2020;60:101625. [DOI] [PMC free article] [PubMed] [Google Scholar]
- 45. Dong A, Zhang G, Liu J, Wei Z. Latent feature representation learning for Alzheimer's disease classification. Comput Biol Med. 2022;150:106116. [DOI] [PubMed] [Google Scholar]
Associated Data
This section collects any data citations, data availability statements, or supplementary materials included in this article.
Supplementary Materials
Supporting Information
Supporting Information
Supporting Information
Supporting Information
Supporting Information