

Abstract
Background and Aim
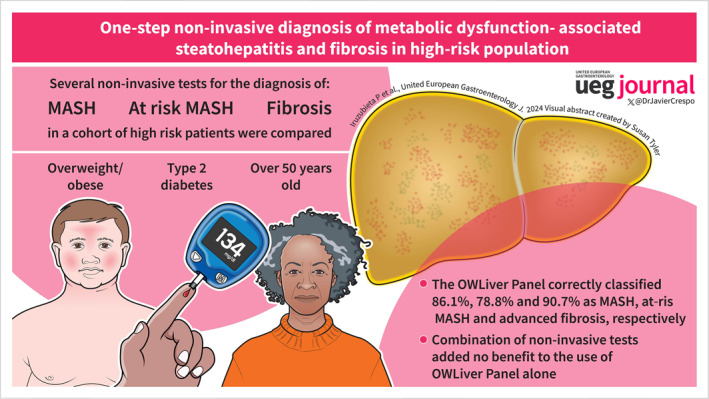
Type 2 Diabetes mellitus (T2DM), age, and obesity are risk factors for metabolic dysfunction‐associated steatotic liver disease (MASLD). We aimed to assess the performance of non‐invasive tests (NITs) for the diagnosis of metabolic dysfunction‐associated steatohepatitis (MASH) and fibrosis in high‐risk subjects.
Methods
Multicentre cross‐sectional study that included 124 biopsy‐proven MASLD in more than 50 years‐old patients with overweight/obesity and T2DM. Vibration‐controlled transient elastography, Fibrosis‐4 index (FIB‐4), Non‐alcoholic fatty liver disease fibrosis score (NFS), OWLiver Panel (OWLiver DM2 + Metabolomics‐Advanced Steatohepatitis Fibrosis Score ‐MASEF) and FibroScan‐AST were performed. Sensitivity, specificity, positive predictive value (PPV), negative predictive value (NPV) and area under the receiver operating characteristic curve (AUC) were calculated. NITs were assessed individually and in sequential/parallel combinations.
Results
35 (28.2%) patients had early MASH and 66 (53.2%) had MASH with significant fibrosis (at‐risk MASH). The OWLiver Panel correctly classified 86.1% as MASH, showing an accuracy, sensitivity, specificity, PPV, and NPV of 0.77, 0.86, 0.35, 0.85, and 0.36, respectively. Class III obesity, diabetes control, or gender did not impact on the performance of the OWLiver Panel (p > 0.1). NITs for at‐risk MASH showed an AUC > 0.70 except for NFS. MASEF showed the highest accuracy and NPV for at‐risk MASH (AUC 0.77 [0.68–0.85], NPV 72%) and advanced fibrosis (AUC 0.80 [0.71–0.88], NPV 92%). Combinations of NITs for the identification of at‐risk MASH did not provide any additional benefit over using MASEF alone.
Conclusion
One‐step screening strategy with the OWLiver Panel has high accuracy to detect MASH and at‐risk MASH in high‐risk subjects for MASLD.
Keywords: at‐risk MASH, biopsy, fibroscan, MASEF score, MASLD, metabolic dysfunction‐associated steatotic liver disease, metabolic syndrome, non‐invasive tests, OWLiver panel, type 2 diabetes mellitus
Key summary.
Established knowledge
Liver inflammation in metabolic dysfunction‐associated steatotic liver disease (MASLD) is considered an important marker for disease activity and a trigger of fibrosis progression and clinical outcomes; thus, early detection of MASH and significant fibrosis (at‐risk MASH) provides an opportunity to positively affect liver health.
Given that type 2 diabetes mellitus (T2DM), age, and obesity are well‐established risk factors for the development and progression of MASLD, the evaluation of screening strategies for detecting MASH and liver fibrosis in these subjects is a priority.
New or significant findings
We evaluated the performance of non‐invasive tests (NITs), including the lipidomic test OWLiver Panel, for the diagnosis of MASH and fibrosis in a cohort of subjects at high risk of MASH progression (>50 years‐old, overweight/obesity and T2DM).
The OWLiver Panel correctly classified 86.1%, 78.8% and 90.7% as MASH, at‐risk MASH and advanced fibrosis, respectively.
Combinations of NITs for the identification of at‐risk MASH did not provide any additional benefit over using OWLiver Panel alone.
A one‐step screening strategy using the OWLiver Panel can accurately predict the presence of MASH and at‐risk MASH in subjects at high risk of MASH progression.
INTRODUCTION
Metabolic dysfunction‐associated steatotic liver disease (MASLD) is a leading chronic liver disease, projected to be the primary cause of end‐stage liver disease and liver transplantation in the next decades. 1 MASLD spans isolated steatosis to metabolic dysfunction‐associated steatohepatitis (MASH), fibrosis and, cirrhosis. 2 It also mediates systemic diseases, predominantly causing morbidity and mortality via cardiovascular disease, 3 which denotes vast socio‐economic impact, representing a major challenge for global public health. 4 Early identification of high‐risk patients for effective disease management has likely the potential to decrease overall mortality.
Type 2 diabetes mellitus (T2DM), age, and obesity are well‐established risk factors for the development and progression of MASLD 5 , 6 ; thus, evaluating liver disease severity in this population at risk is clinically relevant. Liver fibrosis represents the main risk factor not only for liver‐related but also for overall mortality in MASLD patients. 3 In spite of this, steatohepatitis is the main driver of fibrogenesis and patients with MASH and earlier stages of fibrosis are also at risk for disease progression and adverse outcomes. 2 , 7 Non‐invasive tests (NITs), such as Fibrosis‐4 index (FIB‐4) and Non‐alcoholic fatty liver disease (NAFLD) Fibrosis Score (NFS), have been developed to rule in or out the risk of advanced fibrosis. 8 However, metabolic risk factors, such as obesity and T2DM, can affect the diagnostic accuracy of NITs in MASLD. 9 , 10 , 11 , 12 , 13 Regarding MASH, there are few and inaccurate tests intended to detect liver inflammation. 14
Deranged lipid metabolism is also associated with MASLD progression and therefore, alterations in liver and serum lipidomic signatures are potential indicators of disease development and progression. 15 On this basis, several serum‐based lipidomic tests have been designed to differentiate normal liver from MASLD and/or isolated steatosis from MASH. 16 , 17 Additionally, a lipidomic‐driven score, the Metabolomics‐Advanced Steatohepatitis Fibrosis Score (MASEF), that includes 12 lipids, body mass index (BMI), aspartate aminotransferase (AST) and, alanine aminotransferase (ALT), has recently demonstrated higher accuracy in identifying patients with MASH and significant fibrosis (at‐risk MASH) than FibroScan‐AST (FAST) score. 18
Since lipidomic tests only require a minimal amount of serum or plasma, it is plausible that these tests could be used as a tool to screen for MASH and significant fibrosis in high‐risk populations for MASLD with a one‐step approach. For this purpose, we aimed to assess the ability of existing lipidomic scores to classify liver disease in a cohort of subjects over 50 years of age with T2DM and BMI over 25 kg/m2, a population with a significantly higher risk of developing advanced liver disease.
METHODS
Study design and participants
This is a multicentre, observational, and cross‐sectional study that included biopsy‐proven MASLD patients from the Spanish HEPAmet Registry. 19 The present study enrolled patients from 7 hospitals in Spain (Marqués de Valdecilla University Hospital, Santander; University Hospital of Valladolid, Valladolid; Virgen del Rocío University Hospital, Seville; Araba University Hospital, Vitoria; Puerta de Hierro University Hospital, Madrid; Gregorio Marañón University Hospital, Madrid; and Ramón y Cajal University Hospital, Madrid). The key selection/inclusion criteria were biopsy‐proven MASLD patients with T2DM, BMI ≥ 25 kg/m2 and age ≥ 50 years. Target MASLD patients were telephonically invited for the study. A history and physical examination were performed on all patients who agreed to participate between July 2019 and July 2020. A vibration‐controlled transient elastography (VCTE) was performed and fasting blood samples were drawn for routine laboratory tests, as well as for metabolomic tests. Only patients who met all the inclusion criteria, had no liver disease other than MASLD, had no increased alcohol consumption (≥20 g/day in females and ≥30 g/day in males), showed no direct or indirect signs of portal hypertension and, had a liver biopsy within the past 6 months were considered for the analysis.
The study was carried out in accordance with the principles of the Helsinki Declaration and approved by the Ethics Committees for Clinical Research of the different participating hospitals in Spain. All the participants signed the corresponding written informed consent form.
Non‐invasive assessment of liver fibrosis
We used clinical and laboratory data obtained at the clinical visit to calculate the FIB‐4, NFS and FAST, using published formulas. 20 , 21 , 22 Cutoff values for advanced fibrosis were those previously published (FIB‐4: 1.3 and 2.67; NFS: −1.455 and 0.676). 21 , 22 , 23 Given that FIB‐4 and NFS were designed to identify advanced fibrosis, and FAST was developed for detecting significant fibrosis, we considered the lower thresholds of FIB‐4 and NFS, along with the higher threshold of FAST (0.67), as indicators of a high risk of significant fibrosis for the comparison between non‐invasive markers.
Liver stiffness measurements (LSMs) were obtained using VCTE (FibroScan®, Echosens, Paris, France) at corresponding centers by experienced professionals and using the probe recommended by the device for each individual patient. For the analysis, we only considered successful measurements based on at least 10 valid measurements, a success rate above 60% and an interquartile range of < 30% of the median value. According to several studies, we considered a cut‐off value of 7.6 kPa for significant fibrosis (F ≥ 2), and 8.8 kPa for advanced fibrosis (F ≥ 3). 24
Liver histology
Liver biopsy was used as the reference. Biopsies were read at each center by a single expert pathologist. To ensure accurate diagnosis, only biopsy samples with a length of at least 15 mm and containing at least 10 portal tracts were included in the study. NAFLD activity score (NAS) and fibrosis were assessed using the NASH‐CRN histologic system. MASH was defined by the presence of steatosis, lobular inflammation, and ballooning. 25 The severity of fibrosis was staged from 0 to 4. Early MASH was defined as MASH with no or mild fibrosis (F0‐F1), and at‐risk MASH as MASH with NAS ≥ 4 and concomitant ≥ F2. Given the possibility of “burn out” MASH, all patients with advanced fibrosis were considered as at‐risk for MASH.
OWLiver panel
OWLiver DM2 and MASEF Score 18 are serum‐based BMI‐dependent lipidomic tests that discriminate between isolated steatosis and MASH, and not at‐risk MASH and at‐risk MASH, respectively. These tests were developed and validated in multi‐ethnic population, aged 18 or above.
The individual algorithms, OWLiver DM2 and MASEF, are multivariable logistic regression algorithms that combine a panel of 16 and 12 lipid species, respectively, with BMI, ALT and AST to obtain a predicted probability score (ranging from 0 to 1) of MASH (OWLiver DM2) or of at‐risk MASH (MASEF).
Both tests could be run sequentially using an algorithm called OWLiver Panel. With this algorithm, patients are first classified as at‐risk MASH or not at‐risk MASH using the MASEF score and then, those not at‐risk MASH, are subsequently classified as isolated steatosis or MASH using the OWLiver DM2 score. Cutoff values were those previously published. 18 , 26
Statistical analysis
Qualitative variables were expressed as absolute value and corresponding proportion, and quantitative variables as mean and standard deviation. Missing values were excluded. Categorical variables were analyzed using chi‐square test, and continuous variables with the Mann–Whitney U test.
For single test analysis, test performances have been measured using the Receiver Operating Characteristic (ROC) curve, a graphical method used to evaluate the performance of a binary classification model. The ROC curve displays the trade‐off between sensitivity (true positive rate) and specificity (true negative rate) across a range of classification thresholds. Package pROC 1.17.0.1 was used to calculate area under the ROC curves (AUC) and compare AUCs between subgroups (presence of class III obesity, diabetes control, gender, and antidiabetic medication use) with DeLong's test. Accuracy, sensitivity, specificity, negative predictive value (NPV) and positive predictive value (PPV) were also calculated for each test.
For a combination of tests, performances have been measured using scores of accuracy, sensitivity, specificity, NPV and PPV. In the graphs, these estimated scores have been plotted together with 95% confidence intervals, being calculated as exact binomial confidence limits using package “epiR” v2.0.41. In tables, performance scores have been reported along with standard error.
RESULTS
Baseline characteristics of study subjects
A total of 224 patients were recruited for the study. However, only patients who had liver biopsy, VCTE, and laboratory tests within a 6‐month period (n = 124) were considered for the analysis. The patients' characteristics are summarized in Table 1.
TABLE 1.
Clinical and biochemical characteristics of the patients included in the study.
| Isolated steatosis | MASH | p‐value | All | ||
|---|---|---|---|---|---|
| Early MASH | “at‐risk” MASH | ||||
| N | 23 | 35 | 66 | 124 | |
| Age (year) | 60.43 ± 5.14 | 59.37 ± 6.17 | 60.82 ± 5.96 | 0.931 | 60.34 ± 5.87 |
| Gender | Male: 14 (61%) | Male: 9 (26%) | Male: 34 (52%) | 0.112 | Male: 57 (46%) |
| Female: 9 (39%) | Female: 26 (74%) a | Female: 32 (48%) b | Female: 67 (54%) | ||
| BMI | 34.09 ± 5.57 | 36.01 ± 6.13 | 34.17 ± 5.14 | 0.576 | 34.67 ± 5.53 |
| Class III obesity (BMI ≥ 40) | 5 (22%) | 6 (17%) | 8 (12%) | 0.346 | 19 (15%) |
| Abdominal perimeter (cm) | 113.25 ± 16.35 | 114.06 ± 12.3 | 115.01 ± 11.63 | 0.683 | 114.44 ± 12.56 |
| Diabetes mellitus | 23 (100%) | 35 (100%) | 66 (100%) | ‐ | 124 (100%) |
| Arterial hypertension | 13 (57%) | 21 (60%) | 45 (68%) | 0.581 | 79 (64%) |
| Dyslipidemia | 21 (91%) | 20 (57%) a | 47 (71%) | 0.034 | 88 (71%) |
| Glucose (mg/dL) | 123.78 ± 46.55 | 127.94 ± 42.56 | 134.36 ± 42.09 | 0.267 | 130.59 ± 42.92 |
| HbA1c (%) | 6.41 ± 0.96 (n = 18) | 6.52 ± 0.99 (n = 31 | 6.78 ± 0.9 (n = 54) | 0.262 | 6.63 ± 0.94 |
| HOMA‐IR | 5.62 ± 4.65 | 5.34 ± 3.4 | 8 ± 4.98 a , b | 0.132 | 6.78 ± 4.65 |
| AST (U/L) | 33.04 ± 15.17 | 34.26 ± 20.5 | 51.55 ± 30.28 a , b | 0.064 | 43.23 ± 26.86 |
| ALT (U/L) | 46.09 ± 23.64 | 47.77 ± 33.04 | 62.11 ± 43.78 | 0.469 | 55.09 ± 38.36 |
| GGT (U/L) | 73 ± 63.5 | 73.51 ± 95.47 | 136.82 ± 135.36 a , b | 0.085 | 107.11 ± 118.05 |
| Bilirubin (mg/dL) | 0.58 ± 0.33 (23) | 0.59 ± 0.31 (35) | 0.64 ± 0.43 (66) | 0.826 | 0.62 ± 0.38 (124) |
| Albumin (g/dL) | 4.58 ± 0.25 (23) | 4.5 ± 0.35 (34) | 4.53 ± 0.32 (64) | 0.697 | 4.53 ± 0.31 (121) |
| Triglycerides (mg/dL) | 165.52 ± 50.47 | 161.46 ± 76.51 | 187.6 ± 126.21 | 0.666 | 176.03 ± 102.96 |
| Total cholesterol (mg/dL) | 176.39 ± 31.11 | 175.91 ± 26.91 | 180.48 ± 32.75 | 0.725 | 178.44 ± 30.74 |
| LDL cholesterol (mg/dL) | 94.81 ± 26.75 | 96.16 ± 27.26 | 103.37 ± 32.68 | 0.408 | 99.74 ± 30.19 |
| HDL cholesterol (mg/dL) | 45.24 ± 8.92 | 47.91 ± 11.59 | 46.22 ± 11.07 | 0.551 | 46.52 ± 10.82 |
| Platelets (x 109/L) | 231 ± 82.22 | 250 ± 62.58 | 207 ± 68.81 b | 0.579 | 223 ± 71.77 |
| FIB‐4 | 1.39 ± 0.52 (23) | 1.25 ± 0.58 (35) | 2.28 ± 1.49 (66) a , b | 0.146 | 1.82 ± 1.25 (124) |
| NFS | −0.36 ± 1.38 (23) | −0.42 ± 1.08 (34) | 0.17 ± 1.02 (64) b | 0.554 | −0.1 ± 1.14 (121) |
| FAST | 0.38 ± 0.22 (22) | 0.4 ± 0.26 (35) | 0.59 ± 0.24 (66) a , b | 0.023 | 0.5 ± 0.26 (123) |
| LSM (kPa) | 10.47 ± 5.54 | 11.03 ± 4.69 | 17.01 ± 10.12 a , b | 0.005 | 14.11 ± 8.68 |
| LSM > 8.8 kPa | 12 (52%) | 22 (63%) | 55 (83%) a , b | 0.040 | 89 (72%) |
| CAP (dB/m) | 292 ± 80.60 | 309 ± 63.74 | 309 ± 58.71 | 0.258 | 305 ± 64.42 |
Note: Data are presented as mean (standard deviation), or as n (percentage). p values represent comparison among isolated steatosis and MASH groups.
Abbreviations: ALT, alanine aminotransferase; AST, aspartate aminotransferase; BMI, body mass index; CAP, controlled attenuation parameter.; FAST, FibroScan‐aspartate aminotransferase; FIB‐4, Fibrosis‐4 index; GGT, gamma‐glutamyl transferase; HbA1c, hemoglobin A1c; HDL, high density lipoprotein; HOMA‐IR, homeostatic model assessment for insulin resistance; LDL, low density lipoprotein; LSM, liver stiffness measurement; NFS, NAFLD Fibrosis Score.
p < 0.05 compared to isolated steatosis group.
p < 0.05 compared to early MASH group.
Patients were divided into three groups based on results from liver biopsy: Isolated steatosis (n = 23, 18.6%), early MASH (n = 35, 28.2%), and at‐risk MASH (n = 66, 53.2%). Patients with at‐risk MASH were more frequently men and had higher levels of AST, gamma‐glutamyl transferase and LSM by VCTE than the early MASH group. All NITs for liver fibrosis were significantly elevated in patients with at‐risk MASH.
Performance of OWLiver panel for the MASH diagnosis in high‐risk patients
Of the total number of biopsy‐proven MASLDs, the OWLiver Panel identified isolated steatosis in 22 (17.7%) patients, early MASH in 28 (22.6%), and at‐risk MASH in 74 (59.7%). Compared to liver biopsy results, the OWLiver Panel correctly identified 86.1% and 78.8% patients as MASH and at‐risk MASH, respectively (Figure 1). The OWLiver Panel classified as at‐risk MASH 7 patients with isolated steatosis at liver biopsy (30.4%), and as isolated steatosis 5 patients with at‐risk MASH (7.6%) and 9 patients with early MASH at liver biopsy (25.7%) (Figure 1). When used to distinguish between isolated steatosis and MASH, the OWLiver Panel accuracy, sensitivity, specificity, PPV, and NPV were 0.77, 0.86, 0.35, 0.85, and 0.36, respectively.
FIGURE 1.
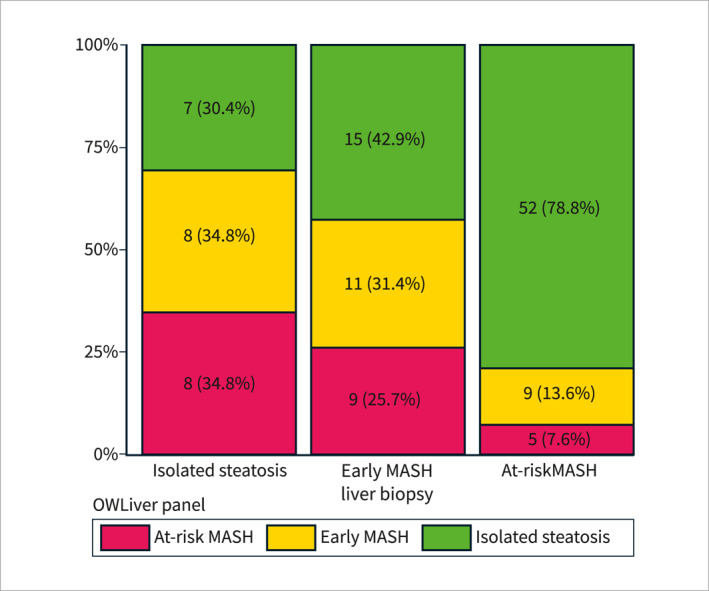
OWLiver Panel for the diagnosis and characterization of metabolic dysfunction‐associated steatotic liver disease in high‐risk subjects. Results of the OWLiver Panel among patients with isolated steatosis, early MASH and at‐risk MASH at liver biopsy.
We examined the role of class III obesity and other variables on test performance. As can be observed in Figure 2 and in Table 1, the OWLiver Panel performed similarly in patients with class III obesity versus patients without class III obesity, men versus women and in patients with good diabetes control (GDC) (defined as HbA1c ≤ 7.0%) versus those with uncontrolled diabetes, since p‐values were higher than 0.1 for all comparisons. Considering that certain antidiabetic medications have demonstrated efficacy in reducing steatosis, we have assessed the influence of sodium‐glucose transport protein two inhibitors (iSGLT2) and/or glucagon‐like peptide 1 agonists (aGLP1) on the OWLiver Panel's diagnostic accuracy. Our analysis revealed no significant performance disparities between patients receiving these treatments and those who do not (Figure 2 and Table 1).
FIGURE 2.
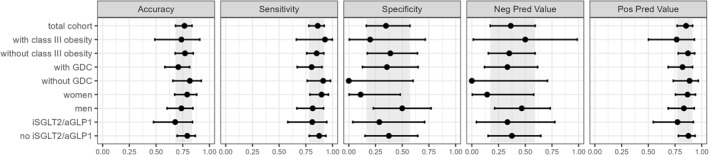
Diagnostic accuracy for MASH using the OWLiver Panel according to the presence of class III obesity, diabetes mellitus control, gender and iSGLT2/aGLP1 treatment. Error bars represent 95% CIs. The gray area corresponds to the 95% CI of the total cohort. CI, confidence interval; GDC, good diabetes control; NPV, negative predictive value; PPV, positive predictive value.
Performance of NITs for the diagnosis of fibrosis due to MASLD in high‐risk patients
Although non‐invasive fibrosis methods are well validated for diagnosing advanced fibrosis, they have shown poor performance for diagnosing significant fibrosis in patients with T2DM or class III obesity. For this reason, we assessed and compared the performance of different easy‐to‐obtain fibrosis methods in our cohort of high‐risk patients, including the metabolomics‐based score. Performance metrics to discriminate patients with significant and advanced fibrosis of MASEF, FIB4, NFS, VCTE and FAST are shown in Table 2. The MASEF score identified 56.5% (13/23) of patients with MASH and F2, and 90.7% (39/43) with MASH and F3‐F4. MASEF significantly outperformed FAST for the identification of at‐risk MASH (sensitivity values of 78.8% vs. 45.5%; p < 0.001). Additionally, MASEF had the highest NPV for both advanced fibrosis and significant fibrosis, while FAST had the highest PPV for significant fibrosis.
TABLE 2.
Accuracy of non‐invasive fibrosis tests for diagnosis of significant and advanced fibrosis.
| Fibrosis diagnosis | Fibrosis test | Cut‐off | Diagnostic accuracy | Se | Sp | NPV | PPV |
|---|---|---|---|---|---|---|---|
| Significant fibrosis | MASEF | 0.33 | 71.0 ± 4.0 | 78.8 ± 4.6 | 62.1 ± 6.3 | 72.0 ± 6.0 | 70.3 ± 5.1 |
| FIB‐4 | 1.3 | 64.5 ± 4.3 | 72.7 ± 5.3 | 55.2 ± 6.7 | 64.0 ± 6.7 | 64.9 ± 5.5 | |
| NFS | −1.455 | 54.5 ± 4.6 | 92.2 ± 2.7 | 12.3 ± 5.8 | 58.3 ± 13.5 | 54.1 ± 4.9 | |
| VCTE | 7.6 | 58.9 ± 4.4 | 87.9 ± 3.4 | 25.9 ± 6.7 | 65.2 ± 9.4 | 57.4 ± 5.0 | |
| FAST | 0.67 | 64.2 ± 4.3 | 45.5 ± 6.5 | 86.0 ± 3.9 | 57.6 ± 5.5 | 78.9 ± 5.9 | |
| Advanced fibrosis | MASEF | 0.33 | 68.5 ± 4.1 | 90.7 ± 3.4 | 56.8 ± 5.6 | 92.0 ± 3.0 | 52.7 ± 6.0 |
| FIB‐4 | 2.67 | 71.0 ± 4.0 | 27.9 ± 8.1 | 93.8 ± 2.1 | 71.0 ± 4.3 | 70.6 ± 9.7 | |
| NFS | 0.676 | 68.6 ± 4.1 | 39.5 ± 8.2 | 84.6 ± 3.7 | 71.7 ± 4.5 | 58.6 ± 9.1 | |
| VCTE | 8.8 | 54.8 ± 4.6 | 90.7 ± 3.4 | 35.8 ± 5.8 | 87.9 ± 4.4 | 42.9 ± 5.5 | |
| FAST | 0.67 | 66.7 ± 4.2 | 46.5 ± 8.1 | 77.5 ± 4.4 | 72.9 ± 4.6 | 52.6 ± 8.4 |
Note: Statistics are presented as percentage ± SD. Established cut‐off points for each non‐invasive test.
Abbreviations: FAST, FibroScan‐aspartate aminotransferase; FIB‐4, Fibrosis‐4 index; MASEF, metabolomics‐advanced steatohepatitis fibrosis score; NFS, NAFLD fibrosis score; NPV, negative predictive value; PPV, positive predictive value.; Se, sensitivity; Sp, specificity; VCTE, vibration‐controlled transient elastography.
The performance of NITs was overall better for the diagnosis of advanced fibrosis than for significant fibrosis (Figure 3a‐b). The AUC to detect significant fibrosis for MASEF, FIB‐4, NFS, VCTE and FAST were 0.77 (0.68–0.85), 0.76 (0.67–0.84), 0.62 (0.51–0.72), 0.73 (0.64–0.81), and 0.71 (0.62–0.80), respectively. The AUC to detect advanced fibrosis for MASEF, FIB‐4, NFS, VCTE and FAST were 0.80 (0.71–0.88), 0.77 (0.69–0.85), 0.65 (0.55–0.75), 0.72 (0.62–0.81), and 0.67 (0.57–0.77), respectively. MASEF significantly outperformed NFS for the identification of significant fibrosis (p = 0.019) and advanced fibrosis (p = 0.03). The overall performance of MASEF and FAST, FIB‐4, or VCTE was not significantly different. No significant differences were observed in the performance of these tests among patients with class III obesity, without diabetes control, male subjects, or treatment with iSGLT2 and/or aGLP1 (Figure 1 and Table 2).
FIGURE 3.
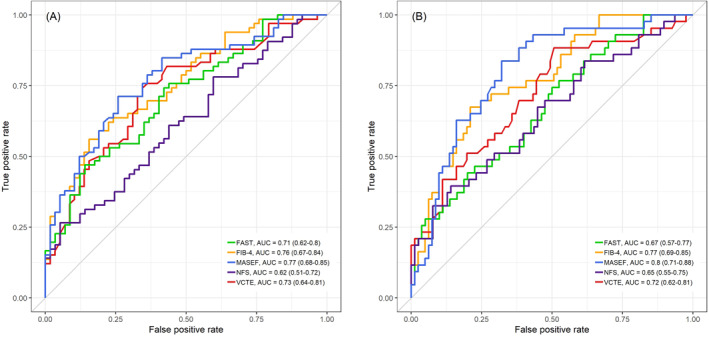
Comparison of AUCs obtained in the study population. Comparisons between MASEF and other NITs for the diagnosis of (a) significant and (b) advanced fibrosis in high‐risk patients. AUC, area under the receiver operating characteristic curve; FAST, FibroScan‐aspartate aminotransferase; FIB‐4, Fibrosis‐4 index; MASEF, Metabolomics‐Advanced Steatohepatitis Fibrosis Score; NFS, NAFLD Fibrosis Score; NITs, non‐invasive tests; VCTE, vibration‐controlled transient elastography.
Performance of combination of NITs for the diagnosis of at‐risk MASH
Several algorithms, combining blood tests and VCTE, have been proposed for the identification of patients at greater risk of MASLD progression, especially in primary care settings and using widely available and easy‐to‐obtain blood test. 27 , 28 Therefore, we evaluated different sequential (one initial test followed by additional test if significant fibrosis risk is identified) and parallel (using two tests at the same time) combinations of blood tests for the identification of patients with significant fibrosis. Table 3 shows the sensitivity, specificity, PPV, and NPV for all these combinations. As can be observed, an algorithm with MASEF showed greater accuracy for the diagnosis of at‐risk MASH. Using MASEF and NFS at the same time for the diagnosis of at‐risk MASH resulted in a proportion of true results of 71.1% (±4.0). Classifying as at‐risk MASH when at least one out of these two tests was positive, the PPV was 72.3% (±5.3). Classifying as negative for at‐risk MASH if both tests were negative, then the NPV was 69.6% (±5.9). However, the combination of MASEF with any other NIT did not show any benefit to the use of MASEF alone (Figure 4). Only its combination with FIB‐4 (at the same time or before) or VCTE got to minimally improve the PPV, from 70.3% (±5.1) to 73.7% (±5.5) and 73.4% (±5.3), respectively.
TABLE 3.
Accuracy of sequential testing for the diagnosis of significant fibrosis.
| Sequential/parallel tests | Cut‐off | N | Diagnostic accuracy (%) | Se | Sp | NPV | PPV |
|---|---|---|---|---|---|---|---|
| MASEF | 0.33 | 124 | 71.0 ± 4.0 | 78.8 ± 4.6 | 62.1 ± 6.3 | 72.0 ± 6.0 | 70.3 ± 5.1 |
| FIB‐4 → NFS | 1.3–2.67/−1.544 | 123 | 64.2 ± 4.3 | 72.3 ± 5.3 | 55.2 ± 6.7 | 64.0 ± 6.7 | 64.4 ± 5.6 |
| NFS → FIB‐4 | −1.544–0.676/1.3 | 121 | 62.0 ± 4.4 | 71.9 ± 5.4 | 50.9 ± 6.9 | 61.7 ± 7.0 | 62.2 ± 5.6 |
| FIB‐4 + NFS | 1.3/−1.544 | 122 | 63.9 ± 4.3 | 71.9 ± 5.4 | 55.2 ± 6.7 | 64.0 ± 6.7 | 63.9 ± 5.6 |
| FIB‐4 → MASEF | 1.3–2.67/0.33 | 124 | 68.5 ± 4.1 | 63.6 ± 5.9 | 74.1 ± 5.4 | 64.2 ± 5.8 | 73.7 ± 5.5 |
| FIB‐4 + MASEF | 1.3/0.33 | 124 | 68.5 ± 4.1 | 63.6 ± 5.9 | 74.1 ± 5.4 | 64.2 ± 5.8 | 73.7 ± 5.5 |
| NFS → MASEF | −1.544–0.676/0.33 | 121 | 69.4 ± 4.1 | 79.7 ± 4.6 | 57.9 ± 6.6 | 71.7 ± 6.3 | 68.0 ± 5.3 |
| NFS + MASEF | −1.544/0.33 | 121 | 71.1 ± 4.0 | 73.4 ± 5.3 | 68.4 ± 6.0 | 69.6 ± 5.9 | 72.3 ± 5.3 |
| MASEF → VCTE | 0.33/7.6 | 124 | 71.0 ± 4.0 | 71.2 ± 5.4 | 70.7 ± 5.7 | 68.3 ± 5.8 | 73.4 ± 5.3 |
| FIB‐4 → VCTE | 1.3–2.67/7.6 | 124 | 66.1 ± 4.2 | 66.7 ± 5.7 | 65.5 ± 6.1 | 63.3 ± 6.2 | 68.8 ± 5.6 |
| FIB‐4 + VCTE | 1.3/7.6 | 124 | 65.3 ± 4.2 | 65.2 ± 5.8 | 65.5 ± 6.1 | 62.3 ± 6.2 | 68.3 ± 5.7 |
Note: Statistics are presented as percentage ± SD.
Abbreviations: FIB‐4, Fibrosis‐4 index; MASEF, metabolomics‐advanced steatohepatitis fibrosis Score; NFS, NAFLD fibrosis score; NPV, negative predictive value; PPV, positive predictive value.; Se, sensitivity; Sp, specificity; VCTE, vibration‐controlled transient elastography.
FIGURE 4.
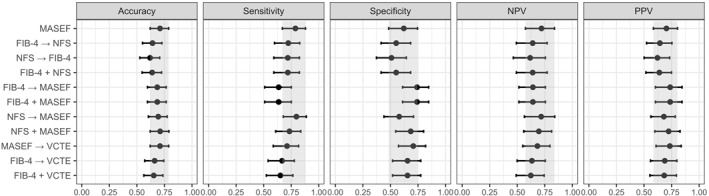
Diagnostic accuracy for significant fibrosis using different combinations of NITs in study population. Error bars represent 95% CIs. The gray area corresponds to the 95% CI of MASEF alone. CI, confidence interval; FAST, FibroScan‐aspartate aminotransferase; FIB‐4, Fibrosis‐4 index; MASEF, Metabolomics‐Advanced Steatohepatitis Fibrosis Score; NFS, NAFLD Fibrosis Score; NITs, non‐invasive tests; NPV, negative predictive value; PPV, positive predictive value; VCTE, vibration‐controlled transient elastography.
DISCUSSION
In this study, we assessed the ability of existing lipidomic scores, OWLiver Panel, to be used as a tool for screening of MASH and significant fibrosis in a high‐risk population for MASLD, such as subjects over 50 years of age with T2DM and BMI over 25 kg/m2. Besides, we compared the most widely available NITs for the diagnosis of at‐risk MASH or advanced fibrosis in this population. Overall, the OWLiver Panel, using a one‐step approach, has high accuracy in predicting the presence of isolated steatosis and MASH as well as significant fibrosis in subjects at high‐risk for MASLD, and showed higher performance compared to non‐patented blood tests and their combinations for identifying at‐risk MASH.
Today, the major challenge for physicians is to identify MASLD patients who develop advanced fibrosis and have an unfavorable outcome. Given that T2DM, age, and obesity are well‐established risk factors for the development and progression of MASLD, 1 , 29 the evaluation of screening strategies for detecting liver fibrosis in these subjects is a priority. A recent individual patient data meta‐analysis evaluated some of the most widely available NITs such as VCTE, FIB‐4 and NFS, showing AUCs of 0.85, 0.76 and 0.73 for advanced fibrosis, respectively. 30 However, the performance of NITs for the diagnosis of liver fibrosis has not been carefully assessed in individuals at high‐risk for MASLD. Indeed, several studies have shown worse diagnostic performance of NITs in patients with obesity, 11 and patients with diabetes. 10 , 12 In our study cohort of overweight/obese and diabetic patients, the performance of NFS was found to be inadequate, with AUC of ∼0.60 for both significant and advanced fibrosis. Notably, the MASEF score achieved an AUC of 0.80 (0.71–0.88) for advanced fibrosis and 0.77 (0.68–0.85) for significant fibrosis, demonstrating strong performance among the NITs evaluated.
MASEF is a metabolomics‐driven score recently development and validate using 1355 biopsy‐proven MASLD patients from international tertiary centers to identify at‐risk MASH, showing a good diagnostic accuracy with an AUC of 0.79 (0.75–0.83). 18 It is a diagnostic accuracy similar to what we showed in our cohort of MASLD high‐risk subjects (AUC 0.77). Patients with bridging fibrosis or cirrhosis are at the highest risk of future liver‐related morbidity, 31 but liver inflammation is considered as an important marker for disease activity and a trigger of fibrosis progression and clinical outcomes 32 ; thus, early detection of MASH and significant fibrosis (at‐risk MASH) provides a potential opportunity to positively affect liver health. This need for early‐stage diagnosis of MASLD is becoming increasingly relevant since efficacious drug treatments are likely to be available within the next few years, and will need to be targeted at those with the greatest risk of disease‐related morbidity. In our study, the application of MASEF in subjects at high‐risk for MASLD was able to detect 78.8% of patients with at‐risk MASH, and showed good sensitivity (78.8% and 90.7%) and the highest NPV (72.0% and 92.0%) for both significant and advanced fibrosis, respectively, suggesting that MASEF is a good screening tool to detect patients at the highest risk of liver disease progression. Another NIT developed for the detection of at‐risk MASH is the FAST score, which also showed a good diagnostic accuracy with an AUC of 0.80 (0.76–0.85). 22 However, the performance of FAST in our cohort of patients was lower (AUC 0.71 [0.62–0.80]), with a poor sensitivity (45.5%).
The most used NITs for the evaluation of liver fibrosis have excellent NPVs to confidently exclude advanced fibrosis, but also have high rates of false positive results and wide gray zone, limiting their ability to affirm the diagnosis. 8 Several studies have shown that combining NITs helps to reduce this gray zone and furthermore increases the PPV. 27 , 28 The use of sequential and parallel combinations of NITs was also assessed in our study. No major significant improvements in the overall performance were observed when these strategies were tested. Indeed, the use of MASEF alone or algorithms with MASEF showed numerically higher accuracy for the diagnosis of at‐risk MASH than algorithms without MASEF.
One advantage of metabolomics‐driven scores is that while the FAST score relies on the availability of VCTE, MASEF only requires serum. Moreover, with the application of OWLiver DM2 together with the MASEF score (OWLiver Panel) in the same blood sample, it is possible to discriminate between isolated steatosis and MASH. In our study, the OWLiver Panel showed a good sensitivity (86%) and PPV (85%) for MASH diagnosis. Among the MASH patients in our cohort (n = 101), only 14 patients (13.9%) were classified as isolated steatosis by the OWLiver Panel. Therefore, the OWLiver Panel can discriminate with great accuracy the different stages of MASLD among high‐risk MASLD subjects with a simple blood test. The identification and grading of MASLD are essential components for a comprehensive assessment of this liver disease. Indeed, defining the severity of MASLD will become even more important as effective treatment options become available.
Serum lipidomics profiles can depend on the level of obesity and glycemia. 16 , 17 , 33 However, we showed that the OWLiver Panel performed similarly in patients with class III obesity and those without class III obesity, in patients with GDC and those with uncontrolled diabetes and, between men and women. It is significant to note that whereas the previous OWLiver Test, designed to differentiate between steatosis and MASH, was derived from a non‐diabetic population, 17 the development of the OWLiver Panel took into account a variety of populations with differing diabetic statuses. 18 , 34
Strengths of our study include the participation of several centers and the inclusion of only subjects with liver histology. Furthermore, the high prevalence of MASH and significant fibrosis in our study cohort makes it relevant to routine practice. However, our study has some limitations. First, the predominantly Caucasian composition of our participant cohort and the small sample size may limit the generalizability of our findings. Second, potential selection bias was due to our study population being from a tertiary care setting and undergoing liver biopsy. These limitations underscore the need for cautious interpretation of our conclusions and suggest that further studies with larger cohorts are necessary to validate our findings and ensure their applicability to a wider patient demographic. Second, histology results were not centralized and variability in recognition of elementary lesions or composite diagnosis might have occurred. Third, the absence of a cost‐benefit analysis, which restricts our ability to assess the economic feasibility and practicality of implementing the OWLiver Panel in routine clinical practice. Finally, although our study examined some of the most widely available NITs, other NITs developed for the diagnosis of at‐risk MASH have not been measured; therefore, this should be explored in future studies.
In conclusion, the one‐step screening approach using the OWLiver Panel demonstrates a reliable level of accuracy in identifying advanced fibrosis, and MASH with significant fibrosis among individuals at high risk for MASLD. Its application could be considered beneficial in populations with high risk of MASLD from primary care and endocrinology settings, potentially reducing the need for additional diagnostic testing. This approach may improve the care pathway for this prevalent liver disease.
AUTHOR CONTRIBUTIONS
Study concept and design: Paula Iruzubieta, Rebeca Mayo, Javier Crespo. Acquisition of data: Paula Iruzubieta, María Teresa Arias‐Loste, Luis Ibañez‐Samaniego, Javier Ampuero, Javier Abad, Rosa Martín‐Mateos, Ana Belén Fernández‐Laso. Analysis and interpretation of data: Paula Iruzubieta, Rebeca Mayo, Itziar Mincholé, Ibon Martínez‐Arranz, Javier Crespo. Drafting of the manuscript: Paula Iruzubieta, Rebeca Mayo, Javier Crespo. Critical review of the manuscript: All authors. Administrative, technical, or material support: Paula Iruzubieta, Rebeca Mayo, Itziar Mincholé, Ibon Martínez‐Arranz. Study supervision: Javier Crespo. All authors have made a significant contribution to this study and have approved the final manuscript.
CONFLICT OF INTEREST STATEMENT
JC reports consultant and/or speaker and/or participated in clinical trials sponsored and/or received grants and research support from Gilead Sciences, AbbVie, MSD, Shionogi, Intercept Pharmaceuticals, Janssen Pharmaceuticals Inc, Celgene, and Alexion (all outside the submitted work). RM, IM‐A, IM, PO are OWL Metabolomics' employees. PI, MA‐L, LI‐S, JAm, JAb, RM‐M, AF‐L, AA, RB, JLC, MR‐G and RA have no conflict of interest related to this publication.
ETHICS APPROVAL
The study was carried out in accordance with the principles of the Helsinki Declaration and approved by the Ethics Committees for Clinical Research of the different participating hospitals in Spain. All the participants signed the corresponding written informed consent form.
Supporting information
Supporting Information S1
ACKNOWLEDGMENTS
We gratefully acknowledge the patients for their participation in this study. We thank Lorena Cayon, Sara Arias and Ana Álvarez for their excellent technical assistance. The work was supported in part by a brant from the Spanish Carlos III Health Institute (ISCIII) (J. Crespo [FIS PI18/01304, and PI22/01853] and Pfizer [MK‐ESNASRDL‐13]).
Iruzubieta P, Mayo R, Mincholé I, Martínez‐Arranz I, Arias‐Loste MT, Ibañez‐Samaniego L, et al. One‐step non‐invasive diagnosis of metabolic dysfunction‐associated steatohepatitis and fibrosis in high‐risk population. United European Gastroenterol J. 2024;12(7):919–29. 10.1002/ueg2.12589
Paula Iruzubieta and Rebeca Mayo are joint first authors.
DATA AVAILABILITY STATEMENT
The clinical data and results of NITs used to support the findings of this study are available from the corresponding author at javiercrespo1991@gmail.com upon request.
REFERENCES
- 1. Younossi Z, Anstee QM, Marietti M, Hardy T, Henry L, Eslam M, et al. Global burden of NAFLD and NASH: trends, predictions, risk factors and prevention. Nat Rev Gastroenterol Hepatol. 2018;15(1):11–20. 10.1038/NRGASTRO.2017.109 [DOI] [PubMed] [Google Scholar]
- 2. McPherson S, Hardy T, Henderson E, Burt AD, Day CP, Anstee QM. Evidence of NAFLD progression from steatosis to fibrosing‐steatohepatitis using paired biopsies: implications for prognosis and clinical management. J Hepatol. 2015;62(5):1148–1155. 10.1016/j.jhep.2014.11.034 [DOI] [PubMed] [Google Scholar]
- 3. Dulai PS, Singh S, Patel J, Soni M, Prokop LJ, Younossi Z, et al. Increased risk of mortality by fibrosis stage in nonalcoholic fatty liver disease: systematic review and meta‐analysis. Hepatology. 2017;65(5):1557–1565. 10.1002/hep.29085 [DOI] [PMC free article] [PubMed] [Google Scholar]
- 4. Lazarus JV, Mark HE, Anstee QM, Arab JP, Batterham RL, Castera L, et al. Advancing the global public health agenda for NAFLD: a consensus statement. Nat Rev Gastroenterol Hepatol. 2022;19(1):60–78. 10.1038/S41575-021-00523-4 [DOI] [PubMed] [Google Scholar]
- 5. Stepanova M, Rafiq N, Makhlouf H, Agrawal R, Kaur I, Younoszai Z, et al. Predictors of all‐cause mortality and liver‐related mortality in patients with non‐alcoholic fatty liver disease (NAFLD). Dig Dis Sci. 2013;58(10):3017–3023. 10.1007/s10620-013-2743-5 [DOI] [PubMed] [Google Scholar]
- 6. Bedossa P, Tordjman J, Aron‐Wisnewsky J, Poitou C, Oppert JM, Torcivia A, et al. Systematic review of bariatric surgery liver biopsies clarifies the natural history of liver disease in patients with severe obesity. Gut. 2016;66(9):1688–1696. gutjnl‐2016‐312238. 10.1136/gutjnl-2016-312238 [DOI] [PubMed] [Google Scholar]
- 7. Pais R, Charlotte F, Fedchuk L, Bedossa P, Lebray P, Poynard T, et al. A systematic review of follow‐up biopsies reveals disease progression in patients with non‐alcoholic fatty liver. J Hepatol. 2013;59(3):550–556. 10.1016/j.jhep.2013.04.027 [DOI] [PubMed] [Google Scholar]
- 8. Xiao G, Zhu S, Xiao X, Yan L, Yang J, Wu G. Comparison of laboratory tests, ultrasound, or magnetic resonance elastography to detect fibrosis in patients with nonalcoholic fatty liver disease: a meta‐analysis. Hepatology. 2017;66(5):1486–1501. 10.1002/HEP.29302 [DOI] [PubMed] [Google Scholar]
- 9. Caussy C, Chen J, Alquiraish MH, Cepin S, Nguyen P, Hernandez C, et al. Association between obesity and discordance in fibrosis stage determination by magnetic resonance vs transient elastography in patients with nonalcoholic liver disease. Clin Gastroenterol Hepatol. 2018;16(12):1974–1982.e7. 10.1016/J.CGH.2017.10.037 [DOI] [PMC free article] [PubMed] [Google Scholar]
- 10. Kim RG, Deng J, Reaso JN, Grenert JP, Khalili M. Noninvasive fibrosis screening in fatty liver disease among vulnerable populations: impact of diabetes and obesity on FIB‐4 score accuracy. Diabetes Care. 2022;45(10):2449–2451. 10.2337/DC22-0556 [DOI] [PMC free article] [PubMed] [Google Scholar]
- 11. Petta S, Wai‐Sun Wong V, Bugianesi E, Fracanzani AL, Cammà C, Hiriart JB, et al. Impact of obesity and alanine aminotransferase levels on the diagnostic accuracy for advanced liver fibrosis of noninvasive tools in patients with nonalcoholic fatty liver disease. Am J Gastroenterol. 2019;114(6):916–928. 10.14309/AJG.0000000000000153 [DOI] [PubMed] [Google Scholar]
- 12. Singh A, Gosai F, Siddiqui MT, Gupta M, Lopez R, Lawitz E, et al. Accuracy of noninvasive fibrosis scores to detect advanced fibrosis in patients with type‐2 diabetes with biopsy‐proven nonalcoholic fatty liver disease. J Clin Gastroenterol. 2020;54(10):891–897. 10.1097/MCG.0000000000001339 [DOI] [PubMed] [Google Scholar]
- 13. Boursier J, Canivet CM, Costentin C, Lannes A, Delamarre A, Sturm N, et al. Impact of type 2 diabetes on the accuracy of noninvasive tests of liver fibrosis with resulting clinical implications. Clin Gastroenterol Hepatol. 2023;21(5):1243–1251.e12. 10.1016/J.CGH.2022.02.059 [DOI] [PubMed] [Google Scholar]
- 14. Castera L, Friedrich‐Rust M, Loomba R. Noninvasive assessment of liver disease in patients with nonalcoholic fatty liver disease. Gastroenterology. 2019;156(5):1264–1281.e4. 10.1053/j.gastro.2018.12.036 [DOI] [PMC free article] [PubMed] [Google Scholar]
- 15. Alonso C, Noureddin M, Lu SC, Mato JM. Biomarkers and subtypes of deranged lipid metabolism in non‐alcoholic fatty liver disease. World J Gastroenterol. 2019;25(24):3009–3020. 10.3748/WJG.V25.I24.3009 [DOI] [PMC free article] [PubMed] [Google Scholar]
- 16. Barr J, Caballería J, Martínez‐Arranz I, Domínguez‐Díez A, Alonso C, Muntané J, et al. Obesity‐dependent metabolic signatures associated with nonalcoholic fatty liver disease progression. J Proteome Res. 2012;11(4):2521–2532. 10.1021/pr201223p [DOI] [PMC free article] [PubMed] [Google Scholar]
- 17. Mayo R, Crespo J, Martínez‐Arranz I, Banales JM, Arias M, Mincholé I, et al. Metabolomic‐based noninvasive serum test to diagnose nonalcoholic steatohepatitis: results from discovery and validation cohorts. Hepatol Commun. 2018;2(7):807–820. 10.1002/hep4.1188 [DOI] [PMC free article] [PubMed] [Google Scholar]
- 18. Noureddin M, Truong E, Mayo R, Martínez‐Arranz I, Mincholé I, Banales JM, et al. Serum identification of at‐risk MASH: the metabolomics‐advanced steatohepatitis fibrosis score (MASEF). Hepatology. 2024;79(1):135–148. 10.1097/HEP.0000000000000542 [DOI] [PMC free article] [PubMed] [Google Scholar]
- 19. Ampuero J, Aller R, Gallego‐Durán R, Crespo J, Calleja JL, García‐Monzón C, et al. Significant fibrosis predicts new‐onset diabetes mellitus and arterial hypertension in patients with NASH. J Hepatol. 2020;73(1):17–25. 10.1016/j.jhep.2020.02.028 [DOI] [PubMed] [Google Scholar]
- 20. Sterling RK, Lissen E, Clumeck N, Sola R, Correa MC, Montaner J, et al. Development of a simple noninvasive index to predict significant fibrosis in patients with HIV/HCV coinfection. Hepatology. 2006;43(6):1317–1325. 10.1002/hep.21178 [DOI] [PubMed] [Google Scholar]
- 21. Angulo P, Hui JM, Marchesini G, Bugianesi E, George J, Farrell GC, et al. The NAFLD fibrosis score: a noninvasive system that identifies liver fibrosis in patients with NAFLD. Hepatology. 2007;45(4):846–854. 10.1002/hep.21496 [DOI] [PubMed] [Google Scholar]
- 22. Newsome PN, Sasso M, Deeks JJ, Paredes A, Boursier J, Chan WK, et al. FibroScan‐AST (FAST) score for the non‐invasive identification of patients with non‐alcoholic steatohepatitis with significant activity and fibrosis: a prospective derivation and global validation study. Lancet Gastroenterol Hepatol. 2020;5(4):362–373. 10.1016/S2468-1253(19)30383-8 [DOI] [PMC free article] [PubMed] [Google Scholar]
- 23. Shah AG, Lydecker A, Murray K, Tetri BN, Contos MJ, Sanyal AJ. Comparison of noninvasive markers of fibrosis in patients with nonalcoholic fatty liver disease. Clin Gastroenterol Hepatol. 2009;7(10):1104–1112. 10.1016/j.cgh.2009.05.033 [DOI] [PMC free article] [PubMed] [Google Scholar]
- 24. Hsu C, Caussy C, Imajo K, Chen J, Singh S, Kaulback K, et al. Magnetic resonance vs transient elastography analysis of patients with nonalcoholic fatty liver disease: a systematic review and pooled analysis of individual participants. Clin Gastroenterol Hepatol. 2019;17(4):630–637.e8. 10.1016/J.CGH.2018.05.059 [DOI] [PMC free article] [PubMed] [Google Scholar]
- 25. Kleiner DE, Brunt EM, Van Natta M, Behling C, Contos MJ, Cummings OW, et al. Design and validation of a histological scoring system for nonalcoholic fatty liver disease. Hepatology. 2005;41(6):1313–1321. 10.1002/hep.20701 [DOI] [PubMed] [Google Scholar]
- 26. Ortiz P, Minchole I, Mayo R, et al. Serum metabolomics‐based steatohepatitis score for the noninvasive identification of patients with non‐alcoholic steatohepatitis (NASH) in multiethnic, including type 2 diabetes mellitus population. J Hepatol. 2021;75((Suppl 2)):S294–S803. [Google Scholar]
- 27. Petta S, Wong VWS, Cammà C, Hiriart J, Wong GL, Vergniol J, et al. Serial combination of non‐invasive tools improves the diagnostic accuracy of severe liver fibrosis in patients with NAFLD. Aliment Pharmacol Ther. 2017;46(6):617–627. 10.1111/APT.14219 [DOI] [PubMed] [Google Scholar]
- 28. Boursier J, Guillaume M, Leroy V, Irlès M, Roux M, Lannes A, et al. New sequential combinations of non‐invasive fibrosis tests provide an accurate diagnosis of advanced fibrosis in NAFLD. J Hepatol. 2019;71(2):389–396. 10.1016/J.JHEP.2019.04.020 [DOI] [PubMed] [Google Scholar]
- 29. Ajmera V, Cepin S, Tesfai K, Hofflich H, Cadman K, Lopez S, et al. A prospective study on the prevalence of NAFLD, advanced fibrosis, cirrhosis and hepatocellular carcinoma in people with type 2 diabetes. J Hepatol. 2023;78(3):471–478. 10.1016/J.JHEP.2022.11.010 [DOI] [PMC free article] [PubMed] [Google Scholar]
- 30. Mózes FE, Lee JA, Selvaraj EA, Jayaswal ANA, Trauner M, Boursier J, et al. Diagnostic accuracy of non‐invasive tests for advanced fibrosis in patients with NAFLD: an individual patient data meta‐analysis. Gut. 2022;71(5):1006–1019. 10.1136/GUTJNL-2021-324243 [DOI] [PMC free article] [PubMed] [Google Scholar]
- 31. Angulo P, Kleiner DE, Dam‐Larsen S, Adams LA, Bjornsson ES, Charatcharoenwitthaya P, et al. Liver fibrosis, but No other histologic features, is associated with long‐term outcomes of patients with nonalcoholic fatty liver disease. Gastroenterology. 2015;149(2):389–397.e10. 10.1053/j.gastro.2015.04.043 [DOI] [PMC free article] [PubMed] [Google Scholar]
- 32. Singh S, Allen AM, Wang Z, Prokop LJ, Murad MH, Loomba R. Fibrosis progression in nonalcoholic fatty liver vs nonalcoholic steatohepatitis: a systematic review and meta‐analysis of paired‐biopsy studies. Clin Gastroenterol Hepatol. 2015;13(4):643–654.e1‐9. quiz e39‐40. 10.1016/j.cgh.2014.04.014 [DOI] [PMC free article] [PubMed] [Google Scholar]
- 33. Bril F, Millán L, Kalavalapalli S, McPhaul MJ, Caulfield MP, Martinez‐Arranz I, et al. Use of a metabolomic approach to non‐invasively diagnose non‐alcoholic fatty liver disease in patients with type 2 diabetes mellitus. Diabetes Obes Metabol. 2018;20(7):1702–1709. https://pubmed.ncbi.nlm.nih.gov/29527789/ Accessed 21 Feb 2021. [DOI] [PubMed] [Google Scholar]
- 34. Martínez‐Arranz I, Mayo R, Banales J, et al. Non‐Invasive serum lipidomic approach to discriminate non‐alcoholic steatohepatitis in multiethnic patients with type 2 diabetes mellitus. Hepatology. 2019;70:1030A. [Google Scholar]
Associated Data
This section collects any data citations, data availability statements, or supplementary materials included in this article.
Supplementary Materials
Supporting Information S1
Data Availability Statement
The clinical data and results of NITs used to support the findings of this study are available from the corresponding author at javiercrespo1991@gmail.com upon request.