

Abstract
ATP13A4 is a member of the subfamily of P5-type ATPases. P5-type ATPases are the least studied of the P-type ATPase subfamilies with no ion specificities assigned to them. In order to elucidate ATP13A4 function, we studied the protein’s subcellular localization and tested whether it is involved in calcium regulation. The intracellular calcium concentration was measured in COS-7 cells over-expressing mouse ATP13A4 using ratiometric calcium imaging with fura-2 AM as a calcium indicator. The results of this study show that ATP13A4 is localized to the endoplasmic reticulum (ER). Furthermore, we demonstrate that over-expression of ATP13A4 in COS-7 cells caused a significant increase in the intracellular calcium level. Interestingly, over-expression of the sequence variant containing a substitution of aspartic acid for a glutamic acid (E646D), previously found in patients with autism spectrum disorder (ASD), did not increase the free cellular calcium likely due to the mutation. In this study, we also describe the expression of ATP13A4 during mouse embryonic development. Quantitative real-time PCR revealed that ATP13A4 was highly expressed at embryonic days 15–17, when neurogenesis takes place. The present study is the first to provide further insights into the biological role of a P5-type ATPase. Our results demonstrate that ATP13A4 may be involved in calcium regulation and that its expression is developmentally regulated. Overall, this study provides support for the hypothesis that ATP13A4 may play a vital role in the developing nervous system and its impairment can contribute to the symptoms seen in ASD.
Electronic supplementary material
The online version of this article (doi:10.1007/s10571-009-9445-8) contains supplementary material, which is available to authorized users.
Keywords: P5-type ATPase, ATP13A4 ATPase, fura-2 AM, Intracellular free calcium, Ratiometric calcium imaging, Endoplasmic reticulum, Autism, Language delay
Introduction
P-type ATPases are membrane-bound proteins that facilitate cation transport across biological membranes (Moller et al. 1996). P-type ATPases have been classified into five subfamilies according to their substrate specificities: P1, found in mammals, includes Cd2+-, Cu2+-, and K+-ATPases, P2, also found in mammals, consists of Ca2+-, H+/K+-, and Na+/K+-ATPases, P3, found in bacteria, lower eukaryotes, and plants, includes H+- and Mg2+-ATPases, P4, present in eukaryotes, have been shown to be involved in the transport of aminophospholipids, and P5, found exclusively in eukaryotes, have no substrate specificities assigned to them (Axelsen and Palmgren 1998). A distinguishing feature of P-type ATPases is the formation of a phosphorylated aspartate intermediate (Asp486) during the reaction cycle (hence P-type), which is crucial for ion transport. P-type ATPases of various substrate specificities have several functions. They provide the basis for plasma membrane’s resting and action potentials in nervous tissues and muscles, secretion and reabsorption of solutes in the kidneys, relaxation of muscles, and for calcium-dependent signal transduction (Periasamy and Huke 2001; Jorgensen et al. 2003; Martonosi and Pikula 2003; Jensen et al. 2007).
P5-type ATPases are the least studied of the P-type ATPase subfamilies with no biological function assigned to them. We have recently characterized five human members of the P5-type subfamily of membrane transporters (called ATP13A1 to ATP13A5) (Kwasnicka-Crawford et al. 2005) and an orthologous family of P5-type ATPases have been identified in mice (Schultheis et al. 2004). These proteins have been classified as cation transporters (Kwasnicka-Crawford et al. 2005). The P5-type ATPases are conserved among eukaryotes, as ATP13A1 evolved from the Cod1p orthologue, and ATP13A2–ATP13A5 evolved from the Yor291wp orthologue are found in yeasts (Kwasnicka-Crawford et al. 2005). However, the biological function and substrate specificity of the P5 ATPase subfamily is unknown. Yeast Cod1p, the only described member of the P5 subfamily, has been shown to play a role in cellular calcium homeostasis and endoplasmic reticulum (ER) function (Suzuki and Shimma 1999; Cronin et al. 2000, 2002; Suzuki 2001; Tipper and Harley 2002; Vashist et al. 2002). Because of the crucial role of calcium in neuronal development, there is a great interest in characterizing proteins that are involved in its regulation. Calcium homeostasis is regulated by the major P2-type transporters such as PMCA (plasma membrane calcium ATPase), SERCA (sarcoplasmic/endoplasmic reticulum calcium ATPase), and SPCA (secretory pathway calcium ATPase found in Golgi) (Burette et al. 2003; Wuytack et al. 2003; Xiang et al. 2005). P5-type ATPases could likely represent a new mechanism of calcium regulation. Therefore, it is important to examine whether ATP13A4 and its homologues have a distinct function from the major known calcium pumps.
Calcium plays a crucial role during development of the nervous system (Fitzjohn and Collingridge 2002; Bardo et al. 2006). Calcium signals are essential not only for elementary forms of neuronal communication, such as synaptic transmission, but also for complex brain functions including the induction of memory- and learning-related forms of neuronal plasticity. Alterations of intracellular calcium homeostasis have been shown to play a central role in the pathogenesis of the nervous system. Abnormal calcium homeostasis has been implicated in diseases such as Alzheimer’s, Parkinson’s and Huntington’s disease (Hensley et al. 1994; Bezprozvanny and Hayden 2004; Surmeier 2007). Recent studies also implicate various calcium-dependent genes in the etiology of autism spectrum disorders (ASDs). For example, mutations in genes encoding L- and T-type voltage-gated channels were identified in individuals with ASD (Splawski et al. 2004, 2006). In addition, polymorphisms in genes encoding an NMDA receptor subunit (GRIN2A), subunit 2 of the kainate ionotropic glutamate receptor (GRIK2), or metabotropic glutamate receptor genes (GRM8) have been associated with ASD (Jamain et al. 2002; Serajee et al. 2003; Barnby et al. 2005).
Our previous study showed that ATP13A4 (fourth member of the P5-type subfamily) was disrupted by an inherited inversion on the chromosome 3q25-29 in a patient with expressive and receptive language delay causing a significant reduction in the mRNA level (Kwasnicka-Crawford et al. 2005). This likely caused a reduction of the encoded protein level and contributed to the patient’s clinical features. Moreover, ATP13A4 is located in the close proximity to a new autism locus on the chromosome 3q identified in multiplex founder Finnish families with ASD (Auranen et al. 2002, 2003). Interestingly, we performed screening of the ATP13A4 coding sequence in 32 participants of these studies and found a sequence variant which resulted in the substitution of aspartic acid for a glutamic acid (E646D) in exon 17 in six individuals (Kwasnicka-Crawford et al. 2005). E646D is located between the 4th and 5th transmembrane domains, a region containing the conserved aspartate residue (Asp486) and the nucleotide binding domain (Fig. 1). These findings provide the first evidence for ATP13A4’s putative function and suggest its potential role in ASD.
Fig. 1.

Schematic diagram representing the tertiary structure of the mouse ATP13A4 transporter. The location of the conserved aspartate phosphorylated residue (Asp468) (corresponding to Asp486 in the human sequence), E628D sequence variant previously found in patients with autism (residue 646 in the human sequence), epitope for the rabbit anti-ATP13A4 antibodies (IINRAIRKPDLKVR), and major phosphorylation sites in ATP13A4 are indicated
In the present study, we provide further evidence that ATP13A4 might play an important role in the nervous system and potentially contribute to the etiology of ASD. Functional significance of the E646D sequence variant has been tested experimentally, in this study, using the mouse homologue. The main objectives of the current study are (1) to determine the subcellular localization of ATP13A4, (2) to establish whether ATP13A4 is involved in calcium regulation, (3) to study the functional significance of the E646D sequence variant, and (4) to determine its expression during development. The results presented in this study show for the first time that ATP13A4 resides in the endoplasmic reticulum and that it might be involved in calcium homeostasis. The role of ATP13A4 in regulation of intracellular calcium concentrations ([Ca2+]i) was measured in COS-7 cells over-expressing the protein using the fluorescence dye fura-2 AM. The results of our study show that the wild-type ATP13A4-expressing cells have significantly higher [Ca2+]i likely attributed to the presence of over-expressed ATP13A4. Moreover, cells over-expressing the E>D substitution mutant show no increase in [Ca2+]i when compared to the basal level. These findings show that ATP13A4 may have an intrinsic role in augmenting cellular calcium levels and link this protein to a role in autism spectrum and language delay disorders.
Materials and Methods
Molecular Cloning of Mus musculus ATP13A4 cDNA
In this study, we used Mus musculus ATP13A4 cDNA (NM_172613.3) obtained from the Mammalian Gene Collection. Amino acids D486 and E646 of the human sequence were located at the position 468 and 628 in the mouse ATP13A4 ATPase, respectively (Fig. 1). All primers were designed using the Primer3 Program (http://biotools.umassmed.edu/bioapps/primer3_www.cgi) and synthesized by Sigma–Aldrich. The ATP13A4 cDNA was amplified with forward 5′ GGGGTACCGGAGGAGTCCACTTCGCTAAA-3′ and reverse 5′-CCCTCGAGAAGTTGCTCCTCATTGCTCTC-3′ primers containing KpnI and XhoI restriction sites underlined), respectively. PCR was performed using the mix, which contained each of the two primers, ATP13A4 cDNA, 0.1 mM dNTPs, 0.02 U/µl of the Taq HF iProof DNA polymerase (Biorad), and 1× iPROOF HF buffer (Biorad). The mixture was subjected to 30 cycles of PCR amplification at 98° for 10 s for denaturation, 68° for 20 s for annealing, and 72° for 2 min for primer extension. The resulting 3.7 kb product was subcloned into pCR-BLUNT-II-TOPO (Invitrogen). The cDNA was excised with KpnI and XhoI restriction enzymes and subsequently subcloned into KpnI/XhoI cloning sites of the mammalian expression vector pcDNA3.1/Myc-His(A) (Invitrogen). The complete insert was sequenced (Core Molecular Facility, York University), and the sequence was confirmed using a multiple sequence alignment tool (BLAST, NCBI). In addition, ATP13A4 cDNA was amplified and subcloned into the pDsRed-Monomer-N1 mammalian expression vector (Clontech) for calcium imaging using a forward 5′-CCCTCGAGGGAGGAGTCCACTTCGCTAAA-3′ and reverse 5′-GGTACCGTAAGTTGCTCCTCATTGCTCTC-3′ primer containing XhoI and Kpn I restriction sites (underlined), respectively. Subcloning into the vector and sequencing was performed as described earlier.
Site-Directed Mutagenesis
Introduction of the E628D and D468V mutation in the mouse ATP13A4 sequence (Fig. 1) was generated by PCR using the same conditions as described earlier. A PCR method was used to create the E628D mutation (Supplementary Fig. 1). A forward primer ATP13A4-E628D-F (5′-CCAACTAGTTTTATTAGTGATCTTCAGATTTACACAACAC-3′ (SpeI restriction site is underlined and the mutation site is in bold) and a reverse primer ATP13A4-R1 (5′-CCCTCGAGAAGTTGCTCCTCATTGCTCTC-3′) (XhoI restriction site is underlined) amplified a 1.7 kb fragment between nucleotides 1,864 and 3,530 containing the E628D mutation site. The product was ligated into a pcR-Blunt II-TOPO Vector using the Zero Blunt TOPO PCR Cloning Kit (Invitrogen). A double restriction digest was performed on the isolated plasmid using enzymes SpeI and Xho1. The initial fragment between nucleotide 1 and 1,871 was isolated from the ATP13A4/pcDNA3-Myc-His construct using enzymes KpnI and SpeI. The two fragments KpnI/SpeI and SpeI/Xho1 (containing the E628D mutation) were ligated into KpnI/Xho1 restriction sites of the pcDNA3-Myc-His and pDsRed-Monomer-N1 vectors. The D468V mutation was created in two-step PCR (Supplementary Fig. 2). The first step contained forward primer ATP13A4-F1 (5′-GGGGTACCGGAGGAGTCCACTTCGCTAAA-3′) (KpNI restriction site underlined) and reverse primer ATP13A4-D468V-R (5′-GTTAAGGTGCCTGTCTTGACGAAGCAGACAAGGTTT-3′ (D468V mutation site in bold) and resulted in the amplification of a 1.6 kb fragment between nucleotide −174 and 1,421. The second set included the forward primer ATP14A4-D468V-F (5′-AAACCTTGTCTGCTTCGTCAAGACAGGCACCTTAAC-3′) (D468V mutation site is in bold) and reverse primer ATP13A4-R1 (5′-CCCTCGAGAAGTTGCTCCTCATTGCTCTC-3′) (XhoI restriction site underlined) and amplified a 2.1 kb fragment between nucleotides 1,386 and 3,530. These two fragments, overlapping at the D468V mutation site, were amplified in a single PCR mix using the same PCR conditions as described earlier. The resulting 3.7 kb PCR fragment was ligated into a pCR-Blunt II-TOPO Vector. A sequential restriction digest was performed on the isolated plasmid, pcDNA3-Myc-His and pDsRed-Monomer-N1 vectors using enzymes KpNI and XhoI. The resulting cDNA products were ligated using T4 DNA ligase (Invitrogen). The resulting ATP13A4(D468V)/pcDNA3-Myc-His and ATP13A4(D468V)/pDsRed-Monomer-N1 constructs were used for immunocytochemistry and calcium imaging, respectively.
Cell Culture
COS-7 cells were obtained from the American Tissue Culture Collection (ATCC). Cells were maintained in an incubator containing 5% CO2 at 37°C in Dulbecco’s modified Eagle’s medium (DMEM) (Invitrogen) containing Eagle’s salts and supplemented with penicillin/streptomycin (100 U/ml) and 10% fetal bovine serum (FBS). For transfection, cells were seeded at a density of 7.5 × 10⁵ for 100 mm dishes and 2 × 10⁵ for 35 mm dishes. LipofectAMINE 2000 (Invitrogen) method was used for transient transfection according to the manufacture’s instructions. Transfected cells were incubated for 16–24 h at 37°C in 5% CO2 and fixed with 4% paraformaldehyde for immunocytochemistry or harvested with lysis buffer (1% NP-40, 50 mM HEPES pH 7.2, 250 mM NaCl, 10% glycerol, 2 mM EDTA, 1 mM PMSF, and protease inhibitors (Sigma) for Western blot analysis.
Immunocytochemistry
Cells were seeded onto 35 mm plates containing a poly-d-lysine coated coverslip and kept at 37°C in 5% CO2 for 16–24 h prior to transfection. About 16–24 h following transfection, cells were washed in PBS and fixed in 4% PFA at room temperature for 20 min. Cells were permeabilized with PBS containing 0.3% Triton-X (Sigma; PBS-T) and 2% normal goat serum (NGS) for 15 min, washed with PBS, and incubated with 0.5 mg/ml sodium borohydride for 5 min. Following one wash with PBS, cells were incubated for 1 h with mouse monoclonal anti-myc (Santa Cruz) and either rabbit polyclonal anti-calnexin (Endoplasmic Reticulum; Abcam), rabbit polyclonal anti-GOLPH4 (Golgi Apparatus; ab28049 Abcam), rabbit monoclonal anti-LAMP1 (Lysosomes, Cell Signaling), or rabbit polyclonal anti-COX IV (Mitochondria, Cell Signaling). Cells were washed three times in PBS, incubated with fluorescein isothiocyanate (FITC)-conjugated anti-mouse IgG antibody and Texas Red-conjugated anti-rabbit IgG antibody (Jackson ImmunoResearch) for 1 h. Cells were washed one time in PBS-T, incubated with 4′-6-diamidino-2-phenylindole (DAPI) for 15 min, washed two times with PBS-T for 5 min, mounted on glass slides with mounting media (Vectashield), and visualized using an Eclipse 80i upright fluorescent microscope with a DS-5MC camera (Nikon). We also developed a rabbit anti-mouse polyclonal antibody specific for an epitope INRAIRKPDLKVR, which is conserved among species and located between the first two transmembrane domains (amino acids 117–130; Fig. 1) of Mus musculus ATP13A4 (Affinity Bioreagents). The antibody detected the endogenous ATP13A4 in COS-7 cells and mouse brain lysate with Western blot analysis but not using immunocytochemistry. We believe that the epitope, located in the cation ATPase region, is likely inaccessible to the antibody in the protein’s native form.
Western Blot Analysis
COS-7 cells transfected with either ATP13A4/pcDNA3/Myc-His(A) or pcDNA3/Myc-His(A) empty vector were lysed in ice-cold membrane extraction (ME) buffer (20 mM Tris–HCl, 250 mM NaCl, 15% glycerol, 1 mM DTT, 1% NP40, 1 mM PMSF, protease inhibitor cocktail), sonicated, and centrifuged at 10,000g for 10 min at 4°C. Brain tissues were homogenized in ice-cold sucrose lysis buffer (0.25 M sucrose, 10 mM Tris–HCl, 150 mM NaCl, 1 mM EDTA, 1 mM PMSF, protease inhibitor cocktail), and centrifuged at 800g for 10 min. The supernatant was resuspended in ice-cold ME buffer. The samples were run on a polyacrylamide gel (30% acrylamide, 1.5 M Tris pH 8.8, 20% sodium dodecyl sulfate (SDS), 10% ammonium persulfate (APS), and N,N,N′,N′-tetramethylethylenediamine (TEMED) and dH2O to a final concentration of 8% polyacrylamide, 0.37 M Tris pH 8.8, 0.1% APS, and 0.1% TEMED). Protein samples were loaded with 1× sample buffer (65.8 mM Tris–HCl, pH 6.8, 2% SDS, 26% glycerol, 5% β-mercaptoethanol). Membranes were blocked in TBS-T (20 mM Tris pH 7.5, 137 mM NaCl, 1% Tween-20 plus 5% non-fat dry milk) for 2 h and incubated with anti-myc (0.2 µg/ml) or anti-ATP13A4 (2.5–5 µg/ml) antibodies for 1 h in room temperature. After being washed with TBS-T, membranes were incubated in horseradish peroxidase-conjugated secondary antibodies (0.04 µg/ml, Santa Cruz) for 1 h. Bound antibody was detected by film using an enhanced chemiluminescence assay (ECL, Millipore).
Tissue Fractionation
Mouse brain was fractionated as described by (Cox and Emili 2006) with a few alterations. The tissues were homogenized in a pre-chilled tube using a Polytron PT 2100 homogenizer (Kinematica AG) in 400 μl ice-cold homogenization buffer (0.25 M sucrose, 10 mM Tris–HCl, 150 mM NaCl, 1 mM EDTA, 1 mM PMSF, and 0.5% protease inhibitor cocktail, Sigma) per 100 mg of tissue. The homogenate was centrifuged at 800g for 15 min at 4°C, to remove a nuclear fraction containing nuclei, unbroken tissue, whole cells and debris. The supernatant was centrifuged at 100,000g for 1 h at 4°C, and gave rise to a pellet (P2) containing mitochondrial, lysosomal, peroxisomal, microsomal, Golgi membranes and plasma membrane, and cytosolic fraction containing a pure cytosol (S2). The cytosolic fraction was isolated and stored at −80°C. The pellet (P2) was resuspended in 400 μl of 1× membrane extraction buffer (20 mM Tris–HCl, 250 mM NaCl, 15% glycerol, 1 mM DTT, 1 mM PMSF, 0.5% protease inhibitor cocktail, and 1% NP-40) and stored at −80°C for further Western blot analysis.
Calcium Imaging
Cells were seeded onto poly-d-lysine-treated glass chamber slides at a density of 5 × 10⁴ and were transfected approximately 16 h later with ATP13A4/pDsRed-monomer-N1 using the LipofectAMINE 2000 method. Following overnight incubation at 37 C, 5% CO2, cells were washed twice with Hanks’ balanced salt solution without phenol red (HBSSred-free; Invitrogen). The esterified, membrane-permeant derivative 1-[2-(5-carboxyoxazol-2-yl)-6-aminobenzo furan-5-oxy]-2-(2′-amino-5′-methylphenoxy) ethane-N,N,N′,N′-tetraacetic acid, acetoxylmethyl ester (fura-2 AM; Invitrogen) was used to determine intracellular free Ca2+ concentration ([Ca2+]i). Fura-2 AM is hydrolyzed by cytosolic esterases to an impermeable fura-2 form, which facilitates the chelation of free [Ca2+]i. The ratio of fluorescent intensity obtained at 340 nm excitation (fura-2- Ca2+-bound complex) to that at 380 nm (Ca2+-free fura-2) was used as a measure of [Ca2+]i. The emission wavelength for both compounds was 520 nm. Transiently transfected COS-7 cells were loaded with 5 µM of the Ca2+-sensitive fura-2 AM and an equal volume of 20% pluronic acid F127 (Invitrogen) to minimize compartmentalization of the dye. Cells were incubated with fura-2 AM for 45 min at 37°C, 5% CO2, washed with HBSSred-free and further incubated in fresh HBSSred-free at 37°C, 5% CO2 for an additional 30 min to de-esterify fura-2 AM. Cells were washed once with HBSSred-free and the basal 340/380 nm ratio (R) was measured. Untransfected COS-7 cells were used to determine the minimum 340/380 nm ratio (R min) and maximum 340/380 nm ratio (R max). To determine R max, we obtained 340 and 380 nm measurements following the addition of 4 μM ionomycin (Santa Cruz) to the media to stimulate [Ca2+]i release and facilitate extracellular calcium ([Ca2+]E) entry. R min was determined by measuring 340 and 380 nm following the addition of 10 mM ethylene glycol tetraacetic acid (EGTA). Intracellular Ca2+ was estimated from the following equation:
 |
in which K d is the dissociation constant of fura-2 (224 nm under standard conditions), R is any given 340/380 ratio value of fluorescence measured for Ca2+-free and Ca2+-bound fura-2, R min is the 340/380 intensity ratio in the absence of Ca2+ and presence of 10 mM EGTA, R max the 340/380 intensity ratio when the cells were exposed to 4 μM ionomycin, and β is the ratio of fluorescence measured at 380 nm in calcium-depleted and calcium-saturated solution (Grynkiewicz et al. 1985). Images were captured using NIS Elements software, on a Nikon Eclipse Ti-E microscope, with an S Plan Fluor 20× (NA .45) objective and a Retiga SRV camera (Qimaging) (Nikon). At least three different transfection experiments, for each construct, were performed with consistent results obtained. Cells over-expressing ATP13A4, as determined by red fluorescence, and untransfected cells were analyzed within the same field of view in transiently transfected COS-7 cells. All experiments were carried out at room temperature and measured within 30 min.
Reverse Transcription and Real-Time PCR
Total RNA obtained from mouse tissues embryonic day 7, 11, 15, 17 and adult brain (Clonetech) was reverse transcribed into cDNA with MMLV reverse transcriptase (Stratagene) using oligo(dT) primers followed by PCR using gene-specific primers. Three micrograms of DNase I-treated total RNA was incubated with 0.01 μg/μl Oligo (dT)12–18, 1× cDNA synthesis buffer, 0.5 mM dNTP, and 10 mM dithiothreitol (DTT). The reaction was incubated at 37°C for 60 min. The resulting cDNA solution was stored at −20°C. The expression level of ATP13A4 in various developmental stages was determined using the 7500 Fast Real-Time PCR System with SYBR Green reagent (Applied Biosystems). Quantitative values were obtained from the threshold cycle (C t) number at which the increase in the signal associated with exponential growth of PCR products begins to be detected using PE Biosystems analysis software, according to the manufacture’s manuals. This involves comparing the C t values of the samples from various developmental stages with a calibrator (sample from the adult stage). The comparative C t method is also known as the 2-[delta][delta]C t method, where
 |
Here, ΔC t,sample is the C t value for any sample normalized to the endogenous housekeeping gene called hypoxanthine phosphoribosyl transferase (HPRT) (Santos and Duarte 2008) and ΔC t,reference is the C t value for the calibrator also normalized to the endogenous housekeeping gene. Primers used for ATP13A4 were chosen at the junction of exon 27 and 28: ATP13A4, forward primer 5′-GGCAGCCCACCTATACAAACTATATAT-3′; and reverse primer 5′-GAATGAAAAGACATACGCCCATCT-3′. Primers for HPRT were forward 5′-TCCATTCCTATGACTGTAGATTTTATCAG-3′ and reverse 5′-AACTTTTATGTCCCCCGTTGACT-3′. These primers amplify a 72 and 75 bp fragment of ATP13A4 and HPRT, respectively. Primers were designed using Primer Express Software for Real-Time PCR Version 3.0 (Applied Biosystems). Three parallel PCR experiments were conducted with ATP13A4- and HPRT-specific primers on 2 μl of cDNA product. PCR amplifications for each sample were always performed in triplicate wells. PCR mix contained 100 nM forward primer, 100 nM reverse primer, and 1× SYBR Green master mix (Applied Biosystems) at 20 ml/tube. The thermal cycling conditions entailed an initial denaturation step at 95°C for 20 s, followed by 40 cycles at 95°C for 3 s, and 60°C for 30 s. Results were presented as the relative quantity of ratios of ATP13A4 to HPRT. The threshold cycle (C t) was calculated by the instrument software (7500 Fast System ver. 1.3.1).
Statistical Analysis
Student’s unpaired t-tests were used to evaluate the statistical difference between means. Differences were considered to be statistically significant at P < 0.05. Results are presented as means ± SEM.
Results
Subcellular Localization of ATP13A4 in COS-7 Cells
To determine the subcellular localization of ATP13A4, COS-7 cells were transiently transfected with 3′ Myc-His-tagged mouse ATP13A4 and the protein was detected using anti-myc antibody (Fig. 2a). The expression was confirmed with Western blot analysis using anti-myc antibody (Fig. 2b). We detected a band at a predicted size of 131 kDa (Fig. 2b, top panel), which was not seen in cells transfected with pcDNA3-Myc-His empty vector. We also determined that ATP13A4 is endogenously expressed in COS-7 cells (Fig. 2b, bottom panel) and in mouse brain lysate used as a control (Fig. 2c, top panel). High expression of ATP13A4 was found in the microsomal fraction (P2). Unexpectedly, a lower level of ATP13A4 was also detected in a pure cytosolic fraction (S2).
Fig. 2.

Expression of the mouse ATP13A4 ATPase in COS-7 cells. a Fluorescent images of COS-7 cells expressing mouse ATP13A4 (scale bar 100 μm). a, left panel: COS-7 cells transiently transfected with ATP13A4/pcDNA3-Myc-His, incubated with mouse anti-myc antibodies for ATP13A4 and detected with anti-mouse FITC-conjugated secondary antisera. a, right panel: Nuclei were counterstained with 4′,6-diamidino-2-phenylindole (DAPI). a Middle panels represent a merged view of ATP13A4 and DAPI-stained nuclei. b ATP13A4 expression was confirmed using Western blot analysis. Proteins from whole cell lysates were separated by SDS–PAGE, blotted and probed with mouse anti-myc (b, top panel) and rabbit anti-ATP13A4 (b, bottom panels). To verify the specificity of anti-myc antibody, COS-7 cells transfected with pcDNA3-Myc-His vector only were used. c Mouse whole brain lysate was used as a positive control for anti-ATP13A4. A fraction containing mitochondrial, lysosomal, peroxisomal, microsomal, and Golgi membranes as well as plasma membrane (P2), and a pure cytosolic fraction (S2) were obtained after centrifugation at 100,000g for 1 h at 4°C. Anti-ATP13A4 antibodies were used to detect ATP13A4 (c, top panel) and anti-calnexin for the ER membranes (c, bottom panels). Arrows indicate ATP13A4 and calnexin immunoreactive bands
The co-localization of ATP13A4 with cellular organelles was further determined by immunocytochemistry using various markers. After transient transfection, we observed that ATP13A4 was detected within the endoplasmic reticulum (ER), which was confirmed through its co-localization with calnexin, a resident protein of the ER (Fig. 3a). We did not observe co-localization with markers for the Golgi apparatus, mitochondria, or lysosomes (Fig. 3b–d). In order to determine whether E628D and D468V mutations will affect the subcellular localization of the protein, we generated mutated cDNA sequences using Polymerase Chain Reaction (PCR) (Supplementary Figs. 1 and 2 and Methods). COS-7 cells were transiently transfected with ATP13A4-D468V/pcDNA3-Myc-His or ATP13A4-E628D/pcDNA3-Myc-His. Our immunocytochemistry results show that similar to the wild type, both mutants were localized in the ER membrane indicating that the mutations have no effect on their proper targeting (data not shown).
Fig. 3.

Immunocytochemical localization of ATP13A4 in COS-7 cells. a, b, c, d, left panel: Subcellular expression of ATP13A4 in transiently transfected COS-7 cells with ATP13A4/pcDNA3-Myc-His was detected with mouse anti-myc antibodies for ATP13A4 and detected with FITC-conjugated secondary antisera. a Localization of ATP13A4 in the endoplasmic reticulum was determined using anti-calnexin antibody (scale bar 20 μm). No co-localization was observed with b Golgi apparatus using anti-GOLPH-4 antibody, c mitochondria using anti-COX IV antibody, or d lysosomes using anti-LAMP1 antibodies (scale bars 10 μm). Left panel displays expression of ATP13A4-myc, right panel displays expression of subcellular proteins, and middle panel displays a merged view of both proteins including DAPI-stained nuclei
Measurement of Intracellular Free Calcium in COS-7 Cells Over-Expressing Wild-Type ATP13A4
To investigate whether ATP13A4 plays a role in cellular calcium homeostasis, [Ca2+]i levels were measured in COS-7 cells transiently transfected with the mouse ATP13A4 in pDsRed-monomer-N1 vector (Fig. 4). We confirmed that pDsRed-monomer-N1-tagged ATP13A4 was localized to the ER (Fig. 4). The intracellular calcium concentration [Ca2+]i was determined with the ratiometric fura-2 AM Ca2+ indicator by measuring the fluorescence ratio of 340/380 nm. The main advantage of using ratiometric indicators is that the ratio signal minimizes a number of negative effects that occur and disturb measurements, including uneven dye loading, leakage of fura-2, and bleaching. Fura-2, upon binding Ca2+, exhibits a shift in its absorption peak from 380 to 340 nm (Grynkiewicz et al. 1985). Fura-2 AM ester freely crosses the cell membrane. Once inside the cell, it is hydrolyzed by cellular esterases to a Ca2+ ion sensitive fura-2 that is trapped within the cell due to its anionic charge. Binding of Ca2+ to fura-2 changes the 340/380 nm fluorescence intensity ratio, which was detected using a microscopic method. The maximum fura-2 340/380 nm ratio (R max) was determined with saturating levels of Ca2+ in the presence of ionomycin (4 μM) and the minimum ratio (R min) was attained in the presence of the Ca2+ chelator EGTA (10 mM). The obtained R min and R max values for COS-7 cells were 0.128 and 1.780, respectively (Fig. 5). Changes in [Ca2+]i levels were determined in COS-7 cells transiently transfected with the mouse ATP13A4 (Fig. 6). The [Ca2+]i concentration of cells (mean values for cell population) was calculated using the 340/380 nm ratio values. [Ca2+]i measurements in fura-2 AM-loaded COS-7 cells over-expressing wild-type ATP13A4 and untransfected cells (Fig. 6) were calculated according to the relationship described for fura-2 by Grynkiewicz (Grynkiewicz et al. 1985). Our results show that cells over-expressing ATP13A4 had a significantly higher 340/380 nm fluorescence intensity ratio when compared to untransfected cells, 0.320 ± 0.014 vs. 0.275 ± 0.009, respectively (P = 0.0067; data not shown). When the changes in the 340/380 nm ratio were converted to [Ca2+]i, the results show that the concentration of free [Ca2+]i was higher in cells over-expressing ATP13A4 when compared to the resting levels of Ca2+ in untransfected cells (97.8 ± 8.7 vs. 71.5 ± 5.2 nM, P = 0.0067) (Fig. 6d). These findings demonstrate that ATP13A4 might have an intrinsic role in augmenting cellular Ca2+ levels.
Fig. 4.
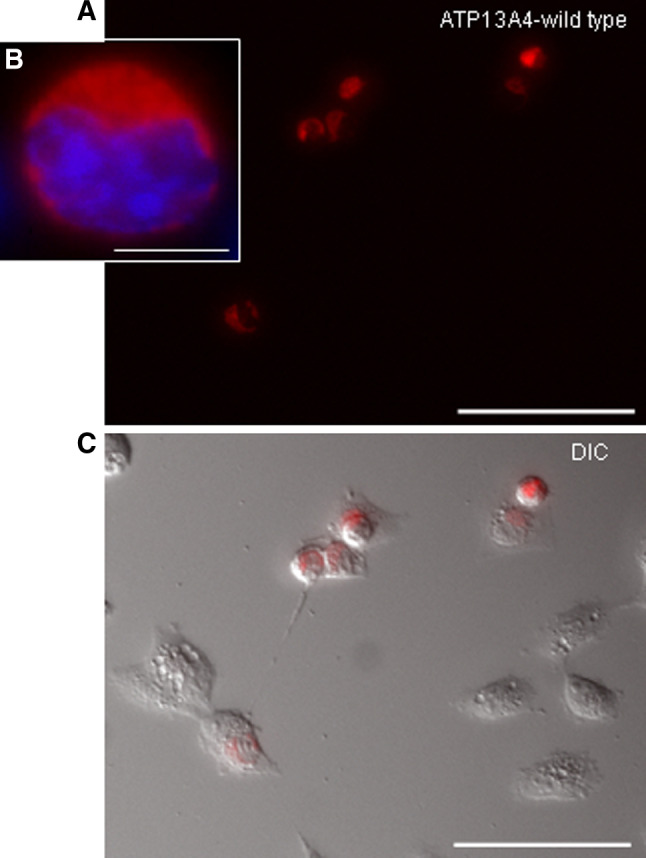
Transient expression of the mouse ATP13A4 ATPase in COS-7 cells transfected with ATP13A4/pDsRed-monomer-N1. a Fluorescent images of COS-7 cells expressing mouse ATP13A4 (scale bar 100 μm). b Localization of ATP13A4 to the endoplasmic reticulum (scale bar 10 μm). Nuclei were counterstained with 4′,6-diamidino-2-phenylindole (DAPI). c Merge of red fluorescence and DIC image depicting ATP13A4 transfected cells and untransfected cells (scale bar 100 μm)
Fig. 5.

Ratiometric changes of 340/380 nm ratio (R) in fura-2 AM-loaded untransfected COS-7 cells in response to ionomycin and EGTA. a 340/380 nm fluorescent image at time 0. b 340/380 fluorescent image following the addition of 4 μM ionomycin at time 300 s. c Differential Interference Contrast (DIC) image of COS-7 cells. d 340/380 nm tracing showing R values at baseline, the maximum R value (R max) and the minimum R value (R min) following the addition of 4 μM ionomycin and 10 mM EGTA to the media, respectively. Note that an increase in calcium is represented by a shift from blue to yellow/red. All scale bars correspond to 100 μm
Fig. 6.

Measurements of intracellular calcium concentration in COS-7 cells transiently transfected with ATP13A4/pDsRed-monomer-N1. Calcium measurements were performed in fura-2 AM-loaded COS-7 cells. Resting [Ca2+]i in COS-7 cells over-expressing wild-type ATP13A4 is compared to untransfected cells. a Red fluorescence representing COS-7 cells transiently transfected with ATP13A4/pDsRed-monomer-N1. b Merge of red fluorescence and DIC image depicting ATP13A4 transfected cells and untransfected cells. c 340/380 nm fluorescence image at time 0. ATP13A4-expressing cells have a higher 340/380 nm ratio as shown by light blue–green compared to untransfected cells that are a darker blue–purple (scale bars 100 μm). (D) Mean [Ca2+]i of fura-2 AM-loaded COS-7 cells presented at each time point across the experiment (n = 50) for both ATP13A4 expressing and untransfected cells (n = 67). The mean [Ca2+]i for ATP13A4 expressing cells was significantly higher than untransfected cells (97.8 ± 8.7 vs. 71.5 ± 5.2 nM, respectively; P = 0.0067). The results are representative of three different experiments with a total of 228 number of untransfected and 143 number of transfected cells analyzed. [Ca2+]i was quantified for each time point using the Grynkiewicz equation (Grynkiewicz et al. 1985)
Measurement of Intracellular Free Calcium in COS-7 Cells Over-Expressing the E646D and D468V Mutant
We tested the functional significance of the substitution of aspartic acid for a glutamic acid (E628D), which corresponds to the E>D substitution at the residue 646 found in individuals with ASD. In addition, D468 residue is a conserved phosphorylation site of the mouse ATP13A4 ATPase and the mutation of aspartic acid to valine is expected to remove the protein’s ATPase activity. We examined the consequence of the E628D and D468V mutations in calcium regulation. The cDNA encoding the ATP13A4-E628D and ATP13A4-D468V mutated forms (Supplementary Figs. 1 and 2) were over-expressed in COS-7 cells. Changes in intracellular calcium [Ca2+]i levels were measured in COS-7 cells transiently expressing the E628D or D468V mutants in pDsRed-monomer-N1 vector. The results show that the mean 340/380 nm ratio of E628D expressing cells was at the level of untransfected cells at all time points (0.281 ± 0.015 vs. 0.279 ± 0.012; P = 0.89, data not shown). When the [Ca2+]i was quantified for each time point using the Grynkiewicz equation (Grynkiewicz et al. 1985) the results showed that [Ca2+]i levels in the ATP13A4-E628D mutant were not significantly different from the levels found in untransfected cells (75.1 ± 8.4 vs. 74.0 ± 9.5 nM, P = 0.89) (Fig. 7). Moreover, we demonstrated that the mean 340/380 nm ratio of D468V expressing cells (used as a control) was similar to that of untransfected cells at all time points (0.286 ± 0.009 vs. 0.268 ± 0.009; P = 0.20, data not shown). Free [Ca2+]i levels in cells expressing the D468V mutant were also not significantly different from the basal [Ca2+]i level of untransfected cells (77.1 ± 8.0 vs. 68.3 ± 5.7 nM, P = 0.20) (Fig. 7e). As predicted, the ATP14A4-D468V pump appears to have no intrinsic Ca2+-pump activity owing to the mutation in the conserved phosphorylation site.
Fig. 7.

Measurements of [Ca2+]i in COS-7 cells transiently transfected with ATP13A4(E628D)/pDsRed-monomer-N1 and ATP13A4(D468V)/pDsRed-monomer-N1. Resting [Ca2+]i in COS-7 cells over-expressing ATP13A4- E428D mutated form is compared to untransfected cells. a Red fluorescence image representing COS-7 cells expressing ATP13A4-E628D. b Merge of red fluorescence depicting transfected cells and DIC image. c 340/380 nm fluorescence image at time 0. ATP13A4-E628D-expressing cells show a similar range of 340/380 nm ratio compared to untransfected cells as shown by blue–purple (scale bars 100 μm). d Mean [Ca2+]i of fura-2 AM-loaded COS-7 ATP13A4-E628D-expressing cells (n = 27) vs. untransfected cells (n = 44) presented at each time point across the experiment. The mean [Ca2+]i for ATP13A4-E628D expressing cells was at the level of untransfected cells (75.1 ± 8.4 vs. 74.0 ± 9.5 nM, respectively; P = 0.89). The results are representative of three different experiments with a total of 118 number of transfected and 198 number of untransfected cells analyzed. e The mean [Ca2+]i for ATP13A4-D468V expressing cells used as a control (n = 68) was not significantly higher than untransfected cells (n = 67) (77.1 ± 8.0 vs. 68.3 ± 5.7 nM, respectively; P = 0.20). The results are representative of three different experiments with a total of 163 number of transfected and 184 number of untransfected cells analyzed
In summary, the results show that there was a significant 37% increase in the [Ca2+]i in cells expressing the wild-type ATP13A4, whereas cells expressing the ATP14A4-E628D and -D468V mutated pumps show only a 1 and 13% increase, respectively (Fig. 8). This suggests that the mutation impaired the ability of ATP13A4 to regulate calcium transport. More importantly, this data also suggests that sequence alterations of the E628 site (corresponding to E646 found in patients with ASD) may cause defects in the pump activity and affect Ca2+ homeostasis.
Fig. 8.

[Ca2+]i of untransfected COS-7 cells, and cells transfected with either mouse wild-type ATP13A4, ATP13A4-E628D, and ATP13A4-D468V mutants. Data are shown as the mean ± SEM and is compared to untransfected cells (control) presented as 100%. There is a 37% increase in the [Ca2+]i in cells expressing the wild-type ATP13A4 (P = 0.0067). Cells expressing the ATP13A4-E628D and -D468V mutated transporters show only a 1 and 12% increase, respectively. WT = wild-type ATP13A4. Three independent experiments were performed for each mutated protein
The Temporal Expression Pattern of ATP13A4 During Embryonic Development
Real-time RT-PCR assay was used to asses the importance of ATP13A4 in development. The ATP13A4 mRNA expression was assessed in mouse embryos at days 7, 11, 15, and 17 of gestation and adult brain. The mRNA expression was quantified relative to the level of HPRT (hypoxanthine phosphoribosyl transferase) gene (Santos and Duarte 2008). As seen in Fig. 9, ATP13A4 transcription is very low in E7 and E11 and considerably increases during day 15 and 17 of gestation. Compared to the adult brain the ATP13A4 expressions in 7-, 11-, 15-, and 17-day mouse embryo were 13, 8, 70, and 130%, respectively (Fig. 9). These results show that the ATP13A4 expression level was detected at the very low level in early embryonic stages E7 and E11 and increased significantly in development with the highest expression at the embryonic day 17 (P < 0.0001). These results indicate that ATP13A4 might play an important role during embryonic development.
Fig. 9.

Expression analysis of ATP13A4 throughout mouse brain development. The ΔΔCT method of relative quantification using real-time PCR with SYBR Green I was implemented to measure the ATP13A4 gene expression in different developmental stages. The amount of ATP13A4 amplified was quantified relative to the amount of HPRT (hypoxanthine phosphoribosyl transferase) using the 7500 Fast Real-Time PCR System. When compared to the adult brain (shown as 100%) the ATP13A4 expressions in 7-, 11-, 15-, and 17-day mouse embryonic stage was 13, 8, 70, and 130%, respectively. Real-time PCR primers were designed using Primer Express 3.0. Average of three independent experiments is shown. Each sample was run in triplicates. P < 0.0001
Discussion
P5-type ATPases are the least studied of the P-type ATPase subfamilies with no biological function assigned to them. In the present study, we show that ATP13A4, a novel P5-type ATPase, is localized to the endoplasmic reticulum and that it may be involved in calcium homeostasis. We also show that the ATP13A4 gene expression increases during mouse development. P5-type ATPases have been grouped into two subfamilies (P5A and P5B) following a phylogenetic analysis of their conserved sequences (Moller et al. 2008). P5A ATPases contain a phosphorylation site (DKTGTLT) typical of all P-type ATPases (Axelsen and Palmgren 1998), and an ion-binding site containing a negatively charged D or E residue (PP(D/E)LPxE). The ATPase phosphorylation site contains a conserved aspartate residue (D468 and D486 in the mouse and human sequences, respectively) that is phosphorylated during the ATPase-transport reaction cycle. P5B ATPases also contain the conserved phosphorylation site, but in almost all cases, their ion-binding site appears to have lost the negatively charged amino acids and shares a conserved PP(A/V)LPAx sequence (mouse and human ATP13A4 contains PPALPAA sequence) (Axelsen and Palmgren 1998). It is therefore suggested that the two subfamilies of P5-type ATPases may have different substrate specificities (Moller et al. 2008). The recent expansion of P5B ATPases in higher eukaryotes such as in humans (Kwasnicka-Crawford et al. 2005) and mice (Schultheis et al. 2004) (ATP13A1-5) suggest the importance of P5B ATPases in complex organisms. Our previously published data implicates ATP13A4 in language development and autism (Kwasnicka-Crawford et al. 2005). In addition, Ramirez et al. provide support for ATP13A2 playing a role in Parkinson’s disease and dementia (Ramirez et al. 2006). These findings suggest the importance of P5-type ATPases within the nervous system and indicate that the pumps may facilitate a diverse set of physiological processes. Information on mammalian P5-type ATPases is limited in terms of their expression, ion specificity, and physiological function.
The results presented in this study describe the expression of ATP13A4 during mouse embryonic development. Our quantitative real-time PCR analysis revealed that ATP13A4 increases during mouse embryonic development. The ATP13A4 mRNA expression was very low at E7 and E11 and considerably higher at E15 and E17. Moreover, the most noticeable increase in ATP13A4 expression was noted between E11 and E15 with the highest level at E17. Interestingly, embryonic neurogenesis in mice occurs from E12 to E17 (Gillies and Price 1993a, b; Levers et al. 2001) strongly suggesting the importance of ATP13A4 in that developmental period. More detailed spatial and temporal expression patterns of the ATP13A4 mRNA and protein during early brain development of mouse and human is required for proper assessment of their biological role in neuronal development.
In this study, we also show that ATP13A4 was co-localized to the ER when over-expressed in COS-7 cells and was detected in brain microsomes suggesting that it might play an important role in the ER. We also detected a lower level of ATP13A4 in the cytosolic fraction of the brain lysate. Recent evidence from studies of the P4-type ATPases, a subfamily of proteins that share high similarity to the P5-type ATPases indicates that the ATP13A4 cytosolic expression might have a physiological significance. P4-type ATPases can be released from the ER membranes. The release of these proteins from membranes requires an interaction with members of the Cdc50p/Lem3p protein family (Pomorski et al. 2003; Noji et al. 2006). Interaction of yeast P4-type ATPase Drs2p with Cdc50p is required for exit from the ER (Saito et al. 2004). Mammalian ATP8B1, which is involved in the translocation of phosphatidylserine, requires a chaperone for the ER exit (Paulusma et al. 2008). Therefore, it is possible that ATP13A4 can also exit the ER membrane and be involved in the secretory and endocytic pathways. However, more studies are needed to determine whether ATP13A4 is involved in similar mechanisms and what its potential interacting partners are.
It has been suggested previously that P5-type ATPases might be involved in calcium homeostasis (Cronin et al. 2002). Yeast Cod1p, the only described member of the P5 subfamily, has been shown to play a role in cellular calcium homeostasis (Suzuki and Shimma 1999; Cronin et al. 2000, 2002; Suzuki 2001; Tipper and Harley 2002; Vashist et al. 2002). Since calcium plays a vital role in the nervous system it is important to identify proteins involved in its regulation. In order to determine whether ATP13A4 is involved in calcium regulation the measurements of [Ca2+]i was determined in cells over-expressing ATP13A4 using the ratiometric calcium imaging method with fura-2 AM as a calcium indicator. Our data shows that COS-7 cells over-expressing the wild-type ATP13A4 contained a significantly higher basal [Ca2+]i than did cells expressing endogenous levels of ATP13A4, suggesting that ATP13A4 may be involved in Ca2+ regulation and/or that its activity is Ca2+-dependent. In the present study, we tested the functional significance of the E628D mutation in the mouse ATP13A4 ATPase, which corresponds to the E646D sequence variant previously found in patients with autism (Kwasnicka-Crawford et al. 2005). The variant resulted in the substitution of aspartic acid for a glutamic acid and is located between the 4th and 5th transmembrane domain, the region containing the conserved aspartate residue and the nucleotide binding domain. Our results show that over-expressing the E628D mutated protein in COS-7 cells did not increase [Ca2+]i, which is analogous to the results obtained with the D468V phosphorylation mutation. This suggests that the ATP13A4-E628D protein has no intrinsic calcium-pump activity, which could be potentially attributed to the close proximity of the mutated residue to the conserved phosphorylation site (D468). The data shown here demonstrates the potential importance of ATP13A4 in calcium regulation. Moreover, our results also suggest that the E>D substitution found in patients with ASD and developmental delay may be involved in alteration of the [Ca2+]i, contributing to the clinical symptoms seen in these patients.
Calcium signals are important for elementary forms of neuronal communication such as synaptic transmission (Fitzjohn and Collingridge 2002; Bardo et al. 2006). In addition, calcium signaling is essential for complex brain functions, such as the induction of memory- and learning-related forms of neuronal plasticity. Furthermore, many aspects of development at the beginning of a neuron’s life, including gene expression, neuronal migration and differentiation, and synaptic plasticity, require transient fluctuations in calcium concentrations. In order to function normally, cells need to maintain tight control over intracellular free calcium ([Ca2+]i). Cytosolic [Ca2+]i levels are maintained through calcium-influx or -release from intracellular stores, which is regulated by various known calcium transporters located in the plasma membrane, endoplasmic reticulum, and mitochondria (Monteith and Roufogalis 1995; Blaustein and Golovina 2001; Kann and Kovacs 2007). Once inside the cell, calcium can activate protein kinases, proteases or phospholipases, which then act to regulate various cellular activities. Increases in [Ca2+]i have been shown to activate various calcium-dependent signaling pathways, such as through activation of second messenger systems (Hardingham and Bading 1999) or release of neurotransmitters (Stanley 1997; Sheng et al. 1998; Augustine 2001; Konur and Ghosh 2005). Therefore, our results suggest that any alterations in [Ca2+]i as a result of abnormal ATP13A4 expression or a mutation may disrupt these pathways and lead to defects in neuronal function.
Our findings are in accordance with studies on the mammalian P5-type ATPase ancestral proteins found in yeast, named Cod1p/Spf1p (Cronin et al. 2000, 2002; Suzuki 2001). ATP13A4 is localized to the ER and its over-expression leads to increased [Ca2+]i level. Therefore, the increase of [Ca2+]i level in ATP13A4-expressing cells might likely be the result of the higher ATP13A4 expression in the ER and be required for its function. Cod1p is also expressed in the ER and plays a role in regulating calcium homeostasis within the ER secretory pathway, more specifically in HMG-CoA reductase degradation and protein glycosylation (Suzuki and Shimma 1999; Cronin et al. 2000, 2002; Tipper and Harley 2002). It was shown that Cod1p was unable to transport calcium and its ATPase activity was inhibited at higher Ca2+ concentrations suggesting that Cod1p may utilize Ca2+ in a different manner than the known Ca2+-transporting ATPases (Cronin et al. 2002). Moreover, recent evidence from studies of the P4-type ATPases suggests that they require Mg2+ for ATP hydrolysis but not as a transport substrate. For example, yeast Drs2p protein requires ATP and Mg2+ to translocate phosphatidylserine (Ding et al. 2000; Gomes et al. 2000). More studies using biochemical analysis will determine whether calcium is required for ATP13A4’s ATPase activity and if the protein is involved in actively transporting calcium.
P-type ATPases have been shown to play critical roles in the nervous system, through facilitating such processes as neurotransmitter release, neuronal motility, and synaptic plasticity (El Meskini et al. 2005; Empson et al. 2007; Jensen et al. 2007). To date, this is the first study to define the biological characterization of a mammalian P5-type ATPase. Our observation implicating ATP13A4 in calcium regulation is intriguing considering the important roles that calcium plays in the functioning of the nervous system. Moreover, high levels of ATP13A4 transcripts during neurogenesis suggest the importance of this pump in neuronal development. Impairments in ATP13A4 expression level or activity due to mutations could contribute to abnormal [Ca2+]i levels at the critical period of development and lead to neuronal malfunction. Abnormal calcium homeostasis in the nervous system has been associated with developmental disorders such as autism (Splawski et al. 2004, 2005, 2006) and neurodegenerative diseases such as Alzheimer’s (Hensley et al. 1994), Parkinson’s (Surmeier 2007), Huntington’s (Bezprozvanny and Hayden 2004), and amyotrophic lateral sclerosis (Roy et al. 1998; Takuma et al. 1999), resulting from specific mutations in genes that encode calcium transporters.
This study provides further insights into the biological role of ATP13A4, a member of the novel P5 subfamily of transporters. Our study shows that ATP13A4 ATPase is likely involved in calcium regulation suggesting that it can have a distinct function from previously described calcium pumps, such as SERCA, PMCA, and SPCA (Mata and Sepulveda 2005; Sepulveda et al. 2008). Moreover, ATP13A4 expression increases during neurogenesis indicating its importance in early neuronal development. Future studies will determine how essential this protein is for neuronal activity and what its role is in the development of the nervous system in order to understand its association with language development and autism. More biochemical studies are also needed to provide evidence for the physiological role of ATP13A4 in the nervous system.
Electronic supplementary material
Below is the link to the electronic supplementary material.
Acknowledgments
This study was supported by the Natural Sciences and Engineering Research Council of Canada (NSERC) and Canada Foundation for Innovation (CFI). We thank Dr. Thomas Hawke for providing mouse brain samples.
References
- Augustine GJ (2001) How does calcium trigger neurotransmitter release? Curr Opin Neurobiol 11:320–326 [DOI] [PubMed] [Google Scholar]
- Auranen M, Vanhala R, Varilo T, Ayers K, Kempas E, Ylisaukko-Oja T, Sinsheimer JS, Peltonen L, Jarvela I (2002) A genomewide screen for autism-spectrum disorders: evidence for a major susceptibility locus on chromosome 3q25–27. Am J Hum Genet 71:777–790 [DOI] [PMC free article] [PubMed] [Google Scholar]
- Auranen M, Varilo T, Alen R, Vanhala R, Ayers K, Kempas E, Ylisaukko-Oja T, Peltonen L, Jarvela I (2003) Evidence for allelic association on chromosome 3q25–27 in families with autism spectrum disorders originating from a subisolate of Finland. Mol Psychiatry 8:879–884 [DOI] [PubMed] [Google Scholar]
- Axelsen KB, Palmgren MG (1998) Evolution of substrate specificities in the P-type ATPase superfamily. J Mol Evol 46:84–101 [DOI] [PubMed] [Google Scholar]
- Bardo S, Cavazzini MG, Emptage N (2006) The role of the endoplasmic reticulum Ca2+ store in the plasticity of central neurons. Trends Pharmacol Sci 27:78–84 [DOI] [PubMed] [Google Scholar]
- Barnby G, Abbott A, Sykes N, Morris A, Weeks DE, Mott R, Lamb J, Bailey AJ, Monaco AP (2005) Candidate-gene screening and association analysis at the autism-susceptibility locus on chromosome 16p: evidence of association at GRIN2A and ABAT. Am J Hum Genet 76:950–966 [DOI] [PMC free article] [PubMed] [Google Scholar]
- Bezprozvanny I, Hayden MR (2004) Deranged neuronal calcium signaling and Huntington disease. Biochem Biophys Res Commun 322:1310–1317 [DOI] [PubMed] [Google Scholar]
- Blaustein MP, Golovina VA (2001) Structural complexity and functional diversity of endoplasmic reticulum Ca(2+) stores. Trends Neurosci 24:602–608 [DOI] [PubMed] [Google Scholar]
- Burette A, Rockwood JM, Strehler EE, Weinberg RJ (2003) Isoform-specific distribution of the plasma membrane Ca2+ ATPase in the rat brain. J Comp Neurol 467:464–476 [DOI] [PubMed] [Google Scholar]
- Cox B, Emili A (2006) Tissue subcellular fractionation and protein extraction for use in mass-spectrometry-based proteomics. Nat Protoc 1:1872–1878 [DOI] [PubMed] [Google Scholar]
- Cronin SR, Khoury A, Ferry DK, Hampton RY (2000) Regulation of HMG-CoA reductase degradation requires the P-type ATPase Cod1p/Spf1p. J Cell Biol 148:915–924 [DOI] [PMC free article] [PubMed] [Google Scholar]
- Cronin SR, Rao R, Hampton RY (2002) Cod1p/Spf1p is a P-type ATPase involved in ER function and Ca2+ homeostasis. J Cell Biol 157:1017–1028 [DOI] [PMC free article] [PubMed] [Google Scholar]
- Ding J, Wu Z, Crider BP, Ma Y, Li X, Slaughter C, Gong L, Xie XS (2000) Identification and functional expression of four isoforms of ATPase II, the putative aminophospholipid translocase. Effect of isoform variation on the ATPase activity and phospholipid specificity. J Biol Chem 275:23378–23386 [DOI] [PubMed] [Google Scholar]
- El Meskini R, Cline LB, Eipper BA, Ronnett GV (2005) The developmentally regulated expression of Menkes protein ATP7A suggests a role in axon extension and synaptogenesis. Dev Neurosci 27:333–348 [DOI] [PubMed] [Google Scholar]
- Empson RM, Garside ML, Knopfel T (2007) Plasma membrane Ca2+ ATPase 2 contributes to short-term synapse plasticity at the parallel fiber to Purkinje neuron synapse. J Neurosci 27:3753–3758 [DOI] [PMC free article] [PubMed] [Google Scholar]
- Fitzjohn SM, Collingridge GL (2002) Calcium stores and synaptic plasticity. Cell Calcium 32:405–411 [DOI] [PubMed] [Google Scholar]
- Gillies K, Price DJ (1993a) Cell migration and subplate loss in explant cultures of murine cerebral cortex. NeuroReport 4:911–914 [DOI] [PubMed] [Google Scholar]
- Gillies K, Price DJ (1993b) The fates of cells in the developing cerebral cortex of normal and methylazoxymethanol acetate-lesioned mice. Eur J Neurosci 5:73–84 [DOI] [PubMed] [Google Scholar]
- Gomes E, Jakobsen MK, Axelsen KB, Geisler M, Palmgren MG (2000) Chilling tolerance in Arabidopsis involves ALA1, a member of a new family of putative aminophospholipid translocases. Plant Cell 12:2441–2454 [PMC free article] [PubMed] [Google Scholar]
- Grynkiewicz G, Poenie M, Tsien RY (1985) A new generation of Ca2+ indicators with greatly improved fluorescence properties. J Biol Chem 260:3440–3450 [PubMed] [Google Scholar]
- Hardingham GE, Bading H (1999) Calcium as a versatile second messenger in the control of gene expression. Microsc Res Tech 46:348–355 [DOI] [PubMed] [Google Scholar]
- Hensley K, Carney JM, Mattson MP, Aksenova M, Harris M, Wu JF, Floyd RA, Butterfield DA (1994) A model for beta-amyloid aggregation and neurotoxicity based on free radical generation by the peptide: relevance to Alzheimer disease. Proc Natl Acad Sci USA 91:3270–3274 [DOI] [PMC free article] [PubMed] [Google Scholar]
- Jamain S, Betancur C, Quach H, Philippe A, Fellous M, Giros B, Gillberg C, Leboyer M, Bourgeron T (2002) Linkage and association of the glutamate receptor 6 gene with autism. Mol Psychiatry 7:302–310 [DOI] [PMC free article] [PubMed] [Google Scholar]
- Jensen TP, Filoteo AG, Knopfel T, Empson RM (2007) Presynaptic plasma membrane Ca2+ ATPase isoform 2a regulates excitatory synaptic transmission in rat hippocampal CA3. J Physiol 579:85–99 [DOI] [PMC free article] [PubMed] [Google Scholar]
- Jorgensen PL, Hakansson KO, Karlish SJ (2003) Structure and mechanism of Na, K-ATPase: functional sites and their interactions. Annu Rev Physiol 65:817–849 [DOI] [PubMed] [Google Scholar]
- Kann O, Kovacs R (2007) Mitochondria and neuronal activity. Am J Physiol Cell Physiol 292:C641–C657 [DOI] [PubMed] [Google Scholar]
- Konur S, Ghosh A (2005) Calcium signaling and the control of dendritic development. Neuron 46:401–405 [DOI] [PubMed] [Google Scholar]
- Kwasnicka-Crawford DA, Carson AR, Roberts W, Summers AM, Rehnstrom K, Jarvela I, Scherer SW (2005) Characterization of a novel cation transporter ATPase gene (ATP13A4) interrupted by 3q25–q29 inversion in an individual with language delay. Genomics 86:182–194 [DOI] [PubMed] [Google Scholar]
- Levers TE, Edgar JM, Price DJ (2001) The fates of cells generated at the end of neurogenesis in developing mouse cortex. J Neurobiol 48:265–277 [DOI] [PubMed] [Google Scholar]
- Martonosi AN, Pikula S (2003) The network of calcium regulation in muscle. Acta Biochim Pol 50:1–30 [PubMed] [Google Scholar]
- Mata AM, Sepulveda MR (2005) Calcium pumps in the central nervous system. Brain Res Brain Res Rev 49:398–405 [DOI] [PubMed] [Google Scholar]
- Moller JV, Juul B, le Maire M (1996) Structural organization, ion transport, and energy transduction of P-type ATPases. Biochim Biophys Acta 1286:1–51 [DOI] [PubMed] [Google Scholar]
- Moller AB, Asp T, Holm PB, Palmgren MG (2008) Phylogenetic analysis of P5 P-type ATPases, a eukaryotic lineage of secretory pathway pumps. Mol Phylogenet Evol 46:619–634 [DOI] [PubMed] [Google Scholar]
- Monteith GR, Roufogalis BD (1995) The plasma membrane calcium pump—a physiological perspective on its regulation. Cell Calcium 18:459–470 [DOI] [PubMed] [Google Scholar]
- Noji T, Yamamoto T, Saito K, Fujimura-Kamada K, Kondo S, Tanaka K (2006) Mutational analysis of the Lem3p-Dnf1p putative phospholipid-translocating P-type ATPase reveals novel regulatory roles for Lem3p and a carboxyl-terminal region of Dnf1p independent of the phospholipid-translocating activity of Dnf1p in yeast. Biochem Biophys Res Commun 344:323–331 [DOI] [PubMed] [Google Scholar]
- Paulusma CC, Folmer DE, Ho-Mok KS, de Waart DR, Hilarius PM, Verhoeven AJ, Oude Elferink RP (2008) ATP8B1 requires an accessory protein for endoplasmic reticulum exit and plasma membrane lipid flippase activity. Hepatology 47:268–278 [DOI] [PubMed] [Google Scholar]
- Periasamy M, Huke S (2001) SERCA pump level is a critical determinant of Ca(2+)homeostasis and cardiac contractility. J Mol Cell Cardiol 33:1053–1063 [DOI] [PubMed] [Google Scholar]
- Pomorski T, Lombardi R, Riezman H, Devaux PF, van Meer G, Holthuis JC (2003) Drs2p-related P-type ATPases Dnf1p and Dnf2p are required for phospholipid translocation across the yeast plasma membrane and serve a role in endocytosis. Mol Biol Cell 14:1240–1254 [DOI] [PMC free article] [PubMed] [Google Scholar]
- Ramirez A, Heimbach A, Grundemann J, Stiller B, Hampshire D, Cid LP, Goebel I, Mubaidin AF, Wriekat AL, Roeper J, Al-Din A, Hillmer AM, Karsak M, Liss B, Woods CG, Behrens MI, Kubisch C (2006) Hereditary parkinsonism with dementia is caused by mutations in ATP13A2, encoding a lysosomal type 5 P-type ATPase. Nat Genet 38:1184–1191 [DOI] [PubMed] [Google Scholar]
- Roy J, Minotti S, Dong L, Figlewicz DA, Durham HD (1998) Glutamate potentiates the toxicity of mutant Cu/Zn-superoxide dismutase in motor neurons by postsynaptic calcium-dependent mechanisms. J Neurosci 18:9673–9684 [DOI] [PMC free article] [PubMed] [Google Scholar]
- Saito K, Fujimura-Kamada K, Furuta N, Kato U, Umeda M, Tanaka K (2004) Cdc50p, a protein required for polarized growth, associates with the Drs2p P-type ATPase implicated in phospholipid translocation in Saccharomyces cerevisiae. Mol Biol Cell 15:3418–3432 [DOI] [PMC free article] [PubMed] [Google Scholar]
- Santos AR, Duarte CB (2008) Validation of internal control genes for expression studies: effects of the neurotrophin BDNF on hippocampal neurons. J Neurosci Res 86:3684–3692 [DOI] [PubMed] [Google Scholar]
- Schultheis PJ, Hagen TT, O’Toole KK, Tachibana A, Burke CR, McGill DL, Okunade GW, Shull GE (2004) Characterization of the P5 subfamily of P-type transport ATPases in mice. Biochem Biophys Res Commun 323:731–738 [DOI] [PubMed] [Google Scholar]
- Sepulveda MR, Marcos D, Berrocal M, Raeymaekers L, Mata AM, Wuytack F (2008) Activity and localization of the Secretory Pathway Ca2+ -ATPase isoform 1 (SPCA1) in different areas of the mouse brain during postnatal development. Mol Cell Neurosci 38:461–473 [DOI] [PubMed] [Google Scholar]
- Serajee FJ, Zhong H, Nabi R, Huq AH (2003) The metabotropic glutamate receptor 8 gene at 7q31: partial duplication and possible association with autism. J Med Genet 40:e42 [DOI] [PMC free article] [PubMed] [Google Scholar]
- Sheng ZH, Westenbroek RE, Catterall WA (1998) Physical link and functional coupling of presynaptic calcium channels and the synaptic vesicle docking/fusion machinery. J Bioenerg Biomembr 30:335–345 [DOI] [PubMed] [Google Scholar]
- Splawski I, Timothy KW, Sharpe LM, Decher N, Kumar P, Bloise R, Napolitano C, Schwartz PJ, Joseph RM, Condouris K, Tager-Flusberg H, Priori SG, Sanguinetti MC, Keating MT (2004) Ca(V)1.2 calcium channel dysfunction causes a multisystem disorder including arrhythmia and autism. Cell 119:19–31 [DOI] [PubMed] [Google Scholar]
- Splawski I, Timothy KW, Decher N, Kumar P, Sachse FB, Beggs AH, Sanguinetti MC, Keating MT (2005) Severe arrhythmia disorder caused by cardiac L-type calcium channel mutations. Proc Natl Acad Sci USA 102:8089–8096 discussion 8086–8 [DOI] [PMC free article] [PubMed] [Google Scholar]
- Splawski I, Yoo DS, Stotz SC, Cherry A, Clapham DE, Keating MT (2006) CACNA1H mutations in autism spectrum disorders. J Biol Chem 281:22085–22091 [DOI] [PubMed] [Google Scholar]
- Stanley EF (1997) The calcium channel and the organization of the presynaptic transmitter release face. Trends Neurosci 20:404–409 [DOI] [PubMed] [Google Scholar]
- Surmeier DJ (2007) Calcium, ageing, and neuronal vulnerability in Parkinson’s disease. Lancet Neurol 6:933–938 [DOI] [PubMed] [Google Scholar]
- Suzuki C (2001) Immunochemical and mutational analyses of P-type ATPase Spf1p involved in the yeast secretory pathway. Biosci Biotechnol Biochem 65:2405–2411 [DOI] [PubMed] [Google Scholar]
- Suzuki C, Shimma YI (1999) P-type ATPase spf1 mutants show a novel resistance mechanism for the killer toxin SMKT. Mol Microbiol 32:813–823 [DOI] [PubMed] [Google Scholar]
- Takuma H, Kwak S, Yoshizawa T, Kanazawa I (1999) Reduction of GluR2 RNA editing, a molecular change that increases calcium influx through AMPA receptors, selective in the spinal ventral gray of patients with amyotrophic lateral sclerosis. Ann Neurol 46:806–815 [DOI] [PubMed] [Google Scholar]
- Tipper DJ, Harley CA (2002) Yeast genes controlling responses to topogenic signals in a model transmembrane protein. Mol Biol Cell 13:1158–1174 [DOI] [PMC free article] [PubMed] [Google Scholar]
- Vashist S, Frank CG, Jakob CA, Ng DT (2002) Two distinctly localized p-type ATPases collaborate to maintain organelle homeostasis required for glycoprotein processing and quality control. Mol Biol Cell 13:3955–3966 [DOI] [PMC free article] [PubMed] [Google Scholar]
- Wuytack F, Raeymaekers L, Missiaen L (2003) PMR1/SPCA Ca2+ pumps and the role of the Golgi apparatus as a Ca2+ store. Pflugers Arch 446:148–153 [DOI] [PubMed] [Google Scholar]
- Xiang M, Mohamalawari D, Rao R (2005) A novel isoform of the secretory pathway Ca2+, Mn(2+)-ATPase, hSPCA2, has unusual properties and is expressed in the brain. J Biol Chem 280:11608–11614 [DOI] [PubMed] [Google Scholar]
Associated Data
This section collects any data citations, data availability statements, or supplementary materials included in this article.