Abstract
To achieve dual optimization of the mechanical properties and environmental impacts of geopolymer concrete (GPC), this study proposes a high-strength geopolymer concrete (HSGPC) without coarse aggregate. The mix proportion of HSGPC was optimized using the response surface methodology, targeting compressive strength and splitting tensile strength to determine the optimal mix. Additionally, the carbon emission impact of HSGPC was assessed and compared with ordinary Portland cement concrete, ultra-high-performance concrete, and reactive powder concrete. The results indicate that the optimal mix proportion for HSGPC includes 15% fly ash content, 10.30% silica fume content, alkali activator ratio of 2.5, and a NaOH molar concentration of 10 M. Simultaneously, the carbon emissions of HSGPC are reduced by about 30% compared to ordinary Portland cement concrete. Compared to ultra-high-performance concrete and reactive powder concrete of the same strength, the production of HSGPC respectively reduces carbon emissions by 59.87% and 68.24%. This study not only provides valuable technical support for the practical application of GPC in engineering but also holds significant implications for promoting sustainable development in the construction industry.
Keywords: High strength geopolymer concrete, Mix proportion, Compressive strength, Splitting tensile strength, Carbon emission
Subject terms: Civil engineering, Composites
Introduction
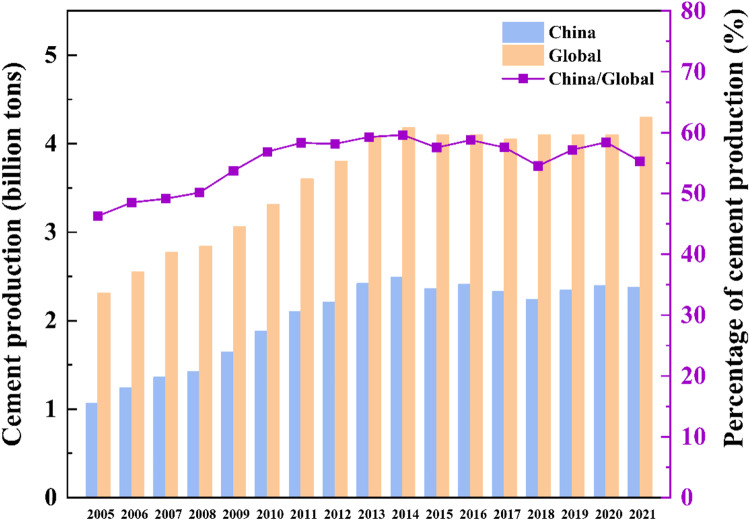
Concrete has become the most widely used construction material in the construction industry. However, the production of conventional cement concrete requires a significant amount of cement, which consumes vast natural resources and energy while generating substantial carbon emissions1. According to statistics, China’s annual carbon emissions increase year by year, ranking first in the world. The carbon emissions of countries worldwide are shown in Fig. 1. Additionally, Fig. 2 shows the global total cement production and China’s cement production from 2005 to 2021, showing that over the past decade, China’s cement production has consistently exceeded 50% of the global total. Studies indicate that carbon dioxide (CO2) emissions produced during cement production constitute approximately 5–7% of the global carbon emissions2,3. The production of 1 ton of cement generates approximately 0.8 tons of CO23. Therefore, the production of cement has a serious negative impact on the environment. Reducing the use of cement in concrete presents a significant opportunity to decrease carbon dioxide emissions into the atmosphere. In recent years, geopolymer concrete (GPC) have emerged as potential alternatives to traditional Portland cement concrete4. They are typically composed of aluminosilicate materials such as fly ash (FA), Ground granulated blast furnace slag (GGBFS), and alkali activators like sodium silicate (Na2SiO3) and sodium hydroxide (NaOH)5,6. According to related studies, GPC production emits 70–80% less carbon than ordinary Portland cement concrete (OPCC)7. The widespread use of GPC can promote the green recycling of industrial solid waste, significantly reduce environmental pollution, save energy and resources, and it possesses high early compressive strength, low shrinkage, significant creep resistance, good acid resistance, excellent bonding strength, and good fire resistance. It has broad application prospects in fields such as building structures and transportation pavements8.
Figure 1.
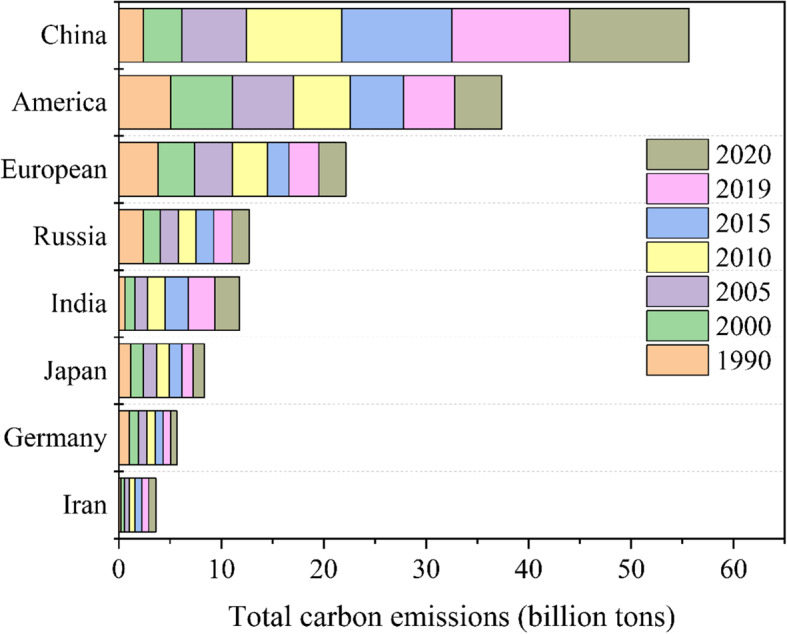
Statistics of carbon emissions by countries worldwide.
Figure 2.
Cement production statistics, 2005–2021.
The raw materials for GPC primarily include cementitious materials made from industrial by-products and natural materials. Currently, the most commonly used materials for GPC are FA9–12, GGBFS13–15, silica fume (SF)16 and metakaolin17,18. By using these wastes as raw materials, not only can the carbon emissions produced during the cement manufacturing process be reduced, but the accumulation of industrial waste can also be decreased. Furthermore, some researchers have begun studying the preparation of GPC using industrial by-products and waste materials, such as coal washing waste19, recycled crumb rubber20, chromite dust21, nickel slag22, waste marble powder23 and red mud24,25. The use of these materials not only contributes to environmental impact but also demonstrates excellent mechanical properties. However, due to limitations in the sources of raw materials and insufficient strength to meet the demands of practical engineering, GPC cannot be widely used in actual projects. Therefore, this paper selects commonly used industrial by-products as raw materials for the preparation of high-strength GPC.
The design of mix proportions is a crucial step in ensuring materials achieve the desired performance. To enhance the precision and reliability of the mix design, researchers have extensively studied the GPC mix design using scientific methods in recent years. These methods optimize factors such as the water-binder ratio, alkali activator ratio (Na2SiO3/NaOH), NaOH molar concentration, and curing conditions to achieve the best mechanical properties3,26–28. Reddy et al. developed a mix design method for GPC based on FA and GGBFS, achieving compressive strengths of 32 to 66 MPa under ambient curing conditions29. Balamurali et al. optimized the mix design for HSGPC based on FA and GGBFS using the Taguchi method, and evaluated its sustainability performance in terms of cost efficiency, carbon efficiency, and energy efficiency30. Furthermore, Balamurali et al. developed a self-compacting GPC without high-efficiency water reducers, experimenting and analyzing factors such as water to binder ratio, content and ratio of alkali activators, and optimizing the mix ratio to achieve the desired target compressive strength and sustainability index31. Li et al. developed an optimization model for the mix design of FA and GGBFS-based GPC, considering compressive strength, cost, and carbon emissions, using machine learning and particle swarm optimization algorithms7. Although certain achievements have been made in the study of GPC mix design, research on the preparation and mix design of GPC without coarse aggregates remains an unexplored area.
The response surface central composite design (RSCCD) method is an optimization technique that integrates experimental design and mathematical modeling to describe the relationship between response variables and independent variables, thus achieving multi-objective optimization. Hafiz et al. determined the optimal mix ratio of graphene nanoplatelets and rubber in FA-based GPC using the RSCCD method32. Iman et al. used the RSCCD method to design and optimize the mix ratio of GPC containing SF and recycled coarse and fine aggregates33. Zhang et al. determined the optimal mix ratio for GPC based on FA and GGBFS using the RSCCD method34. In summary, the RSCCD method has been widely used in the engineering field in recent years. Therefore, this article uses the RSCCD method to optimize the mix ratio of HSGPC without coarse aggregates, which is significant for enhancing its widespread applicability and sustainability in the construction industry.
To address the aforementioned issues, this paper proposes a method for preparing HSGPC without coarse aggregate. GGBFS, FA, and SF are used as cementitious materials, and manufactured sand as fine aggregate to produce HSGPC. On this basis, the mix proportion of HSGPC is designed and optimized using RSCCD method. The effects of FA content, SF content, Na2SiO3/NaOH, and molar concentration of NaOH on the mechanical properties of HSGPC were investigated. A mechanical property prediction model for HSGPC was established, and a highly applicable HSGPC mix design scheme was proposed. The microstructural characteristics of HSGPC were analyzed using SEM testing, and its environmental impact was assessed. In summary, this study provides valuable references for developing HSGPC with both excellent mechanical properties and low carbon emissions, contributing to the sustainable development and widespread application of GPC in practical engineering.
Materials and methods
Materials
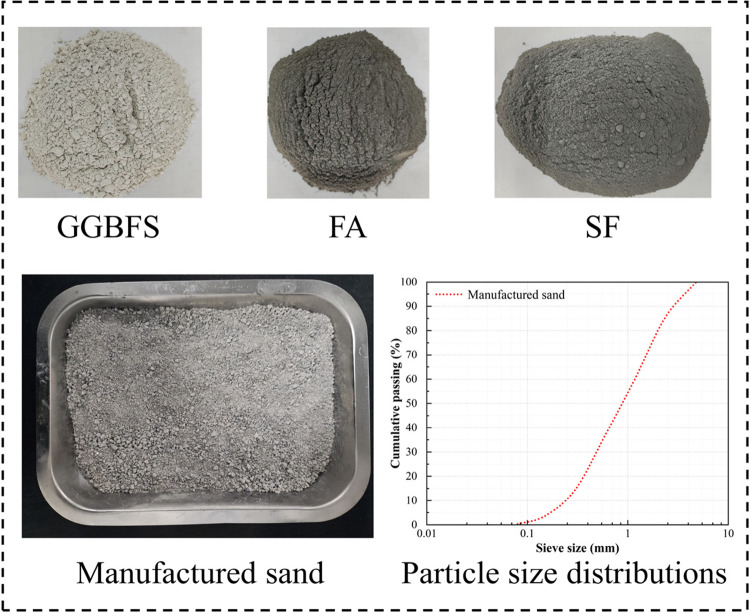
The cementitious materials used in this study include GGBFS (S95 grade) with a specific surface area of 429 m2/kg, produced by Gongyi Longze Water Purification Materials Co., Ltd. FA is supplied by Hebei Shengyi Mineral Products Trading Co., Ltd, with a specific surface area of 290 m2/kg. SF is Elkem 920 produced by Shandong Boron Silicon Material Co., Ltd., with a specific surface area of 18,000 m2/kg. The fine aggregate utilized is manufactured sand produced by Changchun Baisheng Mining Co., Ltd. The photographs of materials and particle size distributions of the manufactured sand are depicted in Fig. 3. The alkali activators consist of NaOH and Na2SiO3, where the NaOH is in the form of white flakes with a purity of 99%. The sodium oxide (Na2O) content in the Na2SiO3 solution is 13.5%, with a silicon dioxide (SiO2) content of 30%. Zinc sulfate is used as the retarder.
Figure 3.
Materials and particle size distributions.
RSCCD method
The response surface methodology is a technique used to model and optimize complex relationships between response variables and input variables. It has been widely applied in the optimization design of concrete mix proportions35,36. In this study, RSCCD method37 was used to optimize the mix proportion of HSGPC. The influencing factors included the FA content (A), the SF content (B), the Na2SiO3/NaOH (C), and the NaOH molar concentration (D). The response values included the CS and STS. The experimental factors and level design are presented in Table 1.
Table 1.
Experimental factors and level design.
| Name | Units | Level range | ||
|---|---|---|---|---|
| -1 | 0 | + 1 | ||
| A | % | 5 | 10 | 15 |
| B | % | 9 | 10 | 11 |
| C | N/A | 1.5 | 2 | 2.5 |
| D | M | 10 | 12 | 14 |
Using the Design-expert software, the experimental design was conducted for the influencing factors and response values of HSGPC, with a total of 30 experimental points designed, including 24 factorial points and 6 central points. The proportion of HSGPC mix components is shown in Table 2.
Table 2.
The proportion of HSGPC mix components (kg/m3).
| Num | GGBFS | SF | FA | MS | NaOH | Na2SiO3 | Retarder | Water |
|---|---|---|---|---|---|---|---|---|
| 1 | 817 | 47.5 | 85.5 | 1108 | 133 | 199.5 | 9.5 | 332.5 |
| 2 | 722 | 142.5 | 85.5 | 1108 | 133 | 199.5 | 9.5 | 332.5 |
| 3 | 798 | 47.5 | 104.5 | 1108 | 133 | 199.5 | 9.5 | 332.5 |
| 4 | 703 | 142.5 | 104.5 | 1108 | 133 | 199.5 | 9.5 | 332.5 |
| 5 | 817 | 47.5 | 85.5 | 1108 | 95 | 237.5 | 9.5 | 332.5 |
| 6 | 722 | 142.5 | 85.5 | 1108 | 95 | 237.5 | 9.5 | 332.5 |
| 7 | 798 | 47.5 | 104.5 | 1108 | 95 | 237.5 | 9.5 | 332.5 |
| 8 | 703 | 142.5 | 104.5 | 1108 | 95 | 237.5 | 9.5 | 332.5 |
| 9 | 817 | 47.5 | 85.5 | 1108 | 133 | 199.5 | 9.5 | 332.5 |
| 10 | 722 | 142.5 | 85.5 | 1108 | 133 | 199.5 | 9.5 | 332.5 |
| 11 | 798 | 47.5 | 104.5 | 1108 | 133 | 199.5 | 9.5 | 332.5 |
| 12 | 703 | 142.5 | 104.5 | 1108 | 133 | 199.5 | 9.5 | 332.5 |
| 13 | 817 | 47.5 | 85.5 | 1108 | 95 | 237.5 | 9.5 | 332.5 |
| 14 | 722 | 142.5 | 85.5 | 1108 | 95 | 237.5 | 9.5 | 332.5 |
| 15 | 798 | 47.5 | 104.5 | 1108 | 95 | 237.5 | 9.5 | 332.5 |
| 16 | 703 | 142.5 | 104.5 | 1108 | 95 | 237.5 | 9.5 | 332.5 |
| 17 | 855 | 0 | 95 | 1108 | 110.83 | 221.67 | 9.5 | 332.5 |
| 18 | 665 | 190 | 95 | 1108 | 110.83 | 221.67 | 9.5 | 332.5 |
| 19 | 779 | 95 | 76 | 1108 | 110.83 | 221.67 | 9.5 | 332.5 |
| 20 | 741 | 95 | 114 | 1108 | 110.83 | 221.67 | 9.5 | 332.5 |
| 21 | 760 | 95 | 95 | 1108 | 166.25 | 166.25 | 9.5 | 332.5 |
| 22 | 760 | 95 | 95 | 1108 | 83.125 | 249.38 | 9.5 | 332.5 |
| 23 | 760 | 95 | 95 | 1108 | 110.83 | 221.67 | 9.5 | 332.5 |
| 24 | 760 | 95 | 95 | 1108 | 110.83 | 221.67 | 9.5 | 332.5 |
| 25 | 760 | 95 | 95 | 1108 | 110.83 | 221.67 | 9.5 | 332.5 |
| 26 | 760 | 95 | 95 | 1108 | 110.83 | 221.67 | 9.5 | 332.5 |
| 27 | 760 | 95 | 95 | 1108 | 110.83 | 221.67 | 9.5 | 332.5 |
| 28 | 760 | 95 | 95 | 1108 | 110.83 | 221.67 | 9.5 | 332.5 |
| 29 | 760 | 95 | 95 | 1108 | 110.83 | 221.67 | 9.5 | 332.5 |
| 30 | 760 | 95 | 95 | 1108 | 110.83 | 221.67 | 9.5 | 332.5 |
HSGPC sample preparation
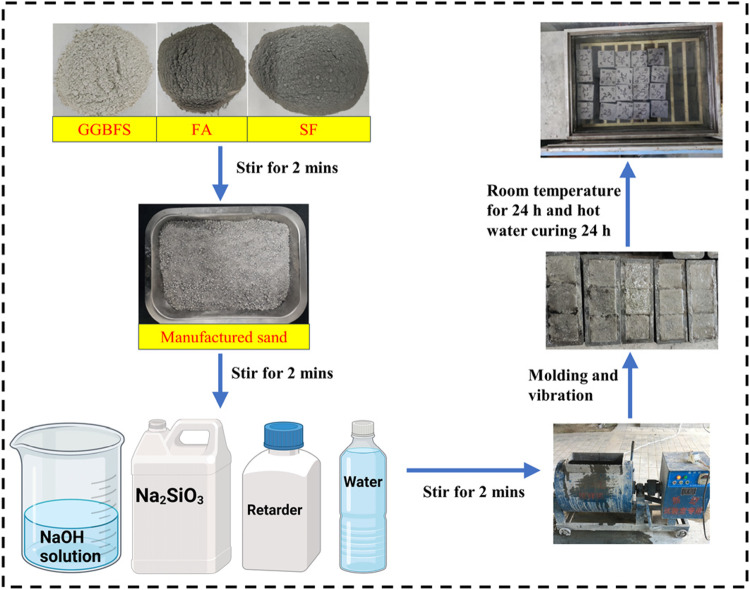
Prior to the preparation of HSGPC, pre-mix NaOH solutions of 10 M, 12 M, and 14 M, then mix the Na2SiO3 solution with the NaOH solution to prepare the alkaline activator, and cool it to room temperature23. During the experiment, GGBFS, FA, and SF are mixed in a blender for 2 min. Then, the manufactured sand is added and mixed for an additional 1 min. Subsequently, the alkali activator and the mixture of retarder with water is introduced into the blender and mixed for 2 min. The mixed slurry is poured into molds with dimensions. The concrete is vibrated on the vibration table for 2 min to eliminate internal air bubbles and achieve a void-free structure, and then placed under room temperature conditions for 24 h of curing. Afterward, the specimens were demolded after being cured at room temperature for 24 h, transferred to 80 °C hot water curing chamber for an additional 24 h24. The preparation process of the HSGPC is illustrated in Fig. 4.
Figure 4.
Preparation process of HSGPC.
Testing methods
The experiment was conducted following the “Standard Test Methods for Mechanical Properties of Ordinary Concrete” (GB/T 50081 − 2002). Cubic specimens with dimensions of 100 × 100 × 100 mm were selecting for testing the compressive strength (CS) and splitting tensile strength (STS) of HSGPC. The loading rate of CS test is controlled between 0.5 and 0.8 MPa/s and between 0.05 and 0.08 MPa/s for the STS test. To obtain scientifically reliable data, six specimens were prepared for each group to conduct CS and STS tests, and the test results were averaged from three samples for each test.
Results and discussions
Optimum design of mixture ratio of GPC
By utilizing Design-Expert design software and following the four-factor, three-level, and two-response analysis, the optimized design scheme for HSGPC composition was established. It consists of 30 experimental points, including 24 factorial points and 6 central points. The experiments were conducted six times to estimate errors. Details of the experimental design and the response values are shown in Table 3.
Table 3.
Center composite design scheme and response values.
| No. | A | B | C | D | CS/MPa | STS/MPa |
|---|---|---|---|---|---|---|
| 1 | 5 | 9 | 1.5 | 10 | 83.34 | 4.88 |
| 2 | 15 | 9 | 1.5 | 10 | 82.06 | 4.71 |
| 3 | 5 | 11 | 1.5 | 10 | 81.42 | 5 |
| 4 | 15 | 11 | 1.5 | 10 | 81.95 | 4.87 |
| 5 | 5 | 9 | 2.5 | 10 | 85.14 | 4.88 |
| 6 | 15 | 9 | 2.5 | 10 | 87.31 | 4.87 |
| 7 | 5 | 11 | 2.5 | 10 | 82.88 | 4.91 |
| 8 | 15 | 11 | 2.5 | 10 | 86.73 | 4.89 |
| 9 | 5 | 9 | 1.5 | 14 | 79.62 | 4.4 |
| 10 | 15 | 9 | 1.5 | 14 | 72.18 | 4.24 |
| 11 | 5 | 11 | 1.5 | 14 | 74.98 | 4.59 |
| 12 | 15 | 11 | 1.5 | 14 | 68.77 | 4.77 |
| 13 | 5 | 9 | 2.5 | 14 | 83.39 | 4.89 |
| 14 | 15 | 9 | 2.5 | 14 | 80.32 | 4.87 |
| 15 | 5 | 11 | 2.5 | 14 | 79.86 | 5.15 |
| 16 | 15 | 11 | 2.5 | 14 | 76.24 | 5.07 |
| 17 | 0 | 10 | 2 | 12 | 87.06 | 4.79 |
| 18 | 20 | 10 | 2 | 12 | 84.81 | 4.71 |
| 19 | 10 | 8 | 2 | 12 | 85.8 | 4.45 |
| 20 | 10 | 12 | 2 | 12 | 81.82 | 4.8 |
| 21 | 10 | 10 | 1 | 12 | 69.36 | 4.59 |
| 22 | 10 | 10 | 3 | 12 | 80.35 | 5.25 |
| 23 | 10 | 10 | 2 | 8 | 84.15 | 5.03 |
| 24 | 10 | 10 | 2 | 16 | 68.22 | 4.73 |
| 25 | 10 | 10 | 2 | 12 | 80.85 | 4.95 |
| 26 | 10 | 10 | 2 | 12 | 79.85 | 4.96 |
| 27 | 10 | 10 | 2 | 12 | 80.25 | 4.91 |
| 28 | 10 | 10 | 2 | 12 | 80.85 | 4.92 |
| 29 | 10 | 10 | 2 | 12 | 80.15 | 4.89 |
| 30 | 10 | 10 | 2 | 12 | 80.56 | 4.91 |
Modeling the HSGPC center composite design
The Design-Expert software was used to identify the fitting model that best suits the input data and to obtain the regression equations for CS and STS, as demonstrated in Table 4. In both cases, the p-values for the quadratic polynomial model are less than 0.0001, with F-values of 123.91 and 43.92. In addition, the quadratic polynomial model exhibits the least difference between the corrected determination coefficient and the predicted residual sum. In this context, the p-value signifies the significance level, and the F-value indicates the level of significant differences in the fitting model. A higher F-value suggests greater model significance and a better fit. Therefore, the quadratic polynomial model was selected as the fitting model for the CS and STS response models.
Table 4.
ANOVA of the CS and STS regression model.
| Name | Source | Sequential p-value | Lack of Fit p-value | Adjusted R2 | Predicted R2 |
|---|---|---|---|---|---|
| CS | Linear | < 0.0001 | < 0.0001 | 0.6155 | 0.4827 |
| 2FI | 0.3656 | < 0.0001 | 0.6301 | 0.6106 | |
| Quadratic | < 0.0001 | 0.1288 | 0.9862 | 0.9636 | |
| Cubic | 0.0719 | 0.3977 | 0.9937 | 0.9305 | |
| STS | Linear | < 0.0001 | 0.0004 | 0.5676 | 0.4409 |
| 2FI | 0.0027 | 0.0018 | 0.7836 | 0.7476 | |
| Quadratic | < 0.0001 | 0.2725 | 0.9784 | 0.9463 | |
| Cubic | 0.0864 | 0.8962 | 0.9894 | 0.9807 |
Predictive formulas for CS and STS of HSGPC were derived using software analysis to flexibly select appropriate mix proportions based on engineering strength requirements, as shown in Eq. (1). and Eq. (2).
Predictive models for CS response values:
 |
1 |
Predictive models for STS response values:
 |
2 |
HSGPC center composite design model effectiveness analysis
A credibility analysis of the CS and STS models for HSGPC was conducted to verify the effectiveness of the fitting models, and the results are presented in Table 5. The determination coefficient R2 measures how close the R2 value is to 1, indicating a higher degree of model fit35. The determination coefficients for the two response models are 0.9929 and 0.971, signifying good model fits for CS and STS responses. A strong correlation exists between predicted and observed values, and the experimental errors are minimal. The adjusted determination coefficient for the CS response model is 0.9862, suggesting that this model can effectively estimate and explain 98.62% of the CS response values, with only 1.38% of CS response values not accounted for by the model. For the STS response model, the adjusted determination coefficient is 0.9439, indicating that approximately 5.61% of STS response values cannot be reliably predicted and explained by the model.
Table 5.
Confidence tests for quadratic polynomial regression models.
| Name | Std. Dev. | Mean | CV.% | Press | R 2 | R 2 Adj | R 2 Pred | Adeq precision (%) |
|---|---|---|---|---|---|---|---|---|
| CS | 0.6047 | 80.34 | 0.7527 | 28.07 | 0.9929 | 0.9862 | 0.9636 | 44.4933 |
| STS | 0.0328 | 4.82 | 0.6800 | 0.0775 | 0.9888 | 0.9784 | 0.9463 | 43.1015 |
To further assess the validity of the model, a significance analysis was conducted on the quadratic polynomial model. The results of the significance analysis for the coefficients of the CS and STS regression models are presented in Table 6, respectively.
Table 6.
Regression model coefficient significance model.
| Name | Various | Sum of squares | Degree of freedom | Mean square | f-value | p-value | Significant or not | |||||
|---|---|---|---|---|---|---|---|---|---|---|---|---|
| CS | A | 15.96 | 1 | 15.96 | 43.63 | < 0.0001 | Yes | |||||
| B | 33.82 | 1 | 33.82 | 92.48 | < 0.0001 | Yes | ||||||
| C | 147.66 | 1 | 147.66 | 403.75 | < 0.0001 | Yes | ||||||
| D | 317.77 | 1 | 317.77 | 868.9 | < 0.0001 | Yes | ||||||
| AB | 1.09 | 1 | 1.09 | 2.97 | 0.1053 | No | ||||||
| AC | 11.78 | 1 | 11.78 | 32.22 | < 0.0001 | Yes | ||||||
| AD | 40.99 | 1 | 40.99 | 112.09 | < 0.0001 | Yes | ||||||
| BC | 0.0086 | 1 | 0.0086 | 0.0234 | 0.8805 | No | ||||||
| BD | 7.28 | 1 | 7.28 | 19.9 | 0.0005 | Yes | ||||||
| CD | 7.52 | 1 | 7.52 | 20.57 | 0.0004 | Yes | ||||||
| A2 | 54.6 | 1 | 54.6 | 149.3 | < 0.0001 | Yes | ||||||
| B2 | 21.23 | 1 | 21.23 | 58.04 | < 0.0001 | Yes | ||||||
| C2 | 50.66 | 1 | 50.66 | 138.53 | < 0.0001 | Yes | ||||||
| D2 | 28.91 | 1 | 28.91 | 79.04 | < 0.0001 | Yes | ||||||
| Residual | 5.49 | 15 | 0.3657 | |||||||||
| Lack of fit | 4.67 | 10 | 0.467 | |||||||||
| Pure error | 0.8161 | 5 | 0.1632 | |||||||||
| STS | A | 0.0315 | 1 | 0.0315 | 29.37 | < 0.0001 | Yes | |||||
| B | 0.152 | 1 | 0.152 | 141.55 | < 0.0001 | Yes | ||||||
| C | 0.5673 | 1 | 0.5673 | 528.30 | < 0.0001 | Yes | ||||||
| D | 0.1552 | 1 | 0.1552 | 144.53 | < 0.0001 | Yes | ||||||
| AB | 6.25E-06 | 1 | 6.25E-06 | 0.0058 | 0.9402 | No | ||||||
| AC | 0.0127 | 1 | 0.0127 | 11.79 | 0.0037 | Yes | ||||||
| AD | 0.0002 | 1 | 0.0002 | 0.1455 | 0.7082 | No | ||||||
| BC | 0.0023 | 1 | 0.0023 | 2.10 | 0.1678 | No | ||||||
| BD | 0.0189 | 1 | 0.0189 | 17.61 | 0.0008 | Yes | ||||||
| CD | 0.2998 | 1 | 0.2998 | 279.13 | < 0.0001 | Yes | ||||||
| A2 | 0.0518 | 1 | 0.0518 | 48.19 | < 0.0001 | Yes | ||||||
| B2 | 0.1530 | 1 | 0. 1530 | 142.48 | < 0.0001 | Yes | ||||||
| C2 | 0.0000 | 1 | 0.0000 | 0.0224 | 0.8829 | No | ||||||
| D2 | 0.0033 | 1 | 0. 0033 | 3.06 | 0.1009 | No | ||||||
| Residual | 0.0161 | 15 | 0.0011 | |||||||||
| Lack of fit | 0.0126 | 10 | 0.0013 | |||||||||
| Pure error | 0.0035 | 5 | 0.0007 | |||||||||
The significance test is determined by the magnitude of the p-value, where a p-value less than 0.01 indicates a highly significant impact, and a p-value less than 0.05 indicates a significant impact. The f-value represents the degree of influence of each factor38. Table 6 show that the first-order terms A, B, C, and D, the second-order terms A2 and B2, and the interaction terms BD and CD have significant impacts on CS and STS. This finding indicates the interactions among SF content, Na2SiO3/NaOH, and NaOH molar concentration. The order of influence on CS, from greatest to least, is FD > FC > FB > FA, whereas the order of influence on STS, from greatest to least, is FC > FD > FB > FA. This result suggests that Na2SiO3/NaOH and NaOH molar concentration have greater impacts on the mechanical properties of HSGPC, whereas FA content and SF content have relatively smaller impacts. This is consistent with previous research findings39. In particular, the molar concentration of NaOH has the greatest impact on the CS of HSGPC, while the mass ratio of Na2SiO3/NaOH solution has the greatest impact on the STS of HSGPC.
As the molar concentration of NaOH increases, it promotes the formation of monomer bonds, improves the polymerization process, and enhances the dissolution rate of aluminosilicates. Additionally, increasing the NaOH molar concentration improves the microstructural porosity, making the structure more compact and thereby enhancing the mechanical properties of HSGPC40. Elevating the Na2SiO3/NaOH facilitates the dissolution of more aluminosilicates, contributing to the formation of Si-O-Si and Si-O-Al bonds, resulting in an improvement in the mechanical properties of HSGPC. Therefore, there is a direct relationship between the Na2SiO3/NaOH and NaOH molar concentration with the mechanical performance39.
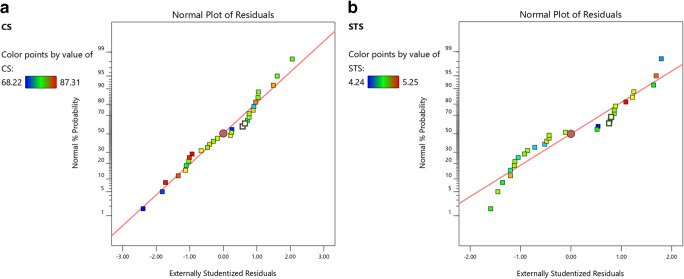
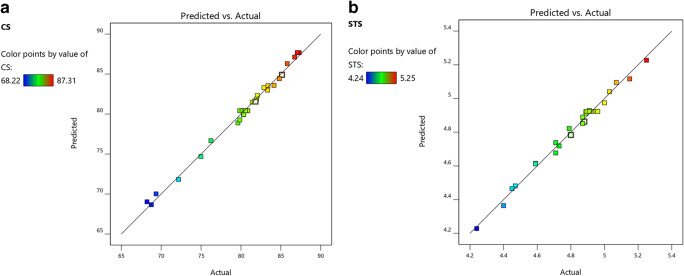
Figure 5 shows that all data points in the residual plots for CS and STS responses are distributed near the regression line. This finding indicates the presence of a normal error distribution in the experiments. Figure 6 shows that the predicted values of CS and STS are very close to the actual values, indicating that the model has high credibility.
Figure 5.
Residual plots of CS and STS response values.
Figure 6.
The relationship between CS and STS response values and actual values.
HSGPC mix proportion optimization
The study evidently shows that the FA content, SF content, Na2SiO3/NaOH and NaOH molar concentration have varying degrees of influence on the CS and STS of HSGPC. The experimental results were optimized to obtain the optimal mix proportion of HSGPC that can simultaneously achieve the maximum CS and STS, and the optimization results are presented in Table 7.
Table 7.
The optimal solution of HSGPC mix proportion.
| Name | Goal | Limit | Optimum Solution | |
|---|---|---|---|---|
| A (%) | In range | 5 | 15 | 15 |
| B (%) | In range | 9 | 11 | 10.30 |
| C (-) | In range | 1.5 | 2.5 | 2.50 |
| D (M) | In range | 10 | 14 | 10 |
| CS (MPa) | Maximize | 68.22 | 87.31 | 86.51 |
| STS (MPa) | Maximize | 4.24 | 5.25 | 4.96 |
Therefore, the optimal mix proportion for HSGPC consists of 15% FA content, 10.30% SF content, a Na2SiO3/NaOH of 2.5, and a NaOH molar concentration of 10 M. Experimental tests were conducted to validate the reliability of this optimal mix proportion for HSGPC, and the results are presented in Table 8.
Table 8.
Table of relationships between actual value and predicted value.
| Name | CS | STS |
|---|---|---|
| Actual value (MPa) | 83.04 | 4.75 |
| Predicted value (MPa) | 86.51 | 4.96 |
| Error (%) | 4.18 | 4.44 |
In summary, the test results show a slight variance between the measured values and the predicted values, with a relative error within 5%. Moreover, all the measured parameters satisfy the specified requirements. This finding indicates that the RSCCD model has high reliability in fitting various parameters and can accurately determine the optimal mix proportion for HSGPC. In comparison with the mechanical performance results reported in existing literature41, the use of ternary solid waste not only improves mechanical performance but also opens up new possibilities for the design of low-carbon and environmentally friendly HSGPC.
SEM analysis of HSGPC
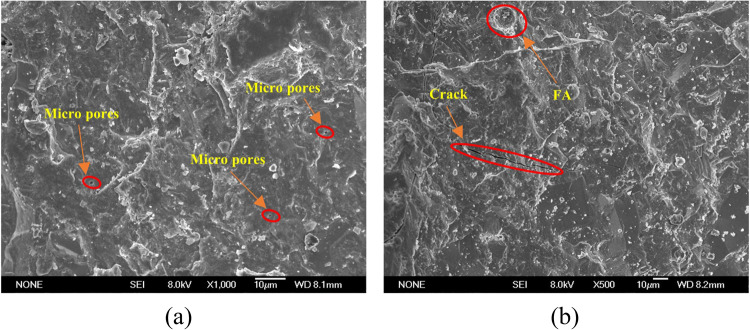
Figure 7 shows the Scanning Electron Microscope (SEM) image of HSGPC, from which it can be seen that GPC has a dense microstructure with only a few micro pores visible. This is attributed to GPC undergoing polymerization reactions to form sodium aluminate silicate hydrate (N-A-S-H) and calcium aluminate silicate hydrate (C-A-S-H) gels. Under high-temperature curing conditions, FA and GGBFS accelerate the polymerization reactions, forming dense N-A-S-H and C-A-S-H gels, increasing the matrix density30,42,43. These gels can bind the polymer products with the unreacted binder particles, filling the voids within the internal structure, thereby forming a uniform and dense microstructure, which enhances strength, similar to findings in previous studies31,44. Additionally, a small number of micro-cracks were observed in the SEM images, which may have formed during the compressive strength test of the samples, similar to findings reported in previous studies44.
Figure 7.
SEM analysis of HSGPC.
Carbon emission impacts assessment
Research on GPC is significant for environmental and sustainability aspects. In recent years, researchers have conducted extensive studies on the cost-effectiveness, energy efficiency, and ecological benefits of GPC43,45. Additionally, differences in sustainability performance between GPC and OPCC have been compared46,47.
To determine the differences in carbon emissions between HSGPC, OPCC, UHPC, and RPC, this study evaluates the carbon emissions produced during the preparation of raw materials used in HSGPC, OPCC, UHPC, and RPC. Based on existing literature, the carbon emission factors ( ) of each material in concrete are summarized. The carbon emissions of each material are calculated by multiplying the mass of the raw material by its carbon emission factor, and the total carbon emission formula for concrete is shown below.
 |
3 |
where  is the total carbon emission of concrete production,
  is quality of material consumption in concrete production,
  is the factor of carbon emission for materials consumption.
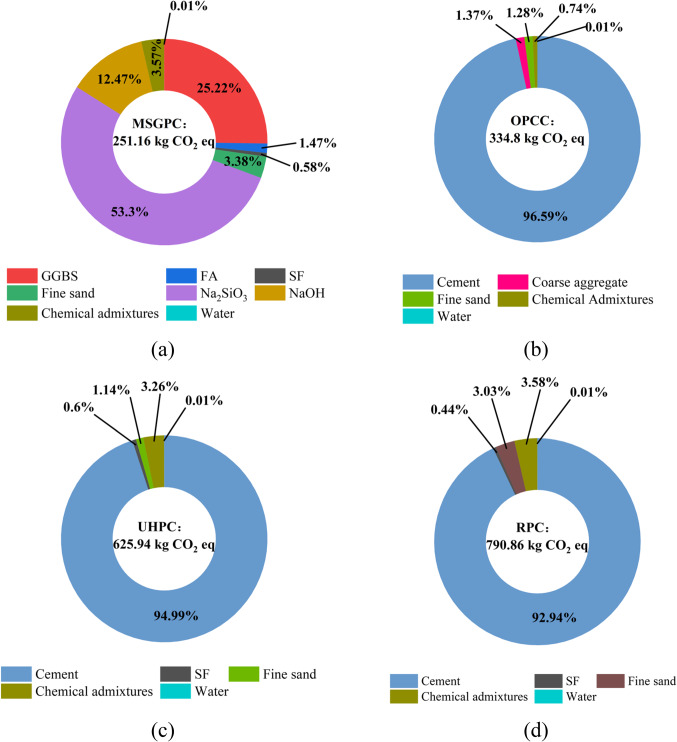
Subsequently, the carbon emissions for producing 1 m3 of HSGPC in this study were calculated. Concurrently, the carbon emissions for preparing 1 m3 of OPCC48 UHPC49 and RPC50 with reported strength values comparable in the literature were calculated for reference, as shown in Table 9. The results indicate that the carbon emissions for producing HSGPC are the lowest, with the carbon emissions for preparing UHPC and RPC significantly higher than HSGPC. Compared to OPCC, the carbon emissions of HSGPC have been reduced by approximately 30%. Compared to UHPC and RPC, HSGPC can reduce carbon emissions by 59.87% and 68.24%, respectively. This further underscores the significant advantages of HSGPC in terms of low-carbon environmental sustainability.
Table 9.
Calculation of carbon emissions for one cubic meter of concrete.
| Raw materials | Carbon emission factor (kg CO2 eq/ kg) | Carbon emission (kg CO2 eq/m3) | |||
|---|---|---|---|---|---|
| HSGPC | OPCC | UHPC | RPC | ||
| Cement | 0.735 (GB/T 51336-2019) | 0 | 323.4 | 594.62 | 735 |
| FA | 0.02651 | 3.7 | 0 | 0 | 0 |
| GGBFS | 0.090151 | 63.34 | 0 | 0 | 0 |
| SF | 0.01452 | 1.46 | 0 | 3.78 | 3.5 |
| Quartz sand | 0.002452 | 0 | 0 | 0 | 24 |
| River sand | 0.006653 | 0 | 4.29 | 7.12 | 0 |
| Manufactured sand | 0.00765153 | 8.48 | 0 | 0 | 0 |
| Coarse aggregate | 0.003951 | 0 | 4.59 | 0 | 0 |
| Na2SiO3 | 0.67154 | 133.86 | 0 | 0 | 0 |
| NaOH | 0.7554 | 31.32 | 0 | 0 | 0 |
| Chemical Admixtures | 0.944 55 | 8.97 | 2.49 | 20.39 | 28.32 |
| Water | 0.0002 51 | 0.03 | 0.03 | 0.04 | 0.04 |
| Total | N/A | 251.16 | 334.8 | 625.94 | 790.86 |
The proportion of carbon emissions from the raw materials of HSGPC, OPCC, UHPC, and RPC is illustrated in the Figure 8. Clearly, in the raw materials for preparing HSGPC, the carbon emissions from GGBFS, Na2SiO3, and NaOH constitute a relatively high proportion. This is attributed to the higher dosage of GGBFS and the substantial energy consumption associated with Na2SiO3 and NaOH during production 56. In the raw materials for preparing OPCC, UHPC and RPC, over 90% of carbon emissions originate from cement. Although the preparation of UHPC reduces the cement dosage compared to RPC, the significant proportion of cement still leads to relatively high carbon emissions. This indicates that HSGPC reduces carbon emissions without compromising strength, demonstrating significant sustainability and application potential.
Figure 8.
CO2 emissions ratio of each raw material: (a) HSGPC; (b) OPCC; (c) UHPC; (d) RPC.
Conclusions
To develop a green and high-strength GPC, this study proposes an HSGPC without coarse aggregate. Using RSCCD method, the CS and STS of HSGPC were optimized to determine a reliable mix ratio. Based on this, differences in environmental impact between HSGPC, OPCC, UHPC, and RPC were analyzed, leading to the following conclusions.
Based on the analysis of various influencing factors, the order of factors affecting the CS of HSGPC is: FD > FC > FB > FA, for STS, the order is: FC > FD > FB > FA.
The optimal mix ratio for HSGPC optimized by RSCCD method is as follows: FA content 15%, SF content 10.30%, Na2SiO3/NaOH of 2.5, and NaOH molarity of 10 M. Experimental verification shows that the error between the model predicted values and actual values is within 5%, indicating that this mix ratio is reliable.
Based on carbon emission assessment analysis, producing 1 m3 of HSGPC can reduce carbon emissions by about 30% compared to OPCC. The production of 1 m³ HSGPC results in a reduction of carbon emissions by 59.87% compared to UHPC and 68.24% compared to RPC.
Acknowledgements
This work was supported by the Jilin Scientific and Technological Development Program (20190303033SF).
Author contributions
M. L. : Software, Validation, Formal analysis, Investigation, Data curation, Writing - original draft, Writing - review & editing, Visualization.W. D. : Conceptualization, Methodology, Project administration, Funding acquisition.W.J. : Methodology, Supervision, Resources, Formal analysis, Data curation.M. L. : Investigation, Methodology, Software, Formal analysis, Data curation.X. Y. : Investigation, Supervision. Y. H. : Investigation, Methodology. M. H. : Investigation, Resources.
Data availability
All data generated or analyzed during this study are included in this published article.
Declarations
Competing interests
The authors declare no competing interests.
Footnotes
Publisher’s note
Springer Nature remains neutral with regard to jurisdictional claims in published maps and institutional affiliations.
Contributor Information
Weidong Jin, Email: jinwd@jlu.edu.cn.
Mingrui Li, Email: limingrui329@nenu.edu.cn.
References
- 1. Haddad, R. H. & Alshbuol, O. Production of geopolymer concrete using natural pozzolan: A parametric study. Constr. Build. Mater.114, 699–707 (2016).
- 2. Sukontasukkul, P., Pongsopha, P., Chindaprasirt, P. & Songpiriyakij, S. Flexural performance and toughness of hybrid steel and polypropylene fibre reinforced geopolymer. Constr. Build. Mater.161, 37–44 (2018).
- 3. Maddalena, R., Roberts, J. J. & Hamilton, A. Can Portland cement be replaced by low-carbon alternative materials? A study on the thermal properties and carbon emissions of innovative cements. J. Clean. Prod.186, 933–942 (2018).
- 4. Davidovits, J. Properties of geopolymer cements. in First international conference on alkaline cements and concretes 1, 131–149 (1994).
- 5. Castel, A., Foster, S. J., Ng, T., Sanjayan, J. G. & Gilbert, R. I. Creep and drying shrinkage of a blended slag and low calcium fly ash geopolymer Concrete. Mater. Struct.49, 1619–1628 (2016).
- 6.Wudil, Y. S., Al-Fakih, A., Al-Osta, M. A. & Gondal, M. A. Intelligent optimization for modeling carbon dioxide footprint in fly ash geopolymer concrete: A novel approach for minimizing CO2 emissions. J. Environ. Chem. Eng.12, 111835 (2024).
- 7. Li, Y., Shen, J., Lin, H. & Li, Y. Optimization design for alkali-activated slag-fly ash geopolymer concrete based on artificial intelligence considering compressive strength, cost, and carbon emission. J. Build. Eng.75, 106929 (2023).
- 8. de Toledo Pereira, D. S. et al. Comparative analysis between properties and microstructures of geopolymeric concrete and portland concrete. J. Mater Res. Technol.7, 606–611 (2018).
- 9. Wang, Y., Zhong, H. & Zhang, M. Experimental study on static and dynamic properties of fly ash-slag based strain hardening geopolymer composites. Cem. Concr. Compos.129, 104481 (2022).
- 10. Jumaa, N. H., Ali, I. M., Nasr, M. S. & Falah, M. W. Strength and microstructural properties of binary and ternary blends in fly ash-based geopolymer concrete. Case Stud. Constr. Mater.17, e01317 (2022).
- 11. Çelik, A. İ., Özkılıç, Y. O., Bahrami, A. & Hakeem, I. Y. Effects of glass fiber on recycled fly ash and basalt powder based geopolymer concrete. Case Stud. Constr. Mater.19, e02659 (2023).
- 12. Cecen, F., Özbayrak, A. & Aktaş, B. Experimental modal analysis of fly ash-based geopolymer concrete specimens via modal circles, mode indication functions, and mode shape animations. Cem. Concr. Compos.137, 104951 (2023).
- 13. Xie, J., Wang, J., Rao, R., Wang, C. & Fang, C. Effects of combined usage of GGBS and fly ash on workability and mechanical properties of alkali activated geopolymer concrete with recycled aggregate. Compos. B Eng.164, 179–190 (2019).
- 14. Zheng, C., Mao, Z., Chen, L., Qian, H. & Wang, J. Development of a novel rapid repairing agent for concrete based on GFRP waste powder/GGBS geopolymer mortars. J. Build. Eng.71, 106542 (2023).
- 15. Gopalakrishna, B. & Dinakar, P. Mix design development of fly ash-GGBS based recycled aggregate geopolymer concrete. J. Build. Eng.63, 105551 (2023).
- 16. Wu, X., Shen, Y. & Hu, L. Performance of geopolymer concrete activated by sodium silicate and silica fume activator. Case Stud. Constr. Mater.17, e01513 (2022).
- 17. Bowen, F. et al. Investigation on the impact of different activator to solid ratio on properties and micro-structure of metakaolin geopolymer. Case Stud. Constr. Mater.16, e01127 (2022).
- 18. Amin, M., Elsakhawy, Y., Abu el-hassan, K. & Abdelsalam, B. A. Behavior evaluation of sustainable high strength geopolymer concrete based on fly ash, metakaolin, and slag. Case Stud. Constr. Mater.16, e00976 (2022).
- 19. Moradikhou, A. B., Safehian, M. & Golafshani, E. M. High-strength geopolymer concrete based on coal washing waste. Constr. Build. Mater.362, 129675 (2023).
- 20. Deng, Z., Yang, Z. & Pan, X. Synergetic effects of recycled crumb rubber and glass cullet on the engineering properties of geopolymer mortar. Cem. Concr. Compos.137, 104907 (2023).
- 21. Mishra, J., Nanda, B., Patro, S. K., Das, S. K. & Mustakim, S. M. Influence of ferrochrome ash on mechanical and microstructure properties of ambient cured fly ash-based geopolymer concrete. J. Mater. Cycles Waste Manag.24, 1095–1108 (2022).
- 22. Nguyen, Q. D. & Castel, A. Developing Geopolymer Concrete by Using Ferronickel Slag and Ground-Granulated Blast-Furnace Slag. Ceramics6, 1861–1878 (2023).
- 23. Danish, A. et al. Performance evaluation and cost analysis of prepacked geopolymers containing waste marble powder under different curing temperatures for sustainable built environment. Resour. Conserv. Recycl.192, 106910 (2023).
- 24. Qian, L.-P., Ahmad, M. R., Lao, J.-C. & Dai, J.-G. Recycling of red mud and flue gas residues in geopolymer aggregates (GPA) for sustainable concrete. Resour. Conserv. Recycl.191, 106893 (2023).
- 25. Shi, Y. et al. Preparation and curing method of red mud-calcium carbide slag synergistically activated fly ash-ground granulated blast furnace slag based eco-friendly geopolymer. Cem. Concr. Compos.139, 104999 (2023).
- 26. Gunasekara, C., Atzarakis, P., Lokuge, W., Law, D. W. & Setunge, S. Novel analytical method for mix design and performance prediction of high calcium fly ash geopolymer concrete. Polymers (Basel)13, 900 (2021). [DOI] [PMC free article] [PubMed]
- 27. Ou, Z., Feng, R., Mao, T. & Li, N. Influence of mixture design parameters on the static and dynamic compressive properties of slag-based geopolymer concrete. J. Build. Eng.53, 104564 (2022).
- 28. Pratap, B., Mondal, S. & Rao, B. H. NaOH molarity influence on mechanical and durability properties of geopolymer concrete made with fly ash and phosphogypsum. in Structures vol. 56 105035 (Elsevier, 2023).
- 29. Reddy, M. S., Dinakar, P. & Rao, B. H. Mix design development of fly ash and ground granulated blast furnace slag based geopolymer concrete. J. Build. Eng.20, 712–722 (2018).
- 30. Kanagaraj, B., Anand, N., Alengaram, U. J., Praveen, B. & Tattukolla, K. Performance evaluation on engineering properties and sustainability analysis of high strength geopolymer concrete. J. Build. Eng.60, 105147 (2022).
- 31. Kanagaraj, B., Anand, N., Alengaram, U. J. & Jayakumar, G. Promulgation of engineering and sustainable performances of self-compacting geopolymer concrete. J. Build. Eng.68, 106093 (2023).
- 32. Iqbal, H. W. et al. Effect of graphene nanoplatelets on engineering properties of fly ash-based geopolymer concrete containing crumb rubber and its optimization using response surface methodology. J. Build. Eng.75, 107024 (2023).
- 33. Aghajanzadeh, I., Ramezanianpour, A. M., Amani, A. & Habibi, A. Mixture optimization of alkali activated slag concrete containing recycled concrete aggregates and silica fume using response surface method. Constr. Build. Mater.425, 135928 (2024).
- 34. Zhang, Z. et al. The Influence of Fly Ash and Slag on the Mechanical Properties of Geopolymer Concrete. Buildings14, 2720 (2024).
- 35. Habibi, A., Ramezanianpour, A. M. & Mahdikhani, M. RSM-based optimized mix design of recycled aggregate concrete containing supplementary cementitious materials based on waste generation and global warming potential. Resour. Conserv. Recycl.167, 105420 (2021).
- 36. Dey, A. et al. Towards net-zero emission: A case study investigating geopolymer concrete’s sustainability potential using recycled glass powder and gold mine tailings. J. Build. Eng. 108683 (2024).
- 37. Rezaifar, O., Hasanzadeh, M. & Gholhaki, M. Concrete made with hybrid blends of crumb rubber and metakaolin: Optimization using Response Surface Method. Constr. Build. Mater.123, 59–68 (2016).
- 38. Venkatesan, M., Zaib, Q., Shah, I. H. & Park, H. S. Optimum utilization of waste foundry sand and fly ash for geopolymer concrete synthesis using D-optimal mixture design of experiments. Resour Conserv Recycl148, 114–123 (2019).
- 39. Aisheh, Y. I. A., Atrushi, D. S., Akeed, M. H., Qaidi, S. & Tayeh, B. A. Influence of polypropylene and steel fibers on the mechanical properties of ultra-high-performance fiber-reinforced geopolymer concrete. Case Studies in Construction Materials17, e01234 (2022).
- 40. Mousavinejad, S. H. G. & Sammak, M. An assessment of the effect of Na2SiO3/NaOH ratio, NaOH solution concentration, and aging on the fracture properties of ultra-high-performance geopolymer concrete: The application of the work of fracture and size effect methods. in Structures vol. 39 434–443 (Elsevier, 2022).
- 41. Kathirvel, P. & Sreekumaran, S. Sustainable development of ultra high performance concrete using geopolymer technology. J. Build. Eng.39, 102267 (2021).
- 42. Gopalakrishna, B. & Pasla, D. Development of metakaolin based high strength recycled aggregate geopolymer concrete. Constr. Build. Mater.391, 131810 (2023).
- 43. Kanagaraj, B., Anand, N., Alengaram, U. J., Raj, R. S. & Kiran, T. Exemplification of sustainable sodium silicate waste sediments as coarse aggregates in the performance evaluation of geopolymer concrete. Constr. Build. Mater.330, 127135 (2022).
- 44. Öz, A. et al. Characterization study of geopolymer concretes fabricated with clinker aggregates. Constr. Build. Mater.384, 131461 (2023).
- 45. Kanagaraj, B., Anand, N. & Lubloy, E. Performance evaluation of sodium silicate waste as a replacement for conventional sand in geopolymer concrete. J. Clean. Prod.375, 134172 (2022).
- 46. Kanagaraj, B., Anand, N., Raj, R. S. & Lubloy, E. Techno-socio-economic aspects of portland cement, geopolymer, and limestone calcined clay cement (LC3) composite systems: a-state-of-art-review. Constr. Build. Mater.398, 132484 (2023).
- 47. Kanagaraj, B., Lubloy, E., Anand, N., Hlavicka, V. & Kiran, T. Investigation of physical, chemical, mechanical, and microstructural properties of cement-less concrete–state-of-the-art review. Constr. Build. Mater.365, 130020 (2023).
- 48. Mithun, B. M. & Narasimhan, M. C. Performance of alkali activated slag concrete mixes incorporating copper slag as fine aggregate. J. Clean. Prod.112, 837–844 (2016).
- 49. Wu, Z., Shi, C., He, W. & Wu, L. Effects of steel fiber content and shape on mechanical properties of ultra high performance concrete. Constr. Build. Mater.103, 8–14 (2016).
- 50. Mostofinejad, D., Nikoo, M. R. & Hosseini, S. A. Determination of optimized mix design and curing conditions of reactive powder concrete (RPC). Constr. Build. Mater.123, 754–767 (2016).
- 51. Shobeiri, V., Bennett, B., Xie, T. & Visintin, P. A generic framework for augmented concrete mix design: Optimisation of geopolymer concrete considering environmental, financial and mechanical properties. J. Clean. Prod.369, 133382 (2022).
- 52. Qaidi, S. M. A. et al. Ultra-high-performance geopolymer concrete: A review. Constr. Build. Mater.346, 128495 (2022).
- 53. Zhu, X. et al. Research on carbon emission reduction of manufactured sand concrete based on compressive strength. Constr. Build. Mater.403, 133101 (2023).
- 54. Nguyen, L., Moseson, A. J., Farnam, Y. & Spatari, S. Effects of composition and transportation logistics on environmental, energy and cost metrics for the production of alternative cementitious binders. J. Clean. Prod.185, 628–645 (2018).
- 55. Müller, H. S., Haist, M. & Vogel, M. Assessment of the sustainability potential of concrete and concrete structures considering their environmental impact, performance and lifetime. Constr. Build. Mater.67, 321–337 (2014).
- 56. Sarkaz, A. M. H. et al. Performance assessment and economic and ecological analysis of carbon-negative recycled crumb rubber-based geopolymers. J. Clean. Prod.434, 139842 (2024).
Associated Data
This section collects any data citations, data availability statements, or supplementary materials included in this article.
Data Availability Statement
All data generated or analyzed during this study are included in this published article.


