

Abstract

Gold nanoparticles (AuNPs) in different shapes have been developed and investigated for the treatment of various diseases. However, the potential toxicological vulnerability of different organs to morphologies of AuNPs and the complication of the toxicological profile of AuNPs by other health risk factors (e.g., plastic particles) have rarely been investigated systematically. Therefore, in this study, we aimed to investigate the toxicological differences between the spherical and triangular AuNPs (denoted as AuS and AuT, respectively) and the toxicological modulations by micro- or nanosized polystyrene plastic particles (denoted as mPS and nPS, respectively) in mice. Systemic biochemical characterizations were performed after a 90 day oral gavage feeding to obtain toxicological comparisons in different organs. In the case of single exposure to gold nanoparticles, AuT was associated with significantly higher aspartate amino-transferase (168.2%, P < 0.05), superoxide dismutase (183.6%, P < 0.001), catalase (136.9%, P < 0.01), total cholesterol (132.6%, P < 0.01), high-density lipoprotein cholesterol (131.3%, P < 0.05), and low-density lipoprotein cholesterol (204.6%, P < 0.01) levels than AuS. In contrast, AuS was associated with a significantly higher nitric oxide level (355.1%, P < 0.01) than AuT. Considering the overall toxicological profiles in single exposure and coexposure with multiscale plastics, it has been found that AuS is associated with lower hepatotoxicity and lipid metabolism malfunction, and AuT is associated with lower neurotoxicity than AuS. This finding may facilitate the future therapeutic design by considering the priority in protections of different organs and utilizing appropriate material morphologies.
1. Introduction
Due to their unique property in plasmon resonance, gold nanoparticles (AuNPs) with different shapes (e.g., spherical and triangular) show magnificent promises in diversified applications, including drug delivery,1 biological imaging,2 photothermal therapy,3 radiofrequency therapy,4 and neurological therapy.5 Concurrently with the popularity of using AuNPs in therapies, exposure to AuNPs among patients is becoming even more frequent. Surging evidence in recent years supports the notion that AuNPs are playing a role with increasing importance based on its potential in diagnoses and treatment, and the exposure to AuNPs among patients will become more and more regular in the clinic. Accordingly, there are growing interests in understanding the toxicological profile of AuNPs comprehensively to alleviate and control the toxicities associated with AuNP-based therapies.6
Plastics usage poses a worldwide health risk as revealed by the findings of microplastics and nanoplastics in aquatic, terrestrial, and atmospheric systems.7 The broad and frequent daily usage of plastic products accelerates the accumulation of plastic particles in humans, thus inducing organ damages.8,9 Particularly, the use of disposable plastic products increased globally since the recent COVID-19 pandemic due to the inevitable utilizations of disposable protection suites and additional covers of packages to prevent virus spread.10 Polystyrene (PS) is one of the most widely used plastics for food packaging, cosmetics, and medical applications.11 Apart from the daily exposure to plastics, patients will receive additional exposure to plastics due to therapeutic needs, e.g., the use of intravenous catheters or other medical devices. Micro- and nanosized PS particles (denoted as mPS and nPS, respectively) have been reported to induce dysbiosis, inflammation, growth inhibition, oxidative stress, behavioral changes, transcriptional dysfunction, and gene expression alterations in a variety of organisms (fish, shrimp, turtles, mice, etc.).8,12,13 Therefore, plastic exposure constitutes a prevalent public health risk worthy of attention in therapies and the daily care of patients.
The unique property of AuNPs strongly depends on tailored morphologies and sizes;14 therefore, two shapes with one representing the isotropic gold nanoparticles (i.e., spherical) and the other representing the anisotropic gold nanoparticles (i.e., triangular) were chosen and studied. These two morphologies have been examined solely in previous studies.1 Moreover, it is reported that the coexposure of Au ion with other health risks, e.g., polystyrene nanoplastic particles,15 will modulate the toxicological profile, adding a challenge to the toxicity control in AuNP-based therapies. Therefore, in this study, we focus on the morphology effect of AuNPs on their biosafety by comparing two popularly used nanoparticle shapes: sphere and triangle (denoted as AuS and AuT, respectively). The toxicological differences between particle shapes were investigated in systems with AuNPs only and with coexposures to multiscale PS (mPS and nPS). Biochemical markers were characterized to reveal hepatotoxicity, nephrotoxicity, neurotoxicity, inflammatory responses, lipid metabolism malfunction, and gut microbial alterations. These toxicological data provide the basis for the selective vulnerability of different organs for exposure toward AuNPs in different morphologies and their coexposure with micro/nano-plastics. These results could potentially facilitate exploring ways to ease toxicity and thereafter enhance the biosafety of AuNPs within the context of other risk factors.
2. Experimental Section
2.1. Chemical and Apparatus
Gold(III) chloride trihydrate (CTAC), sodium citrate (Na3Ct), and cetyltrimethylammonium chloride were purchased from Sigma-Aldrich (Burlington, USA). Ascorbic acid, NaOH, and KI were purchased from Sinopharm Chemical Reagent (Zhejiang, CHN). PS in particle sizes of 5 μm (i.e., mPS) and 500 nm (i.e., nPS) were purchased from Macklin (Shanghai, CHN). All chemical reagents were analytically pure and used without further purification. Biochemical markers were measured with commercial kits and purchased from Nanjing Jiancheng Bioengineering (Jiangsu, CHN). The enzyme-linked immunosorbent assay (ELISA) kits were purchased from Calvin Biotechnology (Jiangsu, CHN).
Transmission electron microscopy (TEM) (HT7700, Hitachi, Tokyo, Japan) and scanning electron microscopy (SEM) (Zeiss Merlin Compact, Oberkochen, Germany) were utilized. A UV-1800 spectrophotometer (Shimadzu, Kyoto, Japan) was used to measure extinction spectra. Biochemical markers were measured with Varioskan Flash (Thermo Scientific, Massachusetts, USA). Deionized water (>18 MΩ·cm) was used throughout the experiments.
2.2. Syntheses of AuNPs
AuS with a diameter of about 20 nm was synthesized by the citrate reduction method.16 In brief, 1 mL of 1 wt % HAuCl4 was instilled into 95 mL of water. The solution underwent a slight boil after which 4 mL of 1.0 wt % Na3Ct was added instantly to reduce the HAuCl4. Heating and stirring continued until the red color of solution reached a steady state, and the solution was used after naturally cooling to room temperature. The synthesized sample was transferred to a brown bottle and refrigerate.
AuT with an edge length of 50 nm and a thickness of 20 nm was fabricated using a seedless approach.17 In the seedless growth process, CTAC was used as the surfactant; iodide ions were used as the shape-directing agent, and NaOH was used to adjust the pH of the growth solution. In brief, 1.6 mL 0.1 M CTAC, 8.135 mL ultrapure water, and 75 μL 0.01 M KI were mixed, followed by the addition of 100 μL tetrachloroaurate solution (obtained by mixing 80 μL 25 mM HAuCl4 and 20 μL 0.1 M NaOH in a 1:1 ratio). Upon the addition of 80 μL of 0.064 M ascorbic acid, the solution color changed from light yellowish to colorless. Finally, 10 μL of 0.1 M NaOH was rapidly added into the solution, and the solution color changes from colorless to red, then purple, and eventually blue, corresponding to the formation of anisotropic triangular gold nanoparticles. The growth process was completed in about 10–15 min. After purification by depletion flocculation,18 AuT was centrifuged to remove excess surfactants and then redispersed in water.
2.3. Animals and Experimental Design
The local institutional animal care and use committee approved the experimental protocol. A total number of 48 wild-type Institute of Cancer Research (ICR) mice (24 females and 24 males; 5 weeks old) were purchased from Jinan Pengyue Laboratory Animal Breeding Co., Ltd. All these mice were cultured in cages and acclimated for 1 week before involvement to the designed study (Figure 1). Mice were randomly distributed into six subcohorts in a gender balanced manner for further use. The acclimatization and housing environment for mice throughout the present study was a local animal facility with a 12 h-light/12 h-dark cycle, a temperature of 24 ± 4 °C, and a relative humidity of 60% ± 4%.
Figure 1.
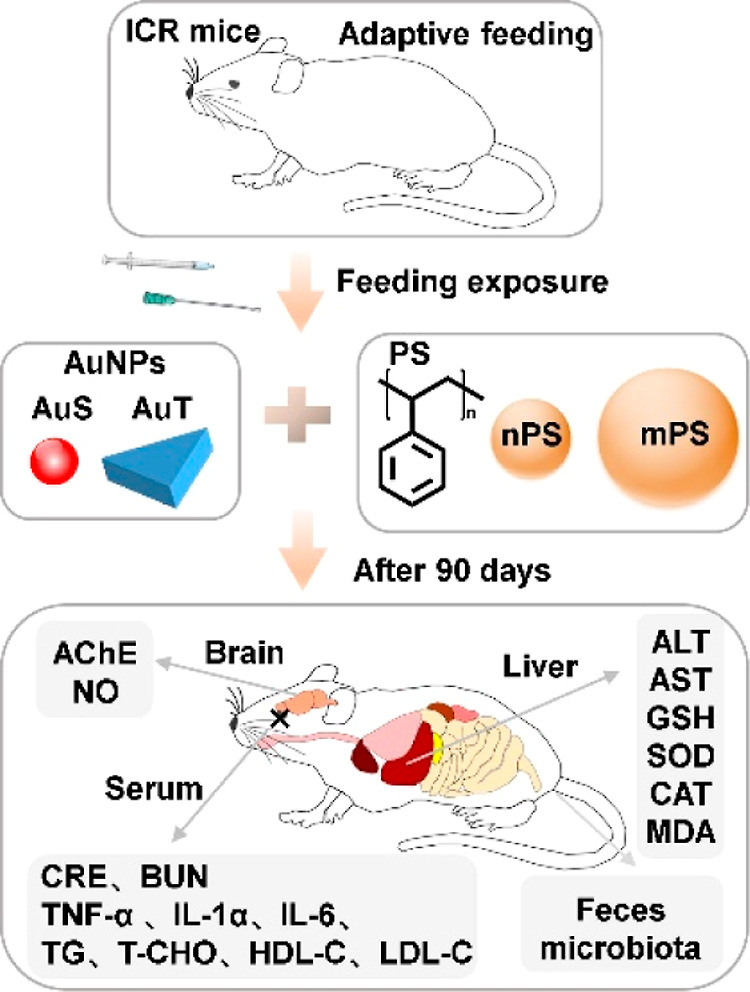
Schematic diagram of the experimental design.
The toxicity of plastics can vary with particle sizes. Therefore, in this study, two sizes with one representing the nanoscale plastics (i.e., 500 nm) and the other representing the microscale plastics (i.e., 5 μm) were chosen and studied. The mPS and nPS were diluted with ultrapure water and mixed with AuS and AuT for oral gavage feeding, and the final concentrations of PS and AuNPs in the feeding solutions were 30 mg/L.19 Toxicological comparisons between AuS and AuT were performed in two substudies: Study 1 focused the single exposure to AuNPs and Study 2 focused on the coexposure with PS. Study 1 included two groups: the AuS group (N = 8) receiving AuS solution and AuT group (N = 8) receiving AuT solution. Study 2 covered four groups: AuSnPS group (N = 8) receiving AuS and nPS, AuTnPS group (N = 8) receiving AuT and nPS, AuSmPS group (N = 8) receiving AuS and mPS, and AuTmPS group (N = 8) receiving AuT and mPS. Solutions were fed by an oral gavage at a volume of 10 μL per gram body weight (dosage at 0.3 mg/kg for PS and AuNPs) for 90 consecutive days with weekly recording of body weights (Figure 1).
2.4. Sample Collection
Two days before the autopsy, feces were collected, and stored at −80 °C for the microbial analyses. All mice were anesthetized with ether, and blood samples were collected for serum analysis. After euthanization, the liver, kidney, brain, spleen, heart, and lung were extracted. Tissue samples were rinsed with 0.9% normal saline to remove blood stains, dried with filter paper, and weighed with a balance for measuring organ coefficients. Samples (excluding those used for histopathological staining) were pretreated with liquid nitrogen and stored at −80 °C for later biochemical analyses.
2.5. Histopathological Analyses
Liver and kidney tissues were fixed in formalin (4%), embedded in paraffin wax, sectioned, and finally stained with hematoxylin and eosin (H&E) for microscopic observation.
2.6. Biochemical Analyses
As outlined in Figure 1, biochemical characterizations were performed to investigate hepatotoxicity, nephrotoxicity, neurotoxicity, lipid metabolism, and inflammation. Commercial kits were used to detect below biomarkers according to the manufacturer’s instructions (Nanjing Jianchen, Jiangsu, CHN). Activities of aspartate amino-transferase (AST) and alanine aminotransferase (ALT) were detected with a blood serum to show liver damage.20,21 For each liver sample, glutathione (GSH), superoxide dismutase (SOD), catalase (CAT), and malonaldehyde (MDA) were detected to examine the hepatotoxicity.21−23 For each kidney sample, contents of creatinine (CRE) and blood urea nitrogen (BUN) were detected to reflect nephrotoxicity.20,24 For each brain sample, acetylcholinesterase (AChE) activity and nitric oxide (NO) content of were detected to examine the neurotoxicity.22,25 Triglyceride (TG), the total cholesterol (T-CHO), high-density lipoprotein cholesterol (HDL-C), and low-density lipoprotein cholesterol (LDL-C) were detected with blood serum to gain insight into lipid metabolism.23,26,27
Levels of tumor necrosis factor (TNF-α), interleukin-1β (IL-1β), and interleukin-6 (IL-6) of the mice serum were determined by using a two-antibody one-step sandwich ELISA kits according to the manufacturer’s instructions (Calvin Biotechnology, Jiangsu, CHN) to represent inflammation.13,20,23 The measuring procedure for ELISA follows a basic protocol: specimens, standards, and HRP-labeled detection antibodies were added to the precoated microwells of TNF-α/IL-1β/ IL-6 antibodies, incubated, and washed thoroughly. Chromogenic with the substrate TMB, which was catalyzed by peroxidase and converted to its final yellow color by acid. There was a positive correlation between the shade of color and TNF-α/IL-1β/ IL-6 in the sample. Absorbance (OD value) was measured with a microplate reader at a wavelength of 450 nm to calculate the sample concentration. The data were obtained using a Varioskan Flash Reader (Thermo Fisher Scientific, USA).
2.7. Gut Microbial Analyses. DNA Extraction and PCR Amplification
Microbial community genomic DNA was extracted from feces using the PF Mag-Bind Stool DNA Kit (Omega Biotek, Georgia, U.S.) according to manufacturer’s instructions. DNA extract was examined on 1% agarose gel to determine the DNA concentration and purity using a NanoDrop 2000 UV–vis spectrophotometer (Thermo Scientific, USA). The extracted DNA samples were amplified from the V3–V4 region of the 16S rRNA and sequenced by Majorbio Biotechnology (Shanghai, CHN). The bacterial 16S rRNA genes were amplified using primers 338F (5′-ACTCCTACGGGAGGCAGCAG-3′) and 806R (5′-GGACTACHVGGGTWTCTAAT-3′). High throughput sequencing technology was conducted to reveal the alterations of the gut microbiota.
2.7.1. DNA Library Construction and Sequencing
Purified products were pooled in equimolar amounts, and the DNA library was constructed using the SMRTbell prep kit 3.0 (Pacifc Biosciences, USA) according to manufacturer’s instructions. Purified SMRTbell libraries were sequenced on the Pacbio Sequel IIe System (Pacifc Biosciences, USA) by Majorbio Bio-Pharm Technology Co. Ltd. (Shanghai, CHN).
2.7.2. Data Processing
PacBio raw reads were processed using the SMRTLink analysis software (version 11.0) to obtain high-quality Hifi reads with a minimum of three full passes and 99% sequence accuracy. For bacterial 16S rRNA gene, sequences with a length < 1000 or > 1800 bp were removed. The Hifi reads were clustered into operational taxonomic units (OTUs) using UPARSE 1128,29 with 97% sequence similarity level. The most abundant sequence for each OTU was selected as a representative sequence.
The metagenomic function was predicted by Phylogenetic Investigation of Communities by Reconstruction of Unobserved States (PICRUSt2)30 based on OTU representative sequences. PICRUSt2 is software containing a series of tools as follows: HMMER was used to align the OTU representative sequences with reference sequences. EPA-NG and Gappa were used to put representative sequences of the OTU into a reference tree. The castor was used to normalize the 16S gene copies. MinPath was used to predict gene family profiles and locate the gene pathways. Functional prediction of 16S amplicon sequencing results was performed by the PICRUSt2 software package. Software: PICRUSt2 (http://huttenhower.sph.harvard.edu/galaxy).
Bioinformatic analysis of the gut microbiota was carried out using the Majorbio Cloud platform (https://cloud.majorbio.com). Based on the OTU information, rarefaction curves and alpha diversity indices including observed OTUs, Shannon, Simpson, Chao, and Ace indexes were calculated with Mothur v1.30.2.31 The similarity among the microbial communities in different samples was determined by principal coordinate analysis (PCoA) based on Bray–Curtis dissimilarity using the Vegan v2.4.3 package. Annotation information, compositional abundances, and genetic risks of developing diseases associated with the microbial communities in tested samples were evaluated based on the Kyoto Encyclopedia of Genes and Genomes (KEGG) database.
2.8. Statistical Analysis
All data were presented as the mean ± standard error. Statistical analyses were performed using one-way ANOVA and Tukey’s test with Prism 8.0.2 and IBM SPSS Statistics 26. A P-value < 0.05 was considered as significant and confidence intervals was denoted as CI.
3. Results
3.1. Characterizations of AuNPs and PS Particles
TEM images confirmed the morphological properties of isotropic AuS and anisotropic AuT. AuS was featured by a diameter of about 20 nm (Figures 2a and S1 in the Supporting Information) and AuT was featured by a dimension of about 20 × 50 nm (thickness × width) (Figures 2b and S2). In the extinction spectra, AuS and AuT exhibited plasmon peaks at 521 and 663 nm (Figure 2c,d), respectively, supporting the structural differences between these two morphologies.32 The PS nanoparticles and microplastics (nPS and mPS) were characterized by diameters of about 500 nm (Figures 2e and S3a) and 5 μm (Figures 2f and S3b), respectively, according to the SEM images.
Figure 2.
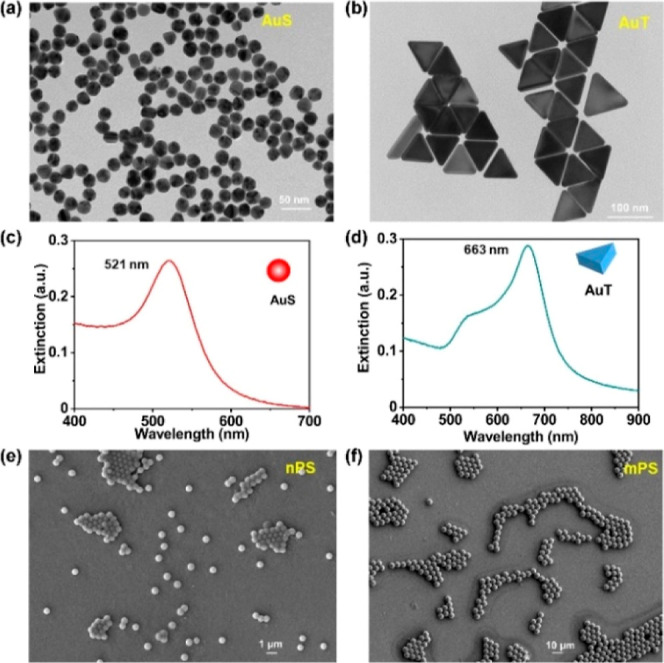
Basic characterizations of AuNPs and PS particles used in this study. TEM images (a,b) and extinction spectra (c,d) of AuS and AuT. SEM images of nPS (e) and mPS (f).
3.2. Study 1: Toxicological Profile of Single Exposure to AuNPs
3.2.1. Biochemical Changes after Exposure to AuNPs
According to the H&E staining, inflammatory cell infiltration was a common finding in both the liver (yellow arrows in Figure 3a,b) and kidney (blue arrows in Figure 3c,d). Organ coefficients were similar between the AuS and AuT groups (Figure 3e–i) except for the spleen (P < 0.001; 95.0% CI [0.397, 1.466]) (Figure 3j). Body weight did not show significant changes (Figure S4). These results suggested that the presence of cellular abnormality was not coupled to atrophy or compensatory hyperplasia in major organs.
Figure 3.

H&E staining (a–d) and organ coefficients (e–j) in the single exposure to AuNPs. H&E stained images of liver (a,b) and kidney (c,d) for the AuS and AuT groups. Yellow and blue arrows denoted inflammatory cell infiltration. Comparisons of organ coefficients between AuS and AuT in the liver (e), kidney (f), brain (g), heart (h), lung (i), and spleen (j). ***P < 0.001.
Levels of SOD, CAT, GSH, and MDA in unison with the enzyme activities of ALT and AST were measured to investigate the hepatotoxicity. The AuT group exhibited similar ALT (Figure 4a) but significantly higher AST (P < 0.05; 95.0% CI [−9.533, −0.527]) (Figure 4b) activities in comparison with the AuS group. Moreover, the AuT group exhibited significantly higher SOD (P < 0.001; 95.0% CI [−0.506, −0.191]) (Figure 4c) and CAT (P < 0.01; 95.0% CI [−0.280, −0.100]) (Figure 4d) activities, suggesting the existence of higher oxidative stress. GSH (Figure 4e) and MDA (Figure 4f) levels were similar among the AuS and AuT groups. These results revealed that the AuT exposure led to severer perturbation in the hepatic function than the AuS exposure.
Figure 4.

Biochemical markers in a single exposure to AuNPs. Hepatotoxicity was assessed by ALT (a), AST (b), SOD (c), CAT (d), GSH (e), and MDA (f). Nephrotoxicity was evaluated by BUN (g) and CRE (h). Neurotoxicity was represented by AChE (i) and NO (j). Inflammatory perturbation was assessed by TNF-α (k), IL-1β (l), and IL-6 (m). Lipid metabolism dysfunction was evaluated by TG (n), T-CHO (o), HDL-C (p), and LDL-C (q). *P < 0.05, **P < 0.01, and ***P < 0.001.
BUN and CRE were measured to investigate the glomerular filtration rate, thus reflecting the potential impairment of renal functions. The AuS group was found to be with a significantly higher BUN content (P < 0.001; 95.0% CI [1.693, 4.339]) (Figure 4g). Meanwhile, the AuS and AuT groups were similar in terms of CRE content (Figure 4h). It can be inferred that the kidney was more severely damaged by the AuS exposure.
The AChE activity and NO level were assessed to reveal potential neurotoxicity. The AChE activity was similar among the AuS and AuT groups (Figure 4i). By contrast, the NO level was significantly higher in the AuS group (P < 0.01; 95.0% CI [0.028, 0.151]) (Figure 4j), potentially suggesting the stimulation of higher cerebral perfusion to compensate the efficiency reduction of impaired neurons. Therefore, the AuS exposure led to neurotoxicity higher than that of the AuT exposure.
Levels of TNF-α, IL-1β, and IL-6 were determined to represent pro-inflammatory cytokines for the AuS and AuT groups. The TNF-α level was found to be significantly higher in the AuS group (P < 0.001; 95.0% CI [13.226, 18.387]) (Figure 4k), while the IL-1β level was significantly higher in the AuT group (P < 0.01; 95.0% CI [−9.241, −0.345]) (Figure 4l). In addition, the AuS and AuT groups showed similar IL-6 levels (Figure 4m). These cytokine levels implied that inflammatory responses exhibited a dependence on the nanoparticle shape. Further evaluations were still needed if a direct comparison of global inflammation levels between the AuS and AuT groups was targeted due to the inconsistent alterations in different cytokines.
Levels of TG, T-CHO, HDL-C, and LDL-C were detected to examine the potential alteration in the lipid metabolism. There was not a significant difference in the TG level (Figure 4n). The AuT group exhibited consistently higher T-CHO (P < 0.01; 95.0% CI [−1.893, −0.374]) (Figure 4o), HDL-C (P < 0.05; 95.0% CI [−1.146, −0.129]) (Figure 4p), and LDL-C (P < 0.01; 95.0% CI [−0.429, −0.043]) (Figure 4q) levels than the AuS group.
3.2.2. Microbial Alterations after the Single Exposure to AuNPs
Collectively, 345, 392 high-quality 16S rRNA sequences and 1156 operational taxonomic units (OTUs) at 97% identity were obtained. The AuT group exhibited significantly higher Chao and Ace indexes (P < 0.05; Figure 5a,b), and similar Shannon and Simpson indexes (Figure 5c,d) compared to the AuS group. There were 968 and 1015 OTUs in the AuS and AuT groups, respectively, with 827 OTUs shared (Sorensen coefficient = 83.41%) (Figure 5e). Furthermore, PCoA revealed a decent separation between the AuS and AuT groups based on the microbial composition (Figure 5f).
Figure 5.

Comparisons of gut microbiota between the AuS and AuT groups. Ace index (a), Chao index (b), Shannon index (c), and Simpson index (d) in gut microbiota after exposure to AuNPs; (e) Venn diagram for OTUs; (f) PCoA separation between the AuS and AuT groups; (g) dominant microbiotas at the family level; and (h) heatmap of gut microbial genes involved in diseases at Level 2 of the KEGG pathway annotation. *P < 0.05.
Apart from the community-level information on gut microbiota, differences in the dominant microbiomes were also investigated. Top 13 microbiotas with the largest microbial abundances (≥0.01%) were determined (Figure 5g). Among them, the AuT group exhibited higher Muribaculaceae and lower Erysipelotrichaceae (P < 0.05; Figure S5). Similar abundances were observed in the other 11 bacteria (Figure S5). Referring to the Level-2 KEGG pathway analyses, the AuS group showed significantly higher genetic abundances in microbiota, contributing to the biosynthesis of secondary metabolites and neurodegenerative diseases (Figures 5h and S6). These results suggest that the microbial richness, microbial composition, dominant microbial species, and risk genetic abundances are differentially shaped by the morphology of AuNPs. The AuS exposure was generally associated with a higher toxicity related to the gut microbiota than the AuT exposure. In addition, by analyzing the KEGG pathway at Level 3 on the genes of gut bacteria, the AuS group was found to be associated with epithelial cell signaling in Helicobacter pylori infection (Figure S7).
Correlations between the biochemical biomarkers and microbial compositions are shown in Figure S8. Gut microbiota significantly related with biomarkers of hepatotoxicity (AST, ALT, SOD, MDA, and GSH), of hepatotoxicity (CRE and BUN), of neurotoxicity (AChE and NO), of inflammatory (IL-6, TNF-α, and IL-1β), and lipid dysfunction (TG, T-CHO, LDL-C, and HDL-C). Biochemical markers are selectively vulnerable to the gut microbiome, with certain biomarkers significantly affected by specific microbiomes. For instance, changes in liver biomarkers were coordinated with Butyricicoccaceae, Helicobacteraceae, Erysipelotrichaceae, Lachnospiraceae, Muribaculaceae, Enterococcaceae, and UCG-010; alterations in the kidney biomarkers were coordinated with Firmicutes, Lactobacillaceae, Helicobacteraceae, Erysipelotrichaceae, Peptococcaceae, and Muribaculaceae; changes in neuron biomarkers were coordinated with Clostridiaceae, Helicobacteraceae, Erysipelotrichaceae, Peptococcaceae, and Muribaculaceae; inflammation response were coordinated with Helicobacteraceae, Erysipelotrichaceae, Muribaculaceae, Monoglobaceae, Peptococcaceae, Ruminococcaceae, and Butyricicoccaceae; and lipid metabolism were coordinated with Lachnospiraceae, Akkermansiaceae, Prevotellaceae, and Muribaculaceae.
3.3. Study 2: Toxicological Profiles of Coexposures between AuNPs and PS Particles
3.3.1. Biochemical Alterations in Coexposures
H&E staining of liver (Figure 6a–d) and kidney (Figure 6e–h) sections revealed the occurrence of cell infiltration in all coexposure groups. Regarding the two groups with mPS, organ coefficients except the one for the spleen were similar (Figure 6i–n), showing a pattern identical to the case of single exposure to AuNPs. By contrast, the presence of nPS added a complicated modulation to the organ coefficients. The AuSnPS group was associated with a higher liver coefficient (P < 0.05; 95.0% CI [−0.080, 7.942]) (Figure 6i) and a lower kidney coefficient (P < 0.01; 95.0% CI [−3.946, −0.561]) (Figure 6j) compared to the AuTnPS group. Meanwhile, the spleen coefficients were similar among the AuSnPS and AuTnPS groups. Therefore, the coexposure of AuNPs with PS led to a size-dependent effect on the organ coefficients.
Figure 6.

H&E staining (a–h) and organ coefficients (i–n) in the coexposures. H&E stained images of liver (a–d) and kidney (e–h) for the AuSnPS, AuTnPS, AuSmPS, and AuTmPS groups. Yellow and blue arrows denoted inflammatory cell infiltration. Comparisons of organ coefficients among the coexposure groups for the liver (e), kidney (f), brain (g), heart (h), lung (i), and spleen (j). *P < 0.05, **P < 0.01, and ***P < 0.001.
Co-exposure with nanoscale PS. The AuSnPS group exhibited significantly lower AST (P < 0.01; 95.0% CI [−6.104, −1.592]) (Figure 7b) and lower SOD (P < 0.05; 95.0% CI [−0.349, 0.009]) (Figure 7c) than the AuTnPS group, corresponding to relatively lower activities of reactive oxidative species (ROS). Meanwhile, the BUN level was found to be higher in the AuSnPS group (P < 0.05; 95.0% CI [0.529, 3.774]) (Figure 7g), suggesting more renal damage. The presence of severer renal damage along with less hepatic injury in the AuSnPS group was consistent with its lower kidney coefficient and higher liver coefficient (Figure 6i,j). The AuSnPS group showed a higher AChE (P < 0.05; 95.0% CI [0.003, 0.023]) (Figure 7i) and higher NO (P < 0.01; 95.0% CI [0.028, 0.151]) (Figure 7j). The higher inhibitory activity (i.e., higher AChE) placed an additional barrier on the neurotransmission. As a compensatory process, neurons exhibited hyperactivities to promote neurotransmission, thus releasing higher NO to stimulate more blood flow and thereafter more nutrient supply. Changes in the inflammatory cytokines were diversified. The AuSnPS group was characterized by significantly higher TNF-α (P < 0.01; 95.0% CI [2.581, 11.935]) (Figure 7k) but lower IL-1β (P < 0.01; 95.0% CI [−6.414, −0.207]) (Figure 7l). The AuSnPS and AuTnPS groups were similar in the levels of ALT (Figure 7a), CAT (Figure 7d), GSH (Figure 7e), MDA (Figure 7f), CRE (Figure 7h), and IL-6 (Figure 7m). In addition, there was not a difference in TG, T-CHO, HDL-C, or LDL-C (Figure 7n–q), suggesting that the AuSnPS and AuTnPS groups shared a similar lipid metabolism.
Figure 7.

Biochemical markers in the coexposure to AuNPs and PS particles. Hepatotoxicity was assessed by ALT (a), AST (b), SOD (c), CAT (d), GSH (e), and MDA (f). Nephrotoxicity was evaluated by BUN (g) and CRE (h). Neurotoxicity was represented by AChE (i) and NO (j). Inflammatory perturbation was assessed by TNF-α (k), IL-1β (l), and IL-6 (m). Lipid metabolism dysfunction was evaluated by TG (n), T-CHO (o), HDL-C (p), and LDL-C (q). *P < 0.05, **P < 0.01, and ***P < 0.001.
Co-exposure with microscale PS. The AuSmPS group was characterized by significantly lower SOD (P < 0.05; 95.0% CI [−0.233, −0.035]) (Figure 7c), lower BUN (P < 0.05; 95.0% CI [−0.5044, −0.388]) (Figure 7g), and higher AChE (P < 0.05; 95.0% CI [0.001, 0.013]) (Figure 7i), suggesting lower activity of ROS (thereafter less hepatotoxicity), less nephrotoxicity, but higher neurotoxicity in comparison with the AuTmPS group. Like the coexposure with nPS, the inflammatory cytokines were affected diversely. Higher TNF-α (P < 0.01; 95.0% CI [1.935, 10.645]) (Figure 7k) but lower IL-1β (P < 0.01; 95.0% CI [−8.414, −1.103]) (Figure 7l) were observed in the AuSmPS group. There was not a difference in ALT (Figure 7a), AST (Figure 7b), CAT (Figure 7d), GSH (Figure 7e), MDA (Figure 7f), CRE (Figure 7h), NO (Figure 7j), and IL-6 (Figure 7m) between the AuSmPS and AuTmPS groups. Lipid metabolism (Figure 7n–q) was similar between the AuSmPS and AuTmPS groups.
Size effect of PS particles. Focusing the coexposures of AuS with mPS and nPS, there was not a significant difference (Figure 7) in any of the measured biomarkers. Between the coexposures of AuT with mPS and nPS, the AuTnPS group was associated with higher ALT (P < 0.05; 95.0% CI [−0.207, 15.495]) (Figure 7a), higher MDA (P < 0.05; 95.0% CI [0.104, 0.871]) (Figure 7f), lower BUN (P < 0.05; 95.0% CI [−4.550, −0.212]) (Figure 7g), and lower IL-1β (P < 0.05; 95.0% CI [−8.414, −1.103]) (Figure 7l). These results potentially indicate that the hepatic function was more vulnerably affected by the coexposure to AuT and nPS, and renal function and inflammatory response were more affected by the coexposure to AuT and microscale PS.
Mice of the four groups did not show global body weight loss (Figure S9), suggesting that the alterations of biochemical markers were the outcome of toxicological responses, instead of other systemic health problems.
3.3.2. Microbial Profiles Complicated by the Coexposures of AuNPs with PS Particles
A total of 690, 784 high-quality 16S rRNA sequences and 1303 OTUs at 97% identity were observed.
Co-exposure with nanoscale PS. Similar Ace, Chao, Shannon, and Simpson indexes were observed between the AuSnPS and AuTnPS groups (Figure 8a–d), suggesting similar global richness and diversities of the microbial community. PCoA supported this finding with a lack of separation between the AuSnPS and AuTnPS groups (Figure S10a). The similarity of microbial species, represented by the Sorensen coefficient, between the AuSnPS and AuTnPS groups was 86.55% (Figure 8e), higher than that between the AuS and AuT groups (83.41%). At the family level (≥0.01% abundance), there were 14 microbial species, including the 13 dominant microbiotas in the single exposure and Rs-E47_termite_group (Figures 8f and S11). These 14 dominant species were not significantly different in abundance between the AuSnPS and AuTnPS groups. By reference to the Level-2 KEGG pathway analyses, the risk genetic abundances of diseases were similar between AuSnPS and AuTnPS (Figures 8g and S12).
Figure 8.

Comparisons of gut microbiota among the groups with coexposures. Ace index (a), Chao index (b), Shannon index (c), and Simpson index (d) in gut microbiota after coexposures; (e) Venn diagram for OTUs; (f) dominant microbiotas at the family level; (g) heatmap of gut microbial genes involved in diseases at the Level 2 of the KEGG pathway annotation. *P < 0.05.
Co-exposure with microscale PS. The AuSmPS group exhibited significantly lower Chao and Shannon indexes but similar Ace and Simpson indexes than the AuTmPS group (Figure 8a–d) concurrently with similar compositions in major microbiota (Figure S10b). The Sorensen coefficient between the AuSmPS and AuTmPS groups was 85.01% (Figure 8e). Among the 14 top microbiotas with the largest abundances (≥0.01%) at the family level, the AuSmPS group exhibited lower abundances of Muribaculaceae and Akkermansiaceae, but higher abundance of Rs-E47_termite_group (Figures 8f and S11). By reference to the Level-2 KEGG pathway analyses, risk genetic abundances of biosynthesis of other secondary metabolites, cellular processes and signaling, enzyme families, genetic information processing, metabolism of cofactors and vitamins, metabolism of other amino acids, and neurodegenerative disease were higher in the AuTmPS group than in the AuSmPS group (Figures 8g and S12). By reference to the KEGG pathway analyses at Level 3 on the genes of gut microbial, the AuTnPS group was found to be associated with renal cell carcinoma, AuTmPS was found to be associated with viral myocarditis, systemic lupus erythematosus, small-cell lung cancer, prostate cancer, colorectal cancer, pathways in cancer, influenza A, tuberculosis, toxoplasmosis, African trypanosomiasis, chagas disease, epithelial cell signaling in H. pylori infection, and also increased potential risks of developing Type-I diabetes mellitus and Type-II diabetes mellitus (Figure S13).
Correlations between the biochemical biomarkers and microbial compositions are displayed in Figure S14. Gut microbiota significantly related to biomarkers of hepatotoxicity (CAT, MDA, ALT, SOD, GSH, and AST), of hepatotoxicity (CRE), of neurotoxicity (NO), of inflammation response (IL-1β, IL-6, and TNF-α), and lipid dysfunction (TG, HDL-C, and LDL-C). Biochemical markers had a selective susceptibility to the gut microbiome, and some biomarkers were significantly influenced by specific microbiomes. For instance, changes in liver biomarkers were associated with Clostridia, Firmicutes, Tannerellaceae, Acholeplasmataceae, Sutterellaceae, Enterococcaceae, Erysipelotrichaceae, Tannerellaceae, Rhodospirillales, and Streptococcaceae; changes in kidney biomarkers were associated with Prevotellaceae; changes in neuron biomarkers were associated with Clostridiaceae, Oscillospiraceae, and Acholeplasmataceae; inflammation response were associated with Sutterellaceae, Monoglobaceae, Clostridia, and Akkermansiaceae; lipid metabolism were associated with Erysipelotrichaceae, Tannerellaceae, Prevotellaceae, Bacteroidales, Bacteroidaceae, and Acholeplasmataceae.
Size effect of the PS particle. Regarding the coexposures involving AuS, there was not a significant difference in the Ace, Chao, Shannon, or Simpson indexes (Figure 8a–d). By contrast, the coexposure of AuT with nPS showed higher Simpson index than that with mPS (Figure 8d), suggesting a change in the diversity of microbial community. Sorensen coefficients were 86.19% (or 86.17%) between the two coexposure groups involving AuS (or AuT). Among the top 14 microbiotas with the largest abundances (≥0.01%) at the family level, there was not a significant difference between the AuSnPS and AuSmPS groups (Figure S11). By contrast, the AuTnPS group was associated with significantly higher Lactobacillaceae and lower Akkermansiaceae values than the AuTmPS group (Figures 8f and S11). Risk genetic abundances were similar between the coexposure groups involving AuS. By contrast, the AuTmPS group was associated with significantly higher abundances of biosynthesis of other secondary metabolites, cancers, enzyme families, genetic information processing, infectious diseases, metabolic diseases, metabolism of cofactors and vitamins, metabolism of other amino acids, metabolism of terpenoids and polyketides, and neurodegenerative disease in comparison with the AuTnPS group (Figures 8g and S12). In summary, PS exhibited a size effect on gut microbiota when coexposed to AuT but not AuS.
4. Discussion
To the best of our knowledge, our current study is the first to compare the toxicological profiles of different gold nanoparticles in the context of plastic particles, which are among the most prevalent health risk factors. We have measured a battery of biochemical markers and microbial abundances to compare the toxicological differences induced by morphology. The complication after the coexposure of AuNPs with plastic particles was also explored to offer guidance to the choice between spherical and triangular AuNPs in practical applications.
ALT and AST are coenzymes for the production of pyruvate and oxaloacetic acid, respectively, which play critical roles in the tricarboxylic acid cycle (TCA). Elevated ALT or AST generally indicates an increase in the TCA activity to meet the elevated requirement for energy due to increased cell activities or compensatory hypermetabolism. For example, after a fraction of cells are damaged by toxins, the remaining cells exhibit hyperactivities to compensate for the functional loss of damaged cells. Superoxide is a type of byproduct produced in normal metabolic processes or by environmental inductions and can be reduced by SOD/CAT to prevent oxidative damages. Increased SOD and CAT activities can be explained by the fact that Nrf2 (nuclear factor etythroid-2 related factor 2), which is one of the components of Nrf2/ARE (antioxidant response element) signaling pathway orchestrating the transcription of the in vivo antioxidant genes of SOD and CAT, increases at the protein level in the early stages of oxidative stress.33 GSH is an antioxidant necessary for normal functioning of red blood cells. Elevations of SOD, CAT, or GSH imply increased reactive oxygen species (ROS) and thereafter more severe oxidative damages. Meanwhile, the lipid may be oxidized by ROS to generate MDA, which will potentially react with DNA to cause mutations. SOD, CAT, GSH, and MDA reflect different processes in the ROS activities. Generally, AuNPs generate ROS from dioxygen due to their high surface/volume ratio and the specific electronic configuration of the surface Au atom.34 In addition, the oxidative stress can be caused by secondary effects derived from nanoparticle endocytosis and interactions with intracellular biomolecules or organelles. In the single exposure, the AuT group showed higher ROS activities (higher SOD and CAT). One potential reason lies in the opposite electrical properties of AuS and AuT particles. The positively charged AuT is characterized by a higher affinity for cell membranes (negatively charged) in comparison with AuS (negatively charged). Consequently, the absorption rate of AuS into the tissue was higher to facilitate the production of superoxide. After systematic comparisons over ALT, AST, SOD, CAT, GSH, and MDA, it can be found that the AuT exposure induced higher hepatotoxicity than the AuS exposure. The relatively higher hepatotoxicity associated with the AuT exposure did not change in coexposures with multiscale plastic particles. This phenomenon may also be driven by oxidative stress, which is supported by an increased SOD activity. The significant positive correlation between stress reactive enzyme activity (i.e., SOD or CAT) and lipid peroxidation product (MDA) level (Figure S15) shows enhanced substrate and activity of antioxidant enzymes following excess ROS. Nanoparticles can generate ROS via the degradation of the AuT surface coating (e.g., CTAC) or of the whole nanoparticle with the consequent release of free ions; ROS may also be produced by interactions with cell surface receptors and activation of intracellular signaling pathways.35 Uptake of positively charged nanotriangles by liver cells is ensured by electrostatic interactions between the AuT surface and the cell membrane. The negatively charged PS surface is likely to adsorb more positively charged AuT, so it is likely to cause a more severe uptake and accumulation in the organ. These findings are consistent with studies that microplastics exacerbated the toxicity of organophosphorus flame retardants.22
CRE indicates the content of final byproduct from the metabolism of creatine and phosphocreatine to supply energy for muscle. BUN indicates the content of byproduct from metabolism of protein or peptide. Normally, these byproducts will be cleaned away through kidney and, therefore, residual contents reflect the glomerular filtration rates and serve as common markers for the renal function.36 After long-term exposure to toxins, glomerular filtration will be performed, resulting in increased CRE or BUN values. In the single exposure and coexposures, there were significant changes in BUN but not CRE, suggesting that the renal functions were partly impaired. In the single exposure, AuS exposure led to higher nephrotoxicity. This is consistent with the report that nonspherical nanoparticles can stay closer to the vessel wall more efficiently than spherical nanoparticles and therefore cleared more quickly.37 A similar result has been found in a previous study that the acute exposure to the spherical titanium dioxide particles induced higher blood BUN levels in mice.36 The coexposure with nanosized PS did not change this finding. However, when complicated with the microsized PS, the AuT exposure bypassed the nephrotoxicity of the AuS exposure. Additionally, according to literature reports,38 ROS-mediated cytotoxicity was also considered to be the main mechanism of nephrotoxicity induced by exposure to metal-based nanoparticles.
There are three possible pathways for nanomaterials to cause damage in the central nervous system: (1) nanoparticles enter the body to trigger inflammatory responses, allowing a large number of inflammatory cytokines to enter the blood circulation to induce a systemic inflammation and thereafter functional impairment; (2) nanoparticles deposited in the central nervous system activate microglia to produce high expressions of neurotoxic molecules; and (3) nanoparticles impair the neurons during the propagation in the sensory nerves. AChE facilitates the hydrolysis of acetylcholine, which is a major neurotransmitter in the central nervous system accounting for normal cognitive functions. The overexpress of AChE will add additional barriers to challenge the normal transmission of the neuronal message. Consequently, neurons will possibly exhibit hyperactivities to transmit the same message and place higher energetic demand, which is finally met by releasing more NO into the artery to increase blood flow and thereafter more energy supply (i.e., blood glucose). Therefore, the NO level is an indirect measurement of neuronal damage. The AuS exposure consistently led to higher neurotoxicity than the AuT exposure in the single exposure and coexposures with multiscale PS. In addition, the increase in AChE was often accompanied by an increase in NO possibly due to the metabolic compensation and neurovascular coupling. Previous studies have shown that the distribution of small-size spherical AuNPs in the brain of rat is relatively higher.39 By contrast to the triangular AuNPs with long edges, the spherical AuNPs hold relatively higher permeability across the blood–brain barrier (BBB). When there are subtle BBB disruptions upon toxins, AuS will accumulate faster in the brain tissues to damage the neurons. Reports have shown that nanoparticles entering the central nervous system can cause certain neurotoxic effects, resulting in nerve tissue damage.40
TNF-α, IL-1β, and IL-6 are inflammatory cytokines denoting the level of systemic inflammation, which is often the first immune process ignited to protect an organism against toxins or pathogens. Inflammation responses are sensitive to toxins but lack in specificity. Therefore, other biomarkers beyond cytokine levels should be utilized to reveal more specific information. In the single exposure, the AuS exposure led to a higher TNF-α but lower IL-1β in comparison with the AuT exposure. Such opposite changes in the inflammatory cytokines result in the uncertainty of relative inflammation levels in the AuS and AuT exposures. The changing patterns of inflammatory cytokines were preserved when complicated by coexposures with multiscale PS. Similarly, the relative inflammation levels under coexposure conditions remain unclear. Further studies will be required if a direct comparison on the inflammatory level is desired.
Malfunctions in lipid metabolism can lead to various diseases, for example, fatty liver disease due to the accumulation of fat in the liver and vascular diseases due to enriched LDL-C in the vessel. Evaluations on the lipid-metabolism-related biomarkers will provide an objective assessment on the risks of developing diseases related to lipid metabolism malfunctions. HDL-C is an established atheroprotective marker. LDL-C places the risk of plaque built-up inside the arteries, leading to heart disease or vascular problems. These two markers have counteracting effects on the health of cardiovascular system; therefore, the ratio between HDL-C and LDL-C is often used as an assessment of overall pathological risk. In the single exposure, the AuT exposure led to higher T-CHO, HDL-C, and LDL-C. The ratio between HDL-C and LDL-C was significantly higher (Student’s t-test: P = 0.046) in the AuS (12.26 ± 2.80) than AuT (6.05 ± 0.44) exposure, suggesting that the AuT exposure led to higher risks of developing cardiovascular diseases. The LDL-C increase in the AuT exposure played a dominant role although there was also a significant increase in the beneficial factor of HDL-C. Interestingly, the coexposure with PS did not change the toxicological responses in lipid metabolism. The AuS and AuT in coexposures led to similar lipid metabolism features and thereafter similar risks of developing cardiovascular diseases. One possible explanation was that PS took a dominant role in perturbing lipid metabolism, thus overwhelming the relatively smaller morphometric effect of AuNPs on lipid metabolism. Malfunctions of lipid metabolism have been reported as an important feature relating to the PS exposures,41 which were attributed to the metabolic modulations by gut microbiota.
The characteristics of gut microbiota depend on the host’s genome, nutrition, and lifestyle.42 A balanced microbial composition introduces benefits to the host, whereas abnormal changes in the microbial community are associated with various metabolic disorders. Therefore, the microbial composition is reported as a sensitive marker for various diseases. The gut–organ axes (e.g., gut–brain axis, gut–liver axis, gut–kidney axis) provide opportunities for the communications between the gut microbial community and different organs. The pathological process can often perturb metabolic profiles, and the upregulation of a certain metabolite will facilitate the growth of certain microbiomes favoring this metabolite. As a reverse process, some of the end metabolites from the gut microbiota will enter the blood to regulate metabolic processes in different organs. In the current study, it has been found that the community compositions of gut microbiota were differentially affected by the AuNPs with different shapes. Regarding the alpha diversity, abundances of Muribaculaceae and Erysipelotrichaceae were significantly different between the AuS and AuT exposures. Muribaculaceae is one of the major microbiomes present in the healthy mice43 and can be perturbed by dietary changes. The abundance of Erysipelotrichaceae is reported to be positively correlated with TNF-α levels.44 Different microbiota are involved in different pathogenic or physiological process. For example, individuals with fewer Akkermansia exhibited disrupted the intestinal barrier function and vulnerability to develop inflammation.45Lactobacillus has been shown to enhance both systemic and mucosal immunity.46 Increased Firmicutes in the cecum promotes nutrient absorption and correlates with the development of obesity.47 High abundance of Verrucomicrobiota in healthy gut had been reported by several studies.48 By reference to the Level-2 KEGG pathway annotation, we found that the single AuS exposure led to higher risk genetic abundances in two disease categories in comparison to the AuT exposure. In coexposures with nPS, the AuS and AuT exhibited similar risk genetic abundances. However, in coexposures with mPS, the AuT led to higher risk genetic abundances in nine disease categories, suggesting that the coexposures with PS have largely altered the gut microbiota.
The relative toxicological severity between the AuS and AuT exposures is summarized in Table 1. The AuS particles were consistently associated with lower hepatotoxicity and higher neurotoxicity than the AuT particles under the single exposure and coexposures with plastic particles. Regarding the lipid metabolism, the AuS exposure is associated with less and similar malfunctions in the single- and coexposures compared to the AuT exposure. Collectively, the AuS particles exhibited less risk in lipid metabolism malfunction. Regarding the gut microbiota, the AuS particles led to increased genetic risks in two categories at the Level 2 of KEGG pathways (16.7%) in single exposure, similar genetic risks in the coexposure with nanosized PS, and smaller genetic risks in six categories (50.0%) in the coexposure with microsized PS. Based on Table 1, it can be inferred that the AuS is preferred when designing therapies in patients where protections of liver and lipid metabolism are of higher priorities (e.g., hepatic carcinoma and obesity). Meanwhile, AuT is preferred for therapies where protections of brain function are of higher priorities (e.g., brain cancer). A case-by-case consideration will be required when the renal function or gut microbial balance is the major concern (e.g., chronic kidney diseases and intestinal cancer).
Table 1. Summary of Toxicological Profiles under Different Conditions.
| toxicity of AuNPs | single exposure | with nPS | with mPS |
|---|---|---|---|
| hepatotoxicity | <a | < | < |
| nephrotoxicity | >b | > | < |
| neurotoxicity | > | > | > |
| lipid metabolism malfunction | < | =c | = |
| genetic risks in microbiotas | > | = | < |
Denotes AuS < AuT.
Denotes AuS > AuT.
Denotes AuS = AuT.
Regarding the toxicological investigation of AuNP and plastic particles, previous studies have largely focused on the groups with single exposure.23,26 The potential hazards of coexposure with other risk factors, such as micro-/nano-plastics, have often been overlooked. Careful examination on coexposure is critical, especially in some aspect of toxicities where coexposure totally alters the relative toxicity among certain groups; e.g., microbial alterations observed in this study were significantly modulated by plastic particles. In literature, Lee et al. investigated the in vivo toxicity of PS nanoplastics individually and then concurrently with Au ions15 and found that PS induced marginal effects on the survival, hatching rate, developmental abnormalities, and cell death of zebrafish embryos. However, these effects were synergistically exacerbated by the Au ion. Such exacerbation of toxicity was well correlated with the production of ROS and the pro-inflammatory responses, supporting the existence of a synergistic effect between PS and Au ions. In another study, Deng et al. performed the health risks of coexposure to organophosphorus flame retardants (OPFRs) and microplastics (MPs).22 The results displayed that OPFR coexposure with MPs induced more toxicity than OPFR exposure alone, which indicated that MPs aggravate the toxicity of OPFRs and highlight the health risks of MPs coexposure with other pollutants. Therefore, our current study may open important perspectives by drawing attention to examine coexposures in future toxicological studies. For example, alcohol use is popular in many countries. A toxicological study will benefit from an additional version at the coexposure with alcohol to generate a more accurate reference for the population with regular alcohol intake.
Findings in this study should be interpreted with several limitations. First, we focused on the toxicological comparisons between AuS and AuT under different conditions (e.g., single exposure or coexposures with other health risks) to facilitate the morphological selection in practical application of AuNPs. We did not aim to determine the toxicological consequences induced by single exposure to AuS, AuT, or plastic particles. Note that the toxicological characterizations focusing on these single exposures have been well documented in literature.26,27,49 Therefore, our current study constitutes a helpful complement to these existing reports and provides further reference for the customized selection of nanoparticle morphologies, which eventually promotes precision medicine. Second, we were trying to cover several major aspects of toxicological outcome, i.e., hepatotoxicity, nephrotoxicity, neurotoxicity, lipid metabolism malfunction, and microbial alteration. In order to achieve such broad coverage, the investigative depth within each specific toxicity may not be optimal. Note that our current study can serve as a preliminary screening to examine the toxicities to different organs. When a specific aspect is of interest, studies with a narrow but in-depth focus can be performed. For example, if the metabolic pathway alteration is focused, characterizations using other techniques, e.g., MRI-based metabolomics,50 can be applied to reveal the alterations in the metabolic pathways and cross-validate our current findings. Finally, end-point biochemical markers were measured in the current study. In vivo techniques, e.g., noninvasive functional MRI, can be performed to track toxicological outcome at the function levels, e.g., cerebral blood flow, brain metabolism, BBB permeability, longitudinally to cross-validate relevant markers.51 With the in vivo monitoring, dynamic temporal pattern and progressive development of toxicity, as well as schemes to reduce toxicity, can be tested.
5. Conclusions
We have compared the biological toxicity of AuNPs in spherical and triangular shapes and confirmed that the plastic particles will introduce additional modulations to the toxicological profile of the AuNPs. The spherical gold nanoparticles are associated with lower hepatotoxicity and lipid metabolism malfunction and therefore are preferred for designing therapies when the protections of liver function and lipid metabolism are of higher priority. By contrast, the triangular gold nanoparticles exhibit lower neurotoxicity and therefore are preferred when protection of neuronal function is prioritized. When renal function and balance of microbiota are the top concerns, the selection between spherical and triangular gold nanoparticles will depend on practical cases.
Acknowledgments
The authors acknowledge the support from Dr. Guoqing Wang, College of Food Science and Engineering, Ocean University of China.
Supporting Information Available
The Supporting Information is available free of charge at https://pubs.acs.org/doi/10.1021/acsomega.4c05961.
TEM images of AuS and AuT; SEM images of nPS and mPS effects of AuS and AuT on body weights; changes in the microbiota composition at the family level; gut microbial genes involved in diseases at the Level 2/Level 3 of KEGG pathway annotation, respectively; correlations between biomarkers and relative abundance of gut microbiota at the family level; effects of AuSnPS, AuTnPS, AuSmPS, and AuTmPS on body weights; principal coordinates analysis; effects of coexposures between AuNP and PS on relative abundances of microbial species at the family level; gut microbial genes involved in diseases at the Level 2/Level 3 of KEGG pathway annotation, respectively; correlations between biomarkers and relative abundance of gut microbiota at the family level; and correlations between different biochemical measurements (PDF)
Author Contributions
Conceptualization, methodology, software, validation, formal analysis, investigation, data curation, writing—original draft preparation, writing—review and editing, visualization, L.Z.; methodology, software, validation, formal analysis, investigation, data curation, writing—review and editing, Y.M.; formal analysis and writing—review and editing, Z.W.; methodology, validation, formal analysis, investigation, data curation, writing—review and editing, Q.L. All authors have read and agreed to the published version of the manuscript.
The authors declare no competing financial interest.
Supplementary Material
References
- a Nambara K.; Niikura K.; Mitomo H.; Ninomiya T.; Takeuchi C.; Wei J.; Matsuo Y.; Ijiro K. Reverse Size Dependences of the cellular uptake of triangular and spherical gold nanoparticles. Langmuir 2016, 32 (47), 12559–12567. 10.1021/acs.langmuir.6b02064. [DOI] [PubMed] [Google Scholar]; b Han G.; Ghosh P.; Rotello V. M. Functionalized gold nanoparticles for drug delivery. Nanomedicine 2007, 2 (1), 113–123. 10.2217/17435889.2.1.113. [DOI] [PubMed] [Google Scholar]; c Paciotti G. F.; Myer L.; Weinreich D.; Goia D.; Pavel N.; McLaughlin R. E.; Tamarkin L. Colloidal gold: a novel nanoparticle vector for tumor directed drug delivery. Drug Delivery 2004, 11 (3), 169–183. 10.1080/10717540490433895. [DOI] [PubMed] [Google Scholar]
- Jiang Y.; Horimoto N. N.; Imura K.; Okamoto H.; Matsui K.; Shigemoto R. Bioimaging with two-photon-induced luminescence from triangular nanoplates and nanoparticle aggregates of gold. Adv. Mater. 2009, 21, 2309–2313. 10.1002/adma.200802312. [DOI] [Google Scholar]
- a Yan L.; Mu J.; Ma P.; Li Q.; Yin P.; Liu X.; Cai Y.; Yu H.; Liu J.; Wang G.; et al. Gold nanoplates with superb photothermal efficiency and peroxidase-like activity for rapid and synergistic antibacterial therapy. Chem. Commun. 2021, 57 (9), 1133–1136. 10.1039/D0CC06925F. [DOI] [PubMed] [Google Scholar]; b Zharov V. P.; Mercer K. E.; Galitovskaya E. N.; Smeltzer M. S. Photothermal nanotherapeutics and nanodiagnostics for selective killing of bacteria targeted with gold nanoparticles. Biophys. J. 2006, 90 (2), 619–627. 10.1529/biophysj.105.061895. [DOI] [PMC free article] [PubMed] [Google Scholar]
- a Cardinal J.; Klune J. R.; Chory E.; Jeyabalan G.; Kanzius J. S.; Nalesnik M.; Geller D. A. Noninvasive radiofrequency ablation of cancer targeted by gold nanoparticles. Surgery 2008, 144 (2), 125–132. 10.1016/j.surg.2008.03.036. [DOI] [PMC free article] [PubMed] [Google Scholar]; b Gannon C. J.; Patra C. R.; Bhattacharya R.; Mukherjee P.; Curley S. A. Intracellular gold nanoparticles enhance non-invasive radiofrequency thermal destruction of human gastrointestinal cancer cells. J. Nanobiotechnol. 2008, 6, 2. 10.1186/1477-3155-6-2. [DOI] [PMC free article] [PubMed] [Google Scholar]
- a Haes A. J.; Chang L.; Klein W. L.; Van Duyne R. P. Detection of a biomarker for Alzheimer’s disease from synthetic and clinical samples using a nanoscale optical biosensor. J. Am. Chem. Soc. 2005, 127 (7), 2264–2271. 10.1021/ja044087q. [DOI] [PubMed] [Google Scholar]; b Chamberland D. L.; Agarwal A.; Kotov N.; Brian Fowlkes J.; Carson P. L.; Wang X. Photoacoustic tomography of joints aided by an Etanercept-conjugated gold nanoparticle contrast agent-an ex vivo preliminary rat study. Nanotechnology 2008, 19 (9), 095101. 10.1088/0957-4484/19/9/095101. [DOI] [PubMed] [Google Scholar]; c Bowman M. C.; Ballard T. E.; Ackerson C. J.; Feldheim D. L.; Margolis D. M.; Melander C. Inhibition of HIV fusion with multivalent gold nanoparticles. J. Am. Chem. Soc. 2008, 130 (22), 6896–6897. 10.1021/ja710321g. [DOI] [PMC free article] [PubMed] [Google Scholar]
- a Alkilany A. M.; Murphy C. J. Toxicity and cellular uptake of gold nanoparticles: what we have learned so far?. J. Nanopart. Res. 2010, 12 (7), 2313–2333. 10.1007/s11051-010-9911-8. [DOI] [PMC free article] [PubMed] [Google Scholar]; b Carnovale C.; Bryant G.; Shukla R.; Bansal V. Identifying trends in gold nanoparticle toxicity and uptake: size, Shape, capping ligand, and biological corona. ACS Omega 2019, 4, 242–256. 10.1021/acsomega.8b03227. [DOI] [Google Scholar]
- a Eriksen M.; Lebreton L. C.; Carson H. S.; Thiel M.; Moore C. J.; Borerro J. C.; Galgani F.; Ryan P. G.; Reisser J. Plastic pollution in the world’s oceans: more than 5 trillion plastic pieces weighing over 250,000 tons afloat at Sea. PLoS One 2014, 9 (12), e111913 10.1371/journal.pone.0111913. [DOI] [PMC free article] [PubMed] [Google Scholar]; b Jambeck J. R.; Geyer R.; Wilcox C.; Siegler T. R.; Perryman M.; Andrady A.; Narayan R.; Law K. L. Plastic waste inputs from land into the ocean. Science 2015, 347 (6223), 768–771. 10.1126/science.1260352. [DOI] [PubMed] [Google Scholar]; c Geyer R.; Jambeck J. R.; Law K. L. Production, use, and fate of all plastics ever made. Sci. Adv. 2017, 3 (7), e1700782 10.1126/sciadv.1700782. [DOI] [PMC free article] [PubMed] [Google Scholar]
- Lu L.; Wan Z.; Luo T.; Fu Z.; Jin Y. Polystyrene microplastics induce gut microbiota dysbiosis and hepatic lipid metabolism disorder in mice. Sci. Total Environ. 2018, 631–632, 449–458. 10.1016/j.scitotenv.2018.03.051. [DOI] [PubMed] [Google Scholar]
- a Zheng H.; Wang J.; Wei X.; Chang L.; Liu S. Proinflammatory properties and lipid disturbance of polystyrene microplastics in the livers of mice with acute colitis. Sci. Total Environ. 2021, 750, 143085. 10.1016/j.scitotenv.2020.143085. [DOI] [PubMed] [Google Scholar]; b Hamed M.; Soliman H. A. M.; Osman A. G. M.; Sayed A. E. D. H. Antioxidants and molecular damage in Nile Tilapia (Oreochromis niloticus) after exposure to microplastics. Environ. Sci. Pollut. Res. Int. 2020, 27 (13), 14581–14588. 10.1007/s11356-020-07898-y. [DOI] [PMC free article] [PubMed] [Google Scholar]
- a Shen M.; Zeng Z.; Song B.; Yi H.; Hu T.; Zhang Y.; Zeng G.; Xiao R. Neglected microplastics pollution in global COVID-19: disposable surgical masks. Sci. Total Environ. 2021, 790, 148130. 10.1016/j.scitotenv.2021.148130. [DOI] [PMC free article] [PubMed] [Google Scholar]; b Ray S. S.; Lee H. K.; Huyen D. T. T.; Chen S. S.; Kwon Y. N. Microplastics waste in environment: a perspective on recycling issues from PPE kits and face masks during the COVID-19 pandemic. Environ. Technol. Innov. 2022, 26, 102290. 10.1016/j.eti.2022.102290. [DOI] [PMC free article] [PubMed] [Google Scholar]
- a Banerjee A.; Shelver W. L. Micro- and nanoplastic induced cellular toxicity in mammals: a review. Sci. Total Environ. 2021, 755 (Pt 2), 142518. 10.1016/j.scitotenv.2020.142518. [DOI] [PubMed] [Google Scholar]; b Zarus G. M.; Muianga C.; Hunter C. M.; Pappas R. S. A review of data for quantifying human exposures to micro and nanoplastics and potential health risks. Sci. Total Environ. 2021, 756, 144010. 10.1016/j.scitotenv.2020.144010. [DOI] [PMC free article] [PubMed] [Google Scholar]; c Fendall L. S.; Sewell M. A. Contributing to marine pollution by washing your face: microplastics in facial cleansers. Mar. Pollut. Bull. 2009, 58 (8), 1225–1228. 10.1016/j.marpolbul.2009.04.025. [DOI] [PubMed] [Google Scholar]
- a Teng M.; Zhao X.; Wang C.; Wang C.; White J. C.; Zhao W.; Zhou L.; Duan M.; Wu F. Polystyrene nanoplastics toxicity to Zebrafish: dysregulation of the brain-intestine-microbiota axis. ACS Nano 2022, 16, 8190–8204. 10.1021/acsnano.2c01872. [DOI] [PubMed] [Google Scholar]; b Avio C. G.; Gorbi S.; Milan M.; Benedetti M.; Fattorini D.; d’Errico G.; Pauletto M.; Bargelloni L.; Regoli F. Pollutants bioavailability and toxicological risk from microplastics to marine mussels. Environ. Pollut. 2015, 198, 211–222. 10.1016/j.envpol.2014.12.021. [DOI] [PubMed] [Google Scholar]; c Jin Y.; Xia J.; Pan Z.; Yang J.; Wang W.; Fu Z. Polystyrene microplastics induce microbiota dysbiosis and inflammation in the gut of adult zebrafish. Environ. Pollut. 2018, 235, 322–329. 10.1016/j.envpol.2017.12.088. [DOI] [PubMed] [Google Scholar]
- Li B.; Ding Y.; Cheng X.; Sheng D.; Xu Z.; Rong Q.; Wu Y.; Zhao H.; Ji X.; Zhang Y. Polyethylene microplastics affect the distribution of gut microbiota and inflammation development in mice. Chemosphere 2020, 244, 125492. 10.1016/j.chemosphere.2019.125492. [DOI] [PubMed] [Google Scholar]
- a Wang G.; Zhang L.; Li Q.; Gao C.. Colloidal Au nanoplates: Synthesis, properties, and applications; Yin Y., Lu Y., Xia Y., Eds.; Elsevier, 2023; Vol. 1, pp 113–137. 10.1016/b978-0-12-822425-0.00057-9Colloidal Au nanoplates: Synthesis, properties, and applications [DOI] [Google Scholar]; b Jain P. K.; Lee K. S.; El-Sayed I. H.; El-Sayed M. A. Calculated absorption and scattering properties of gold nanoparticles of different size, shape, and composition: applications in biological imaging and biomedicine. J. Phys. Chem. B 2006, 110 (14), 7238–7248. 10.1021/jp057170o. [DOI] [PubMed] [Google Scholar]
- Lee W. S.; Cho H.-J.; Kim E.; Huh Y. H.; Kim H.-J.; Kim B.; Kang T.; Lee J.-S.; Jeong J. Bioaccumulation of polystyrene nanoplastics and their effect on the toxicity of Au ions in zebrafish embryos. Nanoscale 2019, 11 (7), 3173–3185. 10.1039/C8NR09321K. [DOI] [PubMed] [Google Scholar]
- Frens G. Controlled nucleation for the regulation of the particle size in monodisperse gold suspensions. Nat. Phys. Sci. 1973, 241 (105), 20–22. 10.1038/physci241020a0. [DOI] [Google Scholar]
- Chen L.; Ji F.; Xu Y.; He L.; Mi Y.; Bao F.; Sun B.; Zhang X.; Zhang Q. High-yield seedless synthesis of triangular gold nanoplates through oxidative etching. Nano Lett. 2014, 14 (12), 7201–7206. 10.1021/nl504126u. [DOI] [PubMed] [Google Scholar]
- Zhao C.; Wang G.; Takarada T.; Liang X.; Komiyama M.; Maeda M. Shape-selective isolation of Au nanoplates from complex colloidal media by depletion flocculation. Colloids Surf., A 2019, 568, 216–223. 10.1016/j.colsurfa.2019.02.019. [DOI] [Google Scholar]
- a Li J.; Cha R.; Zhao X.; Guo H.; Luo H.; Wang M.; Zhou F.; Jiang X. Gold nanoparticles cure bacterial infection with benefit to intestinal microflora. ACS Nano 2019, 13 (5), 5002–5014. 10.1021/acsnano.9b01002. [DOI] [PubMed] [Google Scholar]; b Besseling E.; Wang B.; Lürling M.; Koelmans A. A. Nanoplastic affects growth of S. obliquus and reproduction of D. magna. Environ. Sci. Technol. 2014, 48 (20), 12336–12343. 10.1021/es503001d. [DOI] [PMC free article] [PubMed] [Google Scholar]; c Ma Y.; Huang A.; Cao S.; Sun F.; Wang L.; Guo H.; Ji R. Effects of nanoplastics and microplastics on toxicity, bioaccumulation, and environmental fate of phenanthrene in fresh water. Environ. Pollut. 2016, 219, 166–173. 10.1016/j.envpol.2016.10.061. [DOI] [PubMed] [Google Scholar]
- Fu J.; Zhang L.; Xiang K.; Zhang Y.; Wang G.; Chen L. Microplastic-contaminated antibiotics as an emerging threat to mammalian liver: enhanced oxidative and inflammatory damages. Biomater. Sci. 2023, 11 (12), 4298–4307. 10.1039/D2BM02116A. [DOI] [PubMed] [Google Scholar]
- Li S.; Shi M.; Wang Y.; Xiao Y.; Cai D.; Xiao F. Keap1-Nrf2 pathway up-regulation via hydrogen sulfide mitigates polystyrene microplastics induced-hepatotoxic effects. J. Hazard. Mater. 2021, 402, 123933. 10.1016/j.jhazmat.2020.123933. [DOI] [PubMed] [Google Scholar]
- Deng Y.; Zhang Y.; Qiao R.; Bonilla M. M.; Yang X.; Ren H.; Lemos B. Evidence that microplastics aggravate the toxicity of organophosphorus flame retardants in mice (Mus musculus). J. Hazard. Mater. 2018, 357, 348–354. 10.1016/j.jhazmat.2018.06.017. [DOI] [PubMed] [Google Scholar]
- Zheng H.; Wang J.; Wei X.; Chang L.; Liu S. Proinflammatory properties and lipid disturbance of polystyrene microplastics in the livers of mice with acute colitis. Sci. Total Environ. 2021, 750, 143085. 10.1016/j.scitotenv.2020.143085. [DOI] [PubMed] [Google Scholar]
- Wang J.; Zhou G.; Chen C.; Yu H.; Wang T.; Ma Y.; Jia G.; Gao Y.; Li B.; Sun J.; et al. Acute toxicity and biodistribution of different sized titanium dioxide particles in mice after oral administration. Toxicol. Lett. 2007, 168 (2), 176–185. 10.1016/j.toxlet.2006.12.001. [DOI] [PubMed] [Google Scholar]
- Ribeiro F.; Garcia A. R.; Pereira B. P.; Fonseca M.; Mestre N. C.; Fonseca T. G.; Ilharco L. M.; Bebianno M. J. Microplastics effects in Scrobicularia plana. Mar. Pollut. Bull. 2017, 122 (1–2), 379–391. 10.1016/j.marpolbul.2017.06.078. [DOI] [PubMed] [Google Scholar]
- Jin Y.; Lu L.; Tu W.; Luo T.; Fu Z. Impacts of polystyrene microplastic on the gut barrier, microbiota and metabolism of mice. Sci. Total Environ. 2019, 649, 308–317. 10.1016/j.scitotenv.2018.08.353. [DOI] [PubMed] [Google Scholar]
- Lu L.; Wan Z.; Luo T.; Fu Z.; Jin Y. Polystyrene microplastics induce gut microbiota dysbiosis and hepatic lipid metabolism disorder in mice. Sci. Total Environ. 2018, 631–632, 449–458. 10.1016/j.scitotenv.2018.03.051. [DOI] [PubMed] [Google Scholar]
- Edgar R. C. UPARSE: highly accurate OTU sequences from microbial amplicon reads. Nat. Methods 2013, 10 (10), 996–998. 10.1038/nmeth.2604. [DOI] [PubMed] [Google Scholar]
- Stackebrandt E.; Goebel B. M. Taxonomic note: A place for DNA-DNA reassociation and 16S rRNA sequence analysis in the present species definition in bacteriology. Int. J. Syst. Evol. Microbiol. 1994, 44 (4), 846–849. 10.1099/00207713-44-4-846. [DOI] [Google Scholar]
- Douglas G. M.; Maffei V. J.; Zaneveld J. R.; Yurgel S. N.; Brown J. R.; Taylor C. M.; Huttenhower C.; Langille M. G. I. PICRUSt2 for prediction of metagenome functions. Nat. Biotechnol. 2020, 38 (6), 685–688. 10.1038/s41587-020-0548-6. [DOI] [PMC free article] [PubMed] [Google Scholar]
- Schloss P. D.; Westcott S. L.; Ryabin T.; Hall J. R.; Hartmann M.; Hollister E. B.; Lesniewski R. A.; Oakley B. B.; Parks D. H.; Robinson C. J.; et al. Introducing mothur: open-source, platform-independent, community-supported software for describing and comparing microbial communities. Appl. Environ. Microbiol. 2009, 75 (23), 7537–7541. 10.1128/AEM.01541-09. [DOI] [PMC free article] [PubMed] [Google Scholar]
- He Z.; Zhang L.; Peng G.; Wang G.; Liang X. Chemical redox-modulated etching of plasmonic nanoparticles for nitrite detection: comparison among gold nanosphere, nanorod, and nanotriangle. J. Anal. Test. 2021, 5 (4), 350–359. 10.1007/s41664-021-00153-4. [DOI] [Google Scholar]
- Jaiswal A. K. Nrf2 signaling in coordinated activation of antioxidant gene expression. Free Radic. Biol. Med. 2004, 36 (10), 1199–1207. 10.1016/j.freeradbiomed.2004.02.074. [DOI] [PubMed] [Google Scholar]
- a Pan Y.; Leifert A.; Ruau D.; Neuss S.; Bornemann J.; Schmid G.; Brandau W.; Simon U.; Jahnen-Dechent W. Gold nanoparticles of diameter 1.4 nm trigger necrosis by oxidative stress and mitochondrial damage. Small 2009, 5 (18), 2067–2076. 10.1002/smll.200900466. [DOI] [PubMed] [Google Scholar]; b Sonavane G.; Tomoda K.; Sano A.; Ohshima H.; Terada H.; Makino K. In vitro permeation of gold nanoparticles through rat skin and rat intestine: effect of particle size. Colloids Surf., B 2008, 65 (1), 1–10. 10.1016/j.colsurfb.2008.02.013. [DOI] [PubMed] [Google Scholar]
- a Soenen S. J.; Rivera-Gil P.; Montenegro J.-M.; Parak W. J.; De Smedt S. C.; Braeckmans K. Cellular toxicity of inorganic nanoparticles: Common aspects and guidelines for improved nanotoxicity evaluation. Nano Today 2011, 6 (5), 446–465. 10.1016/j.nantod.2011.08.001. [DOI] [Google Scholar]; b Caballero-Díaz E.; Valcárcel M.. Chapter 5-Toxicity of gold nanoparticles. In Comprehensive Analytical Chemistry; Valcárcel M., López-Lorente Á. I., Eds.; Elsevier, 2014; Vol. 66, pp 207–254. [Google Scholar]
- Wang J.; Zhou G.; Chen C.; Yu H.; Wang T.; Ma Y.; Jia G.; Gao Y.; Li B.; Sun J.; et al. Acute toxicity and biodistribution of different sized titanium dioxide particles in mice after oral administration. Toxicol. Lett. 2007, 168 (2), 176–185. 10.1016/j.toxlet.2006.12.001. [DOI] [PubMed] [Google Scholar]
- a Gentile F.; Chiappini C.; Fine D.; Bhavane R. C.; Peluccio M. S.; Cheng M. M.; Liu X.; Ferrari M.; Decuzzi P. The effect of shape on the margination dynamics of non-neutrally buoyant particles in two-dimensional shear flows. J. Biomech. 2008, 41 (10), 2312–2318. 10.1016/j.jbiomech.2008.03.021. [DOI] [PubMed] [Google Scholar]; b Champion J. A.; Mitragotri S. Role of target geometry in phagocytosis. Proc. Natl. Acad. Sci. U.S.A. 2006, 103 (13), 4930–4934. 10.1073/pnas.0600997103. [DOI] [PMC free article] [PubMed] [Google Scholar]
- Wang Y.; Ding L.; Yao C.; Li C.; Xing X.; Huang Y.; Gu T.; Wu M. Toxic effects of metal oxide nanoparticles and their underlying mechanisms. Sci. China Mater. 2017, 60 (2), 93–108. 10.1007/s40843-016-5157-0. [DOI] [Google Scholar]
- Terentyuk G. S.; Maslyakova G. N.; Suleymanova L. V.; Khlebtsov B. N.; Kogan B. Y.; Akchurin G. G.; Shantrocha A. V.; Maksimova I. L.; Khlebtsov N. G.; Tuchin V. V. Circulation and distribution of gold nanoparticles and induced alterations of tissue morphology at intravenous particle delivery. J. Biophotonics 2009, 2 (5), 292–302. 10.1002/jbio.200910005. [DOI] [PubMed] [Google Scholar]
- a Medina C.; Santos-Martinez M. J.; Radomski A.; Corrigan O. I.; Radomski M. W. Nanoparticles: pharmacological and toxicological significance. Br. J. Pharmacol. 2007, 150 (5), 552–558. 10.1038/sj.bjp.0707130. [DOI] [PMC free article] [PubMed] [Google Scholar]; b Oberdörster G.; Oberdörster E.; Oberdörster J. Nanotoxicology: an emerging discipline evolving from studies of ultrafine particles. Environ. Health Perspect. 2005, 113 (7), 823–839. 10.1289/ehp.7339. [DOI] [PMC free article] [PubMed] [Google Scholar]; c Stern S. T.; McNeil S. E. Nanotechnology safety concerns revisited. Toxicol. Sci. 2008, 101 (1), 4–21. 10.1093/toxsci/kfm169. [DOI] [PubMed] [Google Scholar]
- Deng Y.; Zhang Y.; Lemos B.; Ren H. Tissue accumulation of microplastics in mice and biomarker responses suggest widespread health risks of exposure. Sci. Rep. 2017, 7, 46687. 10.1038/srep46687. [DOI] [PMC free article] [PubMed] [Google Scholar]
- Nicholson J. K.; Holmes E.; Kinross J.; Burcelin R.; Gibson G.; Jia W.; Pettersson S. Host-gut microbiota metabolic interactions. Science 2012, 336 (6086), 1262–1267. 10.1126/science.1223813. [DOI] [PubMed] [Google Scholar]
- Lagkouvardos I.; Lesker T. R.; Hitch T. C. A.; Gálvez E. J. C.; Smit N.; Neuhaus K.; Wang J.; Baines J. F.; Abt B.; Stecher B.; et al. Sequence and cultivation study of Muribaculaceae reveals novel species, host preference, and functional potential of this yet undescribed family. Microbiome 2019, 7, 28. 10.1186/s40168-019-0637-2. [DOI] [PMC free article] [PubMed] [Google Scholar]
- Dinh D. M.; Volpe G. E.; Duffalo C.; Bhalchandra S.; Tai A. K.; Kane A. V.; Wanke C. A.; Ward H. D. Intestinal microbiota, microbial translocation, and systemic inflammation in chronic HIV infection. J. Infect. Dis. 2015, 211 (1), 19–27. 10.1093/infdis/jiu409. [DOI] [PMC free article] [PubMed] [Google Scholar]
- Kang C. S.; Ban M.; Choi E. J.; Moon H. G.; Jeon J. S.; Kim D. K.; Park S. K.; Jeon S. G.; Roh T. Y.; Myung S. J.; et al. Extracellular vesicles derived from gut microbiota, especially Akkermansia muciniphila, protect the progression of dextran sulfate sodium-induced colitis. PLoS One 2013, 8 (10), e76520 10.1371/journal.pone.0076520. [DOI] [PMC free article] [PubMed] [Google Scholar]
- Galdeano C. M.; Perdigón G. The probiotic bacterium Lactobacillus casei induces activation of the gut mucosal immune system through innate immunity. Clin. Vaccine Immunol. 2006, 13 (2), 219–226. 10.1128/CVI.13.2.219-226.2006. [DOI] [PMC free article] [PubMed] [Google Scholar]
- Ley R. E.; Bäckhed F.; Turnbaugh P.; Lozupone C. A.; Knight R. D.; Gordon J. I. Obesity alters gut microbial ecology. Proc. Natl. Acad. Sci. U.S.A. 2005, 102 (31), 11070–11075. 10.1073/pnas.0504978102. [DOI] [PMC free article] [PubMed] [Google Scholar]
- a Fujio-Vejar S.; Vasquez Y.; Morales P.; Magne F.; Vera-Wolf P.; Ugalde J. A.; Navarrete P.; Gotteland M. The Gut microbiota of healthy chilean subjects reveals a high abundance of the Phylum Verrucomicrobia. Front. Microbiol. 2017, 8, 1221. 10.3389/fmicb.2017.01221. [DOI] [PMC free article] [PubMed] [Google Scholar]; b Hou Y. P.; He Q. Q.; Ouyang H. M.; Peng H. S.; Wang Q.; Li J.; Lv X. F.; Zheng Y. N.; Li S. C.; Liu H. L.; et al. Human gut microbiota associated with obesity in Chinese children and adolescents. Biomed. Res. Int. 2017, 2017, 1–8. 10.1155/2017/7585989. [DOI] [PMC free article] [PubMed] [Google Scholar]
- a Adewale O. B.; Davids H.; Cairncross L.; Roux S. Toxicological behavior of gold nanoparticles on various models: influence of physicochemical properties and other factors. Int. J. Toxicol. 2019, 38 (5), 357–384. 10.1177/1091581819863130. [DOI] [PubMed] [Google Scholar]; b Ullah M.; Wahab A.; Khan D.; Saeed S.; Khan S. U.; Ullah N.; Saleh T. A. Modified gold and polymeric gold nanostructures: Toxicology and biomedical applications. Colloid Interface Sci. Commun. 2021, 42, 100412. 10.1016/j.colcom.2021.100412. [DOI] [Google Scholar]; c Freese C.; Uboldi C.; Gibson M. I.; Unger R. E.; Weksler B. B.; Romero I. A.; Couraud P.-O.; Kirkpatrick C. J. Uptake and cytotoxicity of citrate-coated gold nanospheres: Comparative studies on human endothelial and epithelial cells. Part. Fibre Toxicol. 2012, 9 (1), 23. 10.1186/1743-8977-9-23. [DOI] [PMC free article] [PubMed] [Google Scholar]; d Liebig F.; Moreno S.; Thünemann A. F.; Temme A.; Appelhans D.; Koetz J. Toxicological investigations of “naked” and polymer-entrapped AOT-based gold nanotriangles. Colloids Surf., B 2018, 167, 560–567. 10.1016/j.colsurfb.2018.04.059. [DOI] [PubMed] [Google Scholar]
- a Lin C.; Chen Z.; Zhang L.; Wei Z.; Cheng K. K.; Liu Y.; Shen G.; Fan H.; Dong J. Deciphering the metabolic perturbation in hepatic alveolar echinococcosis: a (1)H NMR-based metabolomics study. Parasites Vectors 2019, 12 (1), 300. 10.1186/s13071-019-3554-0. [DOI] [PMC free article] [PubMed] [Google Scholar]; b Lin C.; Wei Z.; Cheng K.-K.; Xu J.; Shen G.; She C.; Zhong H.; Chang X.; Dong J. 1H NMR-based investigation of metabolic response to electro-acupuncture stimulation. Sci. Rep. 2017, 7 (1), 6820. 10.1038/s41598-017-07306-5. [DOI] [PMC free article] [PubMed] [Google Scholar]
- a Wei Z.; Xu J.; Chen L.; Hirschler L.; Barbier E. L.; Li T.; Wong P. C.; Lu H. Brain metabolism in tau and amyloid mouse models of Alzheimer’s disease: An MRI study. NMR Biomed. 2021, 34 (9), e4568 10.1002/nbm.4568. [DOI] [PMC free article] [PubMed] [Google Scholar]; b Jiang D.; Lu H.; Parkinson C.; Su P.; Wei Z.; Pan L.; Tekes A.; Huisman T. A. G. M.; Golden W. C.; Liu P. Vessel-specific quantification of neonatal cerebral venous oxygenation. Magn. Reson. Med. 2019, 82 (3), 1129–1139. 10.1002/mrm.27788. [DOI] [PMC free article] [PubMed] [Google Scholar]; c Liu G.; Wang J.; Wei Z.; Fang C. L.; Shen K.; Qian C.; Qi C.; Li T.; Gao P.; Wong P. C.; et al. Elevated PDGF-BB from bone impairs hippocampal vasculature by inducing PDGFRβ shedding from pericytes. Adv. Sci. 2023, 10 (20), e2206938 10.1002/advs.202206938. [DOI] [PMC free article] [PubMed] [Google Scholar]
Associated Data
This section collects any data citations, data availability statements, or supplementary materials included in this article.