Abstract
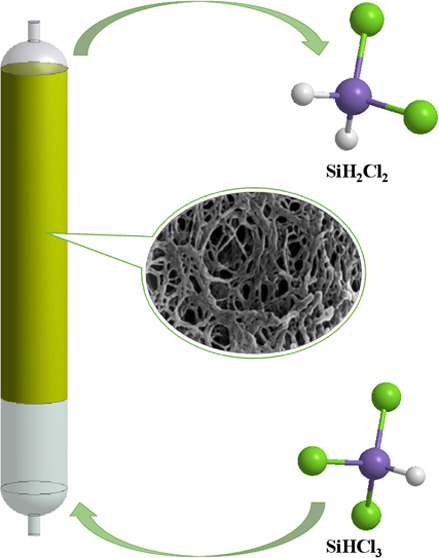
High-purity dichlorosilane (DCS) is an important raw material for thin film deposition in the semiconductor industry, such as epitaxial silicon, which is mainly produced by trichlorosilane (TCS) catalytic decomposition in a fixed-bed reactor. The productivity of DCS is strongly dependent on the controlling of the TCS decomposition reaction process, associated with the cost in practical application. In this study, we have performed computational fluid dynamics (CFD) simulation on the TCS decomposition reaction kinetics in a cylindrical fixed-bed reactor, in which the effects of catalyst bed height, feed temperature, and feed flow rate are stressed to predict the conversion rate of TCS and the generation rate of DCS. This indicates that the increase of bed height helps the reaction to proceed adequately, but too large a bed height does not improve the DCS generation rate. Meanwhile, the feed temperature and reactor temperature have important effects on the DCS generation rate. However, it is found that changing the feed flow rate and L/D ratio cannot effectively improve the DCS generation rate while the bed volume remains constant. Furthermore, we have designed a fixed-bed reactor to verify the simulation results, which are in good agreement with each other. These results are of significance for the practical industrial production of high-purity DCS in a fixed-bed reactor.
1. Introduction
High-purity dichlorosilane (DCS) is mainly used in the production processes of semiconductor chips, including silicon epitaxial growth1−3 and thin film deposition of silicon oxide,4 silicon nitride,5,6 silicon oxynitride,7 metal silicide,8,9 and so on. It is an indispensable material in the manufacturing process of microelectronics, optoelectronic components, and integrated circuits. Currently, there are two main methods of producing high-purity DCS. One is to recycle and purify the waste gas from the Siemens polysilicon production process as the raw material to produce DCS products.10 However, due to the complex composition and various impurities in the exhaust gas, which is a product of high-temperature reactions at temperatures above 1000 °C, more complicated purification technology is required, resulting in increased distillation difficulties and high investment costs. The other is to use high-purity trichlorosilane (TCS) as a feedstock to perform a catalytic redistribution reaction.11 During the reaction process, the DCS is formed as an intermediate product with high purity, which is currently the most commonly used method. The fixed-bed reactor is commonly used in this reaction due to its advantages, such as simple structure and low cost. However, the operation of fixed-bed reactors is often affected by a variety of factors, such as temperature, pressure, flow rate, and catalyst bed thickness, and the disproportionation process of TCS produces a variety of intermediate products,11 which results in affecting the output efficiency of DCS. Therefore, it is necessary to study the product distribution and output efficiency of DCS in fixed-bed reactors in order to optimize the reactor design. Although studies on TCS in the presence of catalysts have been reported,11 there are few studies on the design of reactors for the production of DCS.
Computational fluid dynamics (CFD) simulation is a numerical method that can simulate fluid flow and fluid–solid interaction in a reactor or other industrial equipment.12,13 By using CFD simulation, we can study the distribution of TCS in a fixed-bed reactor under different operating conditions and optimize the reactor design. In this study, we designed a fixed-bed reactor and used CFD software to simulate the disproportionation reaction process of liquid TCS in the reactor to achieve the efficiency of DCS production. Based on the hydrodynamic and chemical reaction kinetic models, we investigated the effects of bed thicknesses, temperatures, and flow rates on the distribution of the components of TCS in the reactor. The calculated results were compared with the experimental data, which can be used well for predictive analysis of DCS production in fixed-bed reactors.
2. Simulation and Experimentation
2.1. Chemical Kinetic Model
Huang et al.14 studied the catalytic reaction of trichlorohydrosilane to produce silanes in a reactive distillation column and showed that the disproportionation reaction of TCS can be divided into three steps
| 1 |
| 2 |
| 3 |
The rate equations for each step can be described as follows
| 4 |
| 5 |
| 6 |
where x0, x1, x2, x3, and x4 are the mole fraction of STC, TCS,DCS, MCS, and silane in liquid, respectively; R1, R2, and R3 are the reaction rates of TCS, DCS, and MCS disproportionation, respectively. k and K are the rate constant of forward reaction and chemical equilibrium constant, which are expressed in the following formulas
| 7 |
| 8 |
In these formulas, k0 and K0 are pre-exponential factors, respectively, E is the activation energy of the forward reaction, and ΔH is the heat of the reaction. For cases where reactants are in the liquid phase and catalyzed by resin Amberlyst A-21, their values are regressed from the experimental data,14 and the results are summarized in Table 1.
Table 1. Kinetic Parameters of Trichlorosilane Disproportionation in the Liquid Phase.
| reaction | k0 (s–1) | E (J/mol) | K0 | ΔH (J/mol) |
|---|---|---|---|---|
| R1 | 73.5 | 30,045 | 0.1856 | 6402 |
| R2 | 949466.4 | 51,083 | 0.7669 | 2226 |
| R3 | 1176.9 | 26,320 | 0.6890 | –2548 |
2.2. Calculation Conditions
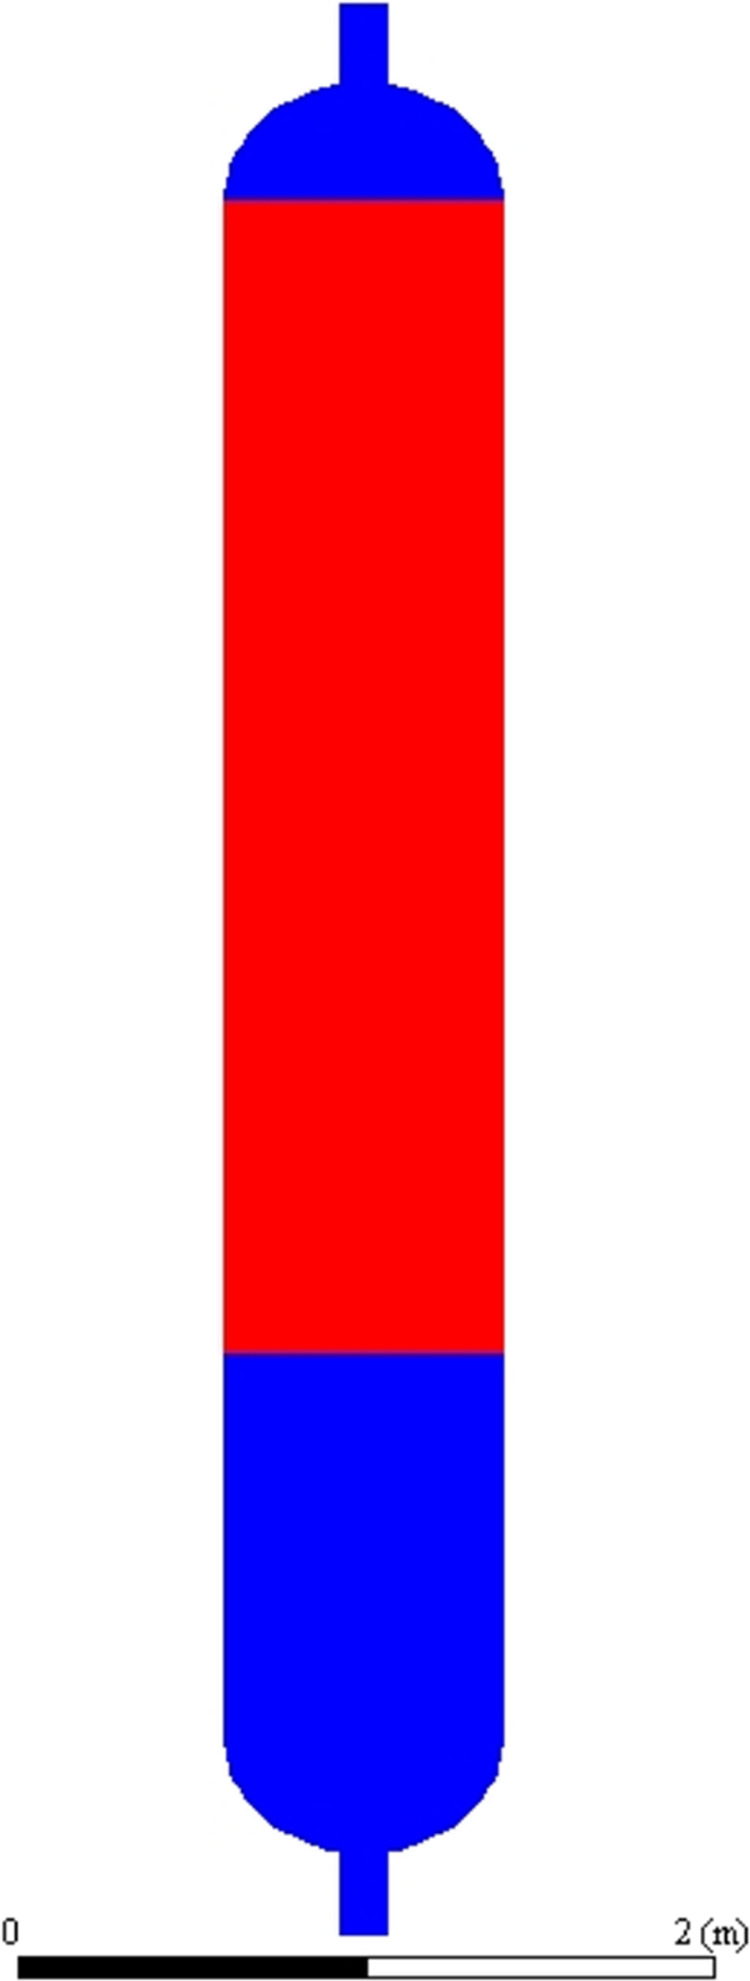
Fixed-bed reactors are commonly used for this reaction due to their simple structure, facilitating the easy loading and unloading of resin catalysts. The reactor used in the study is a vertical cylindrical structure with an inner diameter of 800 mm; the lower part of the linear section is not filled with catalyst and has a length of 1000 mm, while the upper part of the linear section is filled with catalyst and has a length of 1500 mm. The reactor has a circular head structure at both ends, with an inlet at the lower end and an outlet at the upper end. The reactor has a circular head structure at both ends, with an inlet at the lower end and an outlet at the upper end. Liquid TCS enters the reactor from the inlet at the lower end, and the reaction products are discharged from the upper end of the reactor. A schematic diagram of the reactor is shown in Figure 1. The red color in Figure 1 represents the filled area of the resin catalyst, and the blue color represents the free-flowing area of the liquid material. During the reaction process, the material component at the inlet is pure TCS liquid, and the material component at the outlet is the reaction products, i.e., TCS, DCS, MCS, STC, and silane.
Figure 1.
Schematic diagram of the fixed-bed redistribution reactor.
The calculations were performed using Ansys Fluent, a commercially available CFD software tool for modeling, meshing, and simulation. To save computation time, a two-dimensional axisymmetric model was used, based on the structural symmetry of the reactor. After grid independence analysis, the number of grids meets the calculation requirements, with approximately 15,000 structured meshes used in the computational model (Figure 2).
Figure 2.

Computational mesh of the reactor.
As the disproportionation reaction process of TCS is continuous, a steady-state algorithm is used. The liquid flow region is calculated using a commonly used turbulence model, i.e., the standard k-ω model. Since different components such as TCS, STC, DCS, MCS, and silane can flow and react continuously in the reactor, the transport of each component and the corresponding reaction process need to be calculated. In the calculation process, the physical parameters such as thermal conductivity, Cp, and viscosity coefficient of the liquid material are the mass average values of the components. In the component transport equation, the mass diffusion coefficients Di of the components satisfy the Chapman–Enskog equation, where (ϵ/kB) and σi take the values shown in Table 2. The resin is considered as a porous solid structure, and the functional groups with catalytic activity, i.e., catalysts, are uniformly distributed on the resin and occupy part of the resin surface. The three-step disproportionation reaction process of trichlorosilane takes place only at the catalyst surface. The catalyst-filled bed region is set up as a porous region in the calculation process, and the porous model is used for the calculation. A source term is introduced into the momentum and energy equations of the porous model in which the viscous resistance is set to 3.86 × 10⁷ m–2. Considering that the flow velocity of the liquid material in the reactor is less than 0.01 m/s, the value of the inertial resistance coefficient is set to 0 m–1, and the effects of the porous medium on the flow velocity and pressure drop are neglectable.
Table 2. Values of (ϵ/kB) and σi for Each Component.
| component | TCS | DCS | STC | MCS | SiH4 |
|---|---|---|---|---|---|
| σi | 5.64 | 5.031 | 5.977 | 4 | 4.084 |
| (ϵ/kB) | 436.4 | 298.8 | 390.2 | 100 | 207.6 |
The governing equations are as follows
Continuity equation
| 9 |
momentum equation
| 10 |
source term of the porous momentum equation
| 11 |
energy equation
| 12 |
species equation
| 13 |
| 14 |
| 15 |
standard k–ω model
| 16 |
| 17 |
The inlet in the model is set as a mass flow inlet, and the flow rate of the reactants is constant throughout the reaction. Throughout the calculation, the components involved in the reaction, such as DCS, MCS, silane, etc., are assumed to be in the liquid phase and do not undergo a phase transition. According to the chemical reaction model used in the calculation, the effect of reactor pressure changes on the reaction rate is not considered. For the calculations, the reactor was constructed in an insulated structure, with no heat exchange with the external environment.
In order to quantitatively study the effect of experimental conditions such as bed thickness and flow rate on the conversion of trichlorohydrosilane (TCS) and the yield of DCS, the molar ratios of the components at the reactor outlet were simulated, and then the conversion of TCS and the yield of DCS were calculated using the following equations
| 18 |
| 19 |
where n represents the molar ratio of the corresponding component.
2.3. Experiment
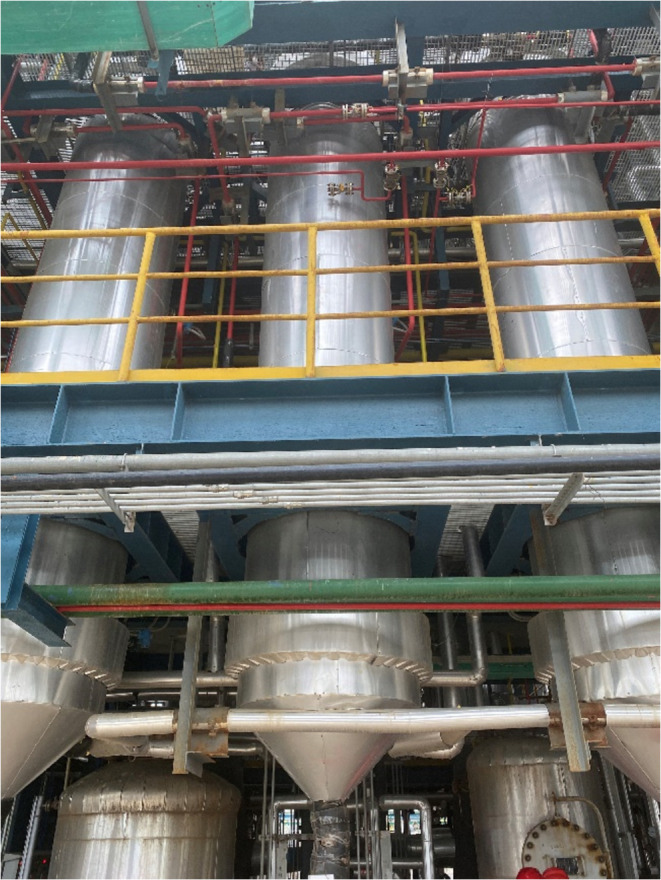
Based on the simulation results, a fixed-bed reactor with an internal diameter of 800 mm and a straight section length of 4000 mm was designed, as shown in Figure 3, and filled with a weakly basic anion exchange resin catalyst. The catalyst used was Amberlyst A-21 resin, with a specific surface area of 35 m2/g and a density of 330 kg/m3. Material sampling and compositional analysis were carried out at the reactor outlet, and the content of each component was measured using a gas chromatograph–mass spectrometer (7890B-5977B) from Agilent Technologies.
Figure 3.
Fixed-bed reactor.
3. Results and Discussion
3.1. Catalyst Bed Thickness
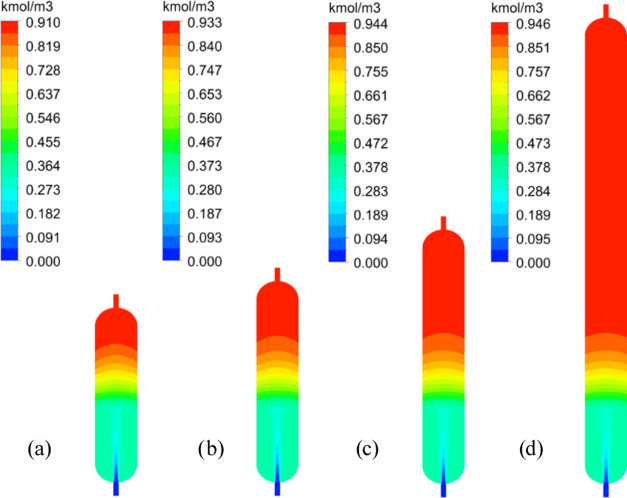
The effect of bed thicknesses on the conversion of TCS to DCS was investigated, starting from 1500 mm and increasing by 500 mm up to 7000 mm; the inlet flow rate was 1000 kg/h, and the feed temperature ranged from 20 to 70 °C. The distribution of DCS concentration at different bed heights in the reactor at a feed temperature of 60 °C is shown in Figure 4.
Figure 4.
DCS concentration distribution in the reactor at different bed heights at a feed temperature of 60 °C (the height is (a) 1500 mm, (b) 2000 mm, (c) 3000 mm, (d) 7000 mm, respectively).
As shown in Figure 4, the DCS concentration at the reactor inlet is 0 kmol/m3. After passing through the catalyst layer, the DCS concentration gradually increases and reaches its peak at the outlet. As the height of the catalyst layer increases, the DCS concentration at the outlet continues to increase and reaches a value of 0.944 kmol/m3 at a bed thickness of 3000 mm. However, when the catalyst layer is further increased to 7000 mm, the DCS concentration at the outlet remains essentially unchanged.
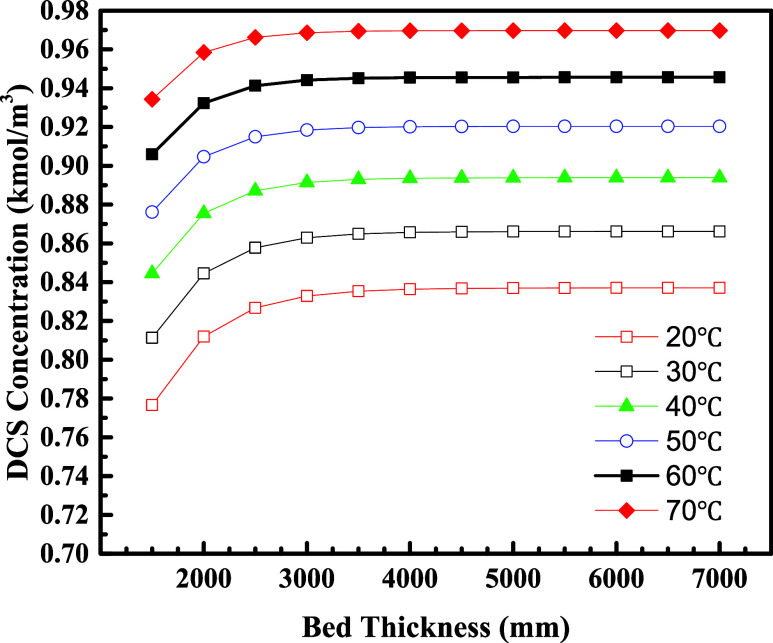
Figure 5 shows the results of the DCS concentration at the reactor outlet for different bed heights under different feed temperature conditions. It can be seen that the catalyst bed height has the same trend in influencing the DCS concentration at the outlet at various feed temperatures. As the bed height increased from 1500 to 3000 mm, the concentration of DCS substance at the outlet increases continuously and reaches a maximum value at 3000 mm. As the bed height continues to increase from 3000 mm, the DCS concentration at the outlet remains almost constant. Therefore, at a catalyst layer height of 3000–4000 mm, the disproportionation of TCS to DCS can be fully carried out and saturated, and there is no need to further increase the bed thickness.
Figure 5.
DCS concentrations as a function of bed thickness.
3.2. Feed Temperature
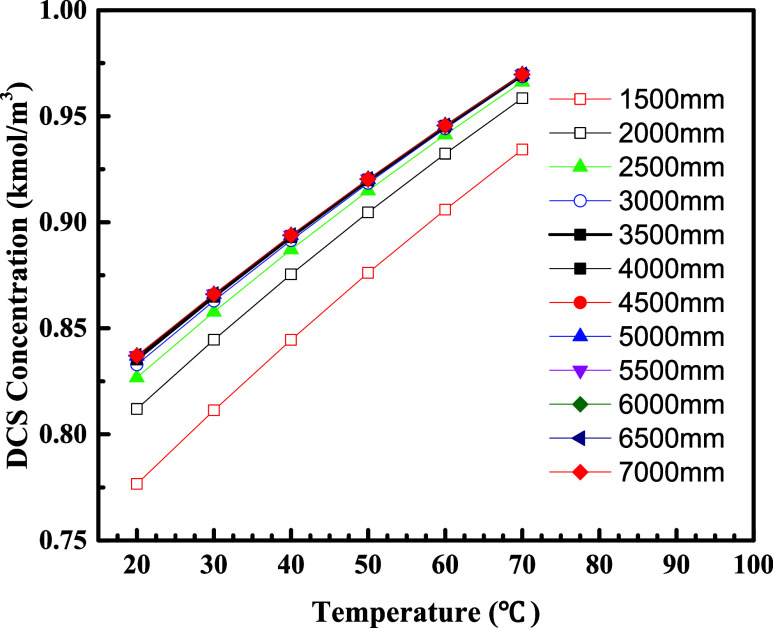
The effect of different feed temperatures on the conversion of TCS to DCS was further investigated. The catalyst bed height was 1500–7000 mm, the feed rate was 1000 kg/h, and the feed temperatures were 20–70 °C. The results of the DCS concentration at the reactor outlet are shown in Figure 6.
Figure 6.
DCS concentration at the reactor outlet as a function of bed height for different feed temperatures.
As shown in Figure 6, at 1500 mm bed height, the DCS concentration at the outlet increases with the increase in feed temperature, and the DCS concentration at the outlet is linearly related to the feed temperature. The same trend exists at other bed heights. At constant bed height, DCS concentration can increase by 2.55–4.47% for every 10 °C increase in feed temperature. Therefore, it can be seen that the feed temperature has an important effect on DCS generation. In order to increase the DCS generation rate, the feed temperature should be increased as much as possible.
However, in practice, the increase in temperature results in the evaporation of liquid materials such as DCS, MCS, and SiH4 in the reactor. In order to ensure that the materials do not undergo the phase change process of vaporization, it is necessary to increase the internal pressure of the reactor, which will increase the reactor cost and the operation danger. In addition, the carrier resin of the catalyst is susceptible to deterioration and failure at high temperatures, which must be avoided. Therefore, the feed temperature needs to be considered in terms of operating pressure and resin life to increase the feed temperature as much as possible to ensure that the DCS output efficiency is maximized. In this paper, based on the operating conditions, it is concluded that 60 °C can satisfy both the requirement of maximizing the reaction efficiency and the long-term stable operation of the resin catalyst.
3.3. Reactor Temperature
The disproportionation of TCS to produce DCS is a three-step reaction, and the reaction is heat-absorbing. During the reaction process, the continuous heat absorption of the material in the reactor will cause the temperature of the material to decrease continuously, which will result in the reaction of disproportionation of TCS to DCS not being able to proceed adequately.
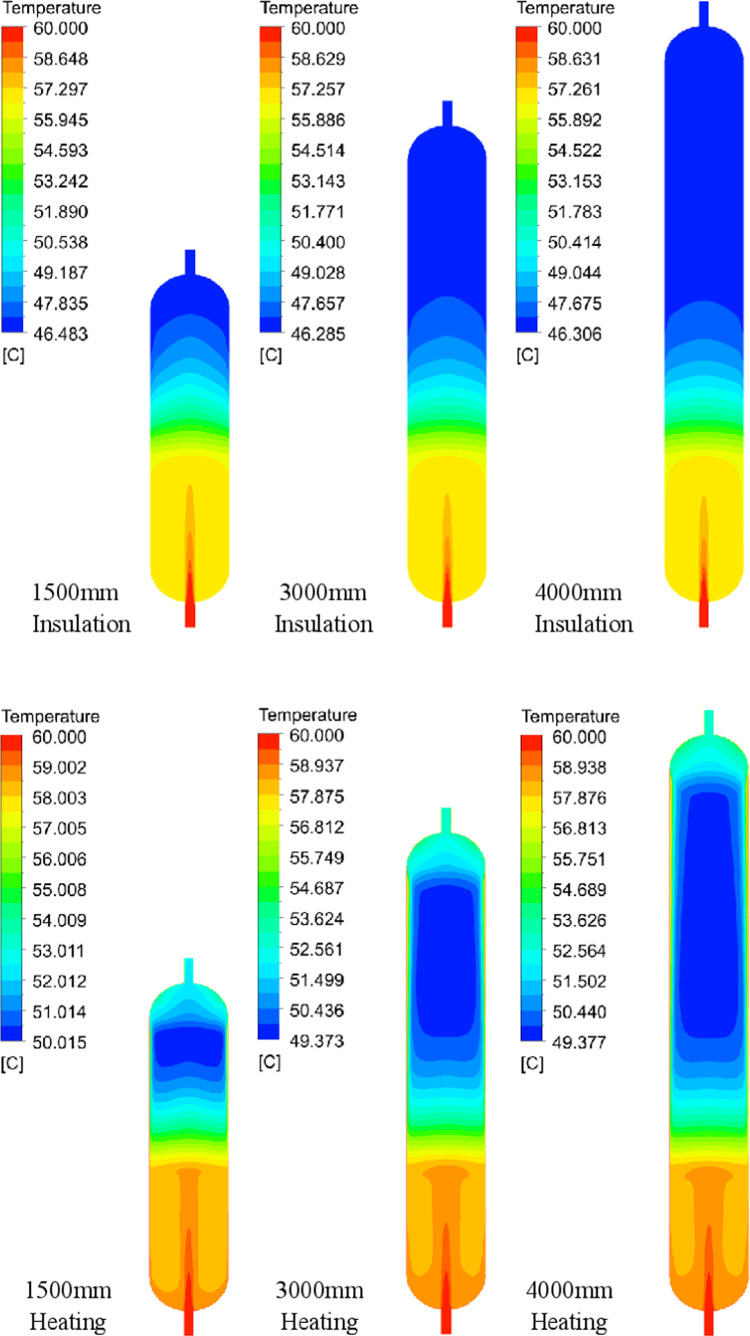
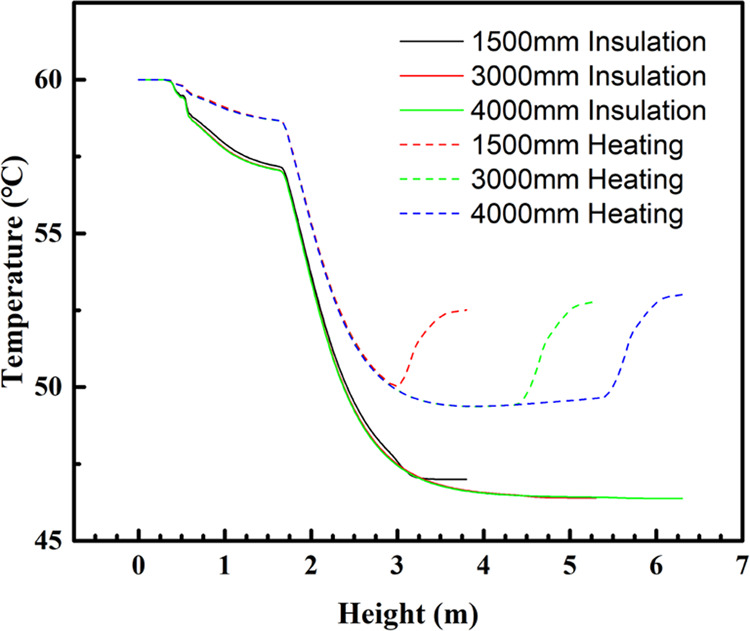
As shown in Figure 7, the temperature distribution inside the reactor at different catalyst bed heights can be seen when the feed temperature is 60 °C. When the reactor wall is insulated, the material temperature at the inlet is the highest, and as the material flows and reacts in the reactor, the material temperature at the outlet is the lowest, which is about 46.3–46.5 °C. The temperature of the material in the reactor tends to decrease with the direction of material flow.
Figure 7.
Temperature distribution in the reactor at different bed heights at a feed temperature of 60 °C.
Similarly, as shown in Figure 8, when the reactor wall is insulated along the axis of the reactor center, the material first passes through the free-flow zone, and the temperature decreases slowly; after entering the catalyst layer, the temperature decreases rapidly, and the temperature decreasing tendency is the same, even under different bed heights; when the bed height is 1500 mm, the material does not have a full reaction, and the temperature does not decrease to the lowest, but when the bed height is 3000–4000 mm, the material temperature decreases to about 46.3 °C, and then does not change anymore.
Figure 8.
Temperature trends along the reactor center axis for different bed heights at 60 °C feed temperature.
Due to the fast temperature drop of the material at the back end of the bed, it would lead to the TCS not being able to react sufficiently to produce DCS, so constant temperature heating of the reactor wall was considered. The reactor wall temperature was maintained at the same temperature as the feed temperature.
As shown in Figure 7, when the reactor wall is heated and at the same temperature as the feed, a low-temperature zone occurs in the interior of the catalyst bed at about 49.4–50.0 °C. This is because the resin has a low thermal conductivity, causing the lowest temperatures to occur in the region away from the reactor wall surface. Figure 7 clearly shows that the overall temperature of the material inside the reactor increased after heating the reactor walls. Correspondingly, the DCS concentration at the outlet increased, as shown in Table 3. When the reactor wall is heated, the DCS concentration at the outlet can be increased, which is favorable for increasing the DCS output rate.
Table 3. Outlet DCS Concentration at Different Bed Heights.
| 1500 mm |
3000 mm |
4000 mm |
||||
|---|---|---|---|---|---|---|
| reactor wall | n | Y (DCS) (%) | n | Y (DCS) (%) | n | Y (DCS) (%) |
| insulation | 0.906 | 9.41 | 0.944 | 9.80 | 0.945 | 9.82 |
| heating | 0.915 | 9.50 | 0.956 | 9.93 | 0.958 | 9.95 |
3.4. Flow Rate
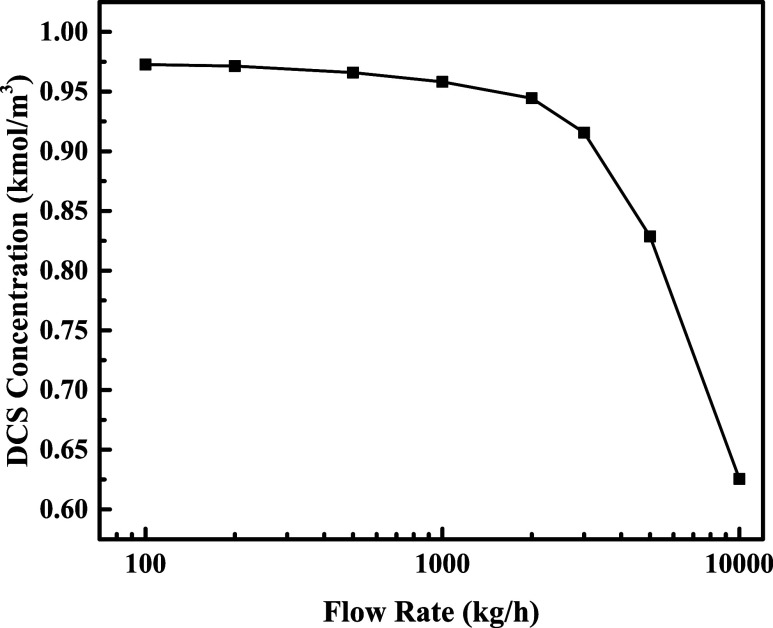
The effect of different flow rates on DCS generation was investigated at a bed thickness of 4000 mm and a flow temperature of 60 °C. The flow rates were set as 100–10,000 kg/h, and the DCS concentration at the outlet is shown in Figure 9.
Figure 9.
Flow rate and DCS concentration.
As shown in Figure 9, when the feed flow rate is 100–200 kg/h, the DCS concentration at the outlet is basically unchanged, and the yield of DCS is about 10.34%; with the increase of flow rate to 1000 kg/h, the DCS concentration at the outlet decreases slowly, and the yield of DCS decreases to 9.95%. When the flow rate increases to 2000 kg/h, the DCS concentration at the outlet starts to decrease significantly faster. The yield is 9.81% at a flow rate of 2000 kg/h and decreases rapidly to 6.5% at a flow rate of 10,000 kg/h. It can be shown that too low a flow rate or flow rate does not increase the DCS yield, but too high a flow rate or flow rate can significantly reduce the DCS yield. Therefore, the optimum flow rate is 1000–2000 kg/h at a feed temperature of 60 °C when a high DCS yield can be obtained.
3.5. L/D Ratio
The TCS disproportionation reaction at different flow rates can be achieved by varying the catalyst bed cross-sectional size and length while the catalyst filling amount remains constant. Based on a bed of 800 mm diameter and 4000 mm height, with a feed flow rate of 1000 kg/h and feed and reactor wall temperatures of 60 °C, the DCS yields were investigated at cross-sectional diameters of 500, 600, 700, 800, 900, and 1000 mm, respectively. The corresponding L/D ratio is shown in Table 4.
Table 4. L/D ratio at Different Cross Sections.
| D (mm) | L (mm) | L/D |
|---|---|---|
| 500 | 10,240 | 20.5 |
| 600 | 7111 | 11.9 |
| 700 | 5120 | 7.3 |
| 800 | 4000 | 5.0 |
| 900 | 3055 | 3.4 |
| 1000 | 2560 | 2.6 |
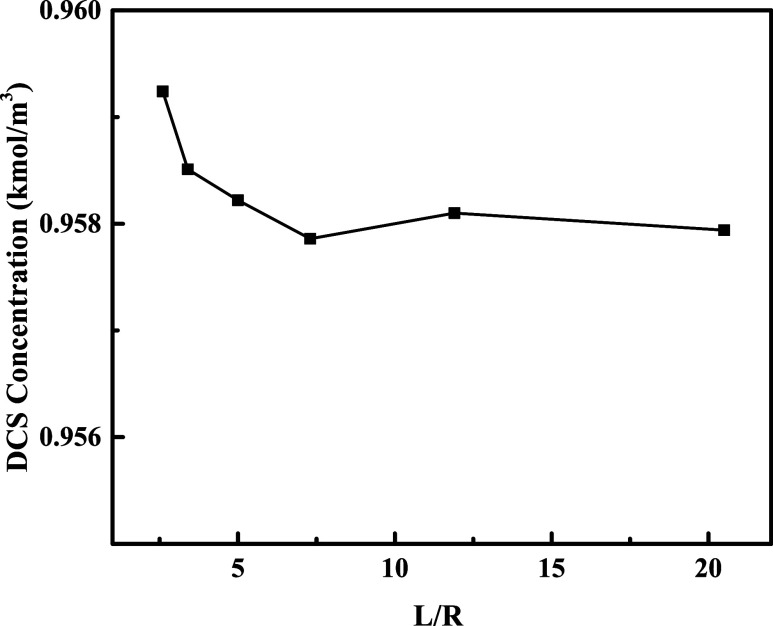
As shown in Figure 10, when the reactor cross-sectional diameter is 1000 mm, the L/D ratio is the smallest, and the DCS concentration at the outlet is the largest, and as the L/D ratio increases, the bed height increases, the cross-sectional diameter decreases, and the DCS concentration at the outlet decreases slightly. However, from the overall results, the influence of the L/D ratio on the DCS concentration at the outlet is limited, and the DCS concentration at the outlet under different L/D ratios is basically maintained at about 0.958 kmol/m3.
Figure 10.
Outlet DCS concentrations at different L/D ratios.
Nevertheless, different aspect ratios still affect the flow pressure drop of the material and the cost of the reactor fabrication. Larger L/D ratios result in longer material flow distances and higher pressure losses. Smaller L/D ratios require larger reactor cross-sectional dimensions, which not only increases the footprint of the reactor but also increases the processing cost of the reactor. Therefore, the appropriate reactor L/D ratio is selected under the most economical cost conditions.
3.6. DCS Production Rate
Based on the simulation of the disproportionation reaction in a simple cylindrical reactor, the optimum operating conditions were derived by comparing the key process parameters such as different bed heights, feed temperatures, flow rates, and aspect ratios, with a bed thickness of 4000 mm, a feed temperature of 60 °C, a flow rate of 1000 kg/h, and an L/D ratio of 5.0. In order to verify the reliability of the model and its practical industrial application, the fabrication of the simple cylindrical reactor equipment and the experiment of DCS production by TCS disproportionation reaction were carried out. During the experiments, the liquid material at the reactor outlet was collected by varying different flow rates, and the components of the sampled material were detected by the gas chromatography–mass spectrometry (GC–MS) method.
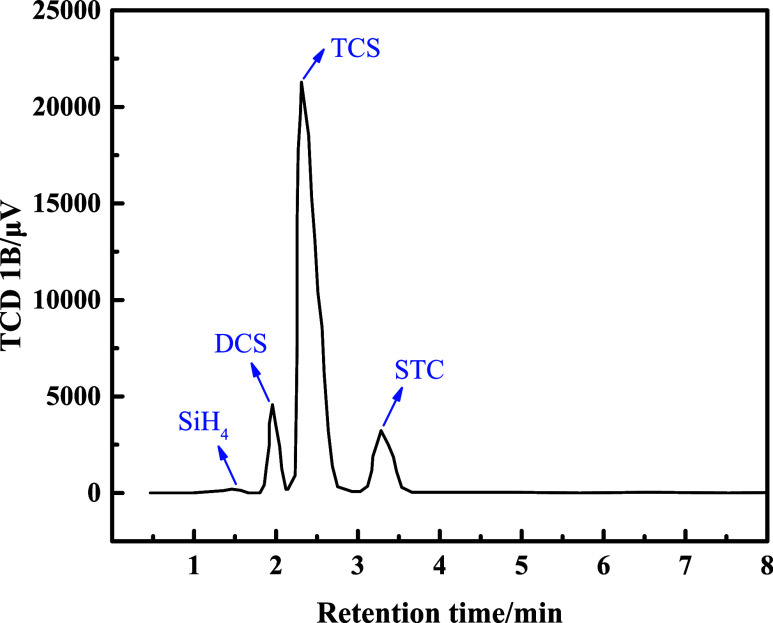
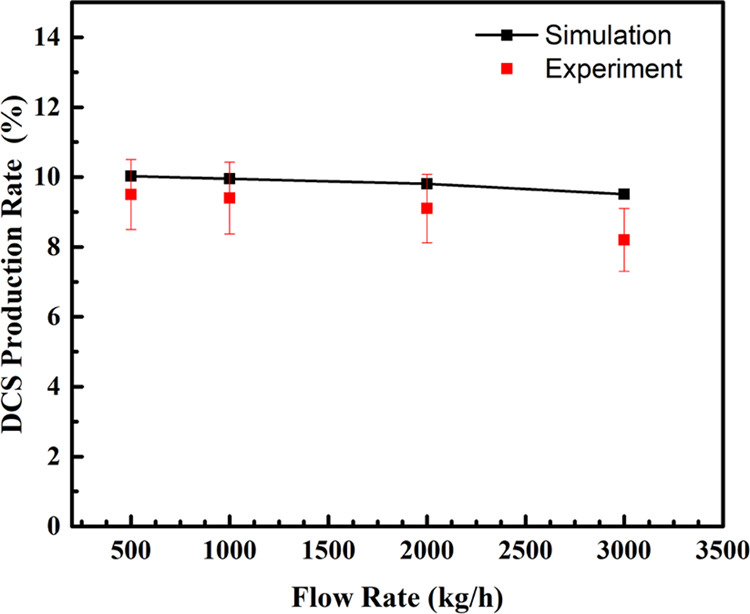
With a bed thickness of 4000 mm, an inlet flow rate of 1000 kg/h, and an inlet temperature of 60 °C, the results of the component detection at the outlet are shown in Figure 11. The results show that the liquid at the outlet contains four components, namely, TCS, DCS, STC, and a trace amount of SiH4. Based on the integration of the detected peak area, the percentage content of each component can be derived. The percentage of TCS at the outlet of the actual reactor is 80.14%, STC is 10.75%, and DCS is 9.03%, from which the conversion rate of the reactor could be calculated as 19.86% for TCS and 9.03% for DCS. Under the same operating conditions, the simulated conversion of TCS is 20.85%, and the yield of DCS is 9.95%. Moreover, we investigated the DCS conversion rate at different feed rates, and the results are shown in Figure 12. As shown in Figure 12, the DCS yield decreases slowly as the feed rate increases. At a feed flow rate of 3000 kg/h, the experimental results are lower than the simulated results, which may be related to the degradation of the catalytic properties, such as the shedding of functional groups. In general, the simulation results are in good agreement with the experimental values, indicating that the CFD simulation can effectively predict the DCS production rate.
Figure 11.
Component measurements at the reactor outlet (at a flow temperature of 60 °C, a bed thickness of 4000 mm, and a flow rate of 1000 kg/h).
Figure 12.
Comparison of results at different feed rates.
4. Conclusions
The reaction of TCS in a fixed-bed reactor has been studied under different conditions of temperature, feed rate, bed height, and L/D ratio using fluid dynamics calculations and chemical reaction modeling. The results show that increasing the bed thickness is favorable to enhance the DCS production rate and ensure the reaction to proceed adequately. The optimum bed thickness is 3000–4000 mm. The conversion rate of DCS is linearly related to the feed temperature, with higher temperatures leading to higher DCS production rates. Similarly, the influence of feed rate is also significant; a feed rate that is too small cannot improve the DCS generation rate, while a feed rate that is too large would reduce the DCS generation rate. The L/D ratio has a small effect on the DCS generation rate with the same bed volume.
Based on the simulation results, a simple cylindrical fixed-bed reactor has been designed, and the components at the reactor outlet are experimentally investigated and analyzed. The results show that the simulation results can better predict the DCS generation rate under different feed rate conditions, which is instructive for industrial applications.
Acknowledgments
This work was supported by the National Natural Science Foundation of China (No. 62025403), the Natural Science Foundation of Zhejiang Province (LD22E020001), “Pioneer” and “Leading Goose” R&D Program of Zhejiang (2022C01215 and 2024C01006), and the Fundamental Research Funds for the Central Universities (226-2022-00200).
The authors declare no competing financial interest.
References
- Liu H. P.; Jung S.; Fujimura Y.; Fukai C.; Shirai H.; Toyoshima Y. Low-temperature plasma-enahanced chemical vapor deposition of crystal silicon film from dichlorosilane. Jpn. J. Appl. Phys. 2001, 40, 44 10.1143/JJAP.40.44. [DOI] [Google Scholar]
- Regolini J. L.; Bensahel D.; Mercier J.; D’Anterroches C.; Perio A. Epitaxial Silicon Layers Made by Reduced Pressure/Temperature CVD. MRS Proc. 1988, 129, 609–613. 10.1557/PROC-129-609. [DOI] [Google Scholar]
- Mazen F.; Baron T.; Papon A. M.; Truche R.; Hartmann J. M. A two steps CVD process for the growth of silicon nano-crystals. Appl. Surf. Sci. 2003, 214 (1–4), 359–363. 10.1016/S0169-4332(03)00521-X. [DOI] [Google Scholar]
- Lee J. H.; Kim U. J.; Han C. H.; Rha S. K.; Lee W. J.; Park C. O. Investigation of silicon oxide thin films prepared by atomic layer deposition using SiH2Cl2 and O3 as the precursors. Jpn. J. Appl. Phys. 2004, 43 (3A), L328 10.1143/JJAP.43.L328. [DOI] [Google Scholar]
- Bagatur’yants A. A.; Novoselov K. P.; Safonov A. A.; Savchenko L. L.; Cole J. V.; Korkin A. A. Atomistic modeling of chemical vapor deposition: silicon nitride CVD from dichlorosilane and ammonia. Mater. Sci. Semicond. Process. 2000, 3 (1–2), 23–29. 10.1016/S1369-8001(00)00006-8. [DOI] [Google Scholar]
- Bagatur’yants A. A.; Novoselov K. P.; Safonov A. A.; Cole J. V.; Stoker M.; Korkin A. A. Silicon nitride chemical vapor deposition from dichlorosilane and ammonia: theoretical study of surface structures and reaction mechanism. Surf. Sci. 2001, 486 (3), 213–225. 10.1016/S0039-6028(01)01050-0. [DOI] [Google Scholar]
- Lee Y. S.; Lee Y. H.; Ju H. J.; Lee W. J.; Lee H. S.; Rha S. K. Characteristics of SiO2/Si3N4/SiO2 stacked-gate dielectrics obtained via atomic-layer deposition. J. Nanosci. Nanotechnol. 2011, 11 (7), 5795–5799. 10.1166/jnn.2011.4326. [DOI] [PubMed] [Google Scholar]
- Hartmann J. M.; Loup V.; Rolland G.; Séméria M. N. Effects of temperature and HCl flow on the SiGe growth kinetics in reduced pressure–chemical vapor deposition. J. Vac. Sci. Technol., B: Microelectron. Nanometer Struct.--Process., Meas., Phenom. 2003, 21 (6), 2524–2529. 10.1116/1.1623508. [DOI] [Google Scholar]
- Saito T.; Shimogaki Y.; Egashira Y.; Sugawara K.; Takahiro K.; Nagata S.; Yamaguchi S.; Komiyama H. Kinetic study of chemical vapor deposition of WSix films from WF6 and SiH2Cl2: Determination of molecular size and reactivity of gas species. Thin Solid Films 2006, 513 (1–2), 36–42. 10.1016/j.tsf.2006.01.002. [DOI] [Google Scholar]
- Jarkin V. N.; Kisarin O. A.; Kritskaya T. V. Methods of trichlorosilane synthesis for polycrystalline silicon production. Part 2: Hydrochlorination and redistribution. Modern Electron. Mater. 2021, 7 (2), 33–43. 10.3897/j.moem.7.2.65572. [DOI] [Google Scholar]
- Li K. Y.; Huang C. D. Redistribution reaction of trichlorosilane in a fixed-bed reactor. Ind. Eng. Chem. Res. 1988, 27 (9), 1600–1606. 10.1021/ie00081a008. [DOI] [Google Scholar]
- Prades L.; Dorado A. D.; Climent J.; Guimerà X.; Chiva S.; Gamisans X. CFD modeling of a fixed-bed biofilm reactor coupling hydrodynamics and biokinetics. Chem. Eng. J. 2017, 313, 680–692. 10.1016/j.cej.2016.12.107. [DOI] [Google Scholar]
- Zou Z.; Ge Y.; Zhu J. Y.; Wang J. W.; Zhu Q. S.; Li H. Z. Industrial practice and CFD investigation of a multi-chamber fluidized bed reactor for MnO2 ore reduction. Chem. Eng. J. 2023, 455, 140732 10.1016/j.cej.2022.140732. [DOI] [Google Scholar]
- Huang X.; Ding W. J.; Yan J. M.; Xiao W. D. Reactive distillation column for disproportionation of trichlorosilane to silane: reducing refrigeration load with intermediate condensers. Ind. Eng. Chem. Res. 2013, 52 (18), 6211–6220. 10.1021/ie3032636. [DOI] [Google Scholar]


