Abstract
In order to investigate the overpressure and flame propagation characteristics of gas explosions in turning pipelines, this study designed a transparent organic glass pipeline test system with different turning angles (30°, 60°, 90°, 120°, and 150°) and conducted a series of experimental studies to analyze the explosion shock wave overpressure and flame propagation behavior. The experimental results show that with the increase of the turning angle of the pipeline, the overpressure of the explosion shock wave significantly increases. In terms of flame propagation characteristics, when the turning angle is small, the flame can adhere to the outer wall of the pipeline corner and gradually fill the entire pipeline section. When the turning angle increases, the flame forms a blank area near the outer wall of the corner, and the blank area expands with the increase in the corner. In addition, the increase in the turning angle promotes the increase in the velocity of the explosion flame front. The research results of this review are of great significance for a deeper understanding of the mechanism of gas explosions in turning pipelines and evaluating their potential hazards.
1. Introduction
Gas explosion accidents can be regarded as the most serious type of coal mine accidents, and the number of deaths caused by gas accidents has remained high in major coal mine accidents over the years.1,2 According to statistics from the National Mine Safety Administration in China, the number of deaths from coal mine gas explosion accidents in China from 2018 to 2022 was about 339, accounting for approximately 26.08% of the total number of deaths in coal mine accidents. The main forms of gas explosions include explosion shock waves and explosion flames, both of which cause devastating damage to personnel and facilities.3,4 Therefore, in-depth exploration of the overpressure of shock waves and the propagation law of explosion flames after coal mine gas explosions is of great significance for accurately assessing the potential scope and degree of explosion hazards as well as providing a scientific basis for coal mine safety management and emergency response.
In the past few decades, numerous researchers have conducted extensive research on the overpressure and flame propagation characteristics of gas explosion shock waves. Richmond et al.5,6 (early 1980s) conducted experimental research on the flame propagation process of gas explosions in full-scale simulated coal mine tunnels and found that the flame propagation speed and overpressure changes of gas explosions in tunnels are related to the structure of the tunnel walls and the distribution of gas concentration. Oh et al.7 studied the instability and acceleration of gas explosion flames and discovered the turbulent mechanism of flame acceleration; that is, small disturbances of obstacles can cause flame acceleration, resulting in a sharp increase in pressure in pipelines. With the deepening of research, more researchers have begun to pay attention to the influence of the pipeline structure on gas explosion characteristics. Zhu et al.8 studied the evolution law of overpressure and flame propagation process during gas explosion in U-shaped long-wall coal mining face and H-shaped cross cutting through numerical simulation. They found that there is a very high reflection pressure near the corner, but it decays very quickly in free space. Zhang et al.9 conducted gas explosion experiments on pipelines at different turning angles and found that the peak overpressure attenuation rate of shock waves increased with the increase of pipeline turning angles. The flame propagation speed first increased, then decreased, and rapidly increased after bending the pipeline. Sulaimana et al.10 also found using FLACS numerical simulation software that the presence of a 90° turning tube can increase the flame propagation speed by about twice. Si et al.11 found that different pipeline structures have a significant impact on gas explosion overpressure and flame propagation speed. Li et al.12 used Ansys/Fluent software to simulate gas explosions in excavation tunnels with different cavity structures and found that cavity structures can reduce overpressure and flame velocity.
In addition to pipeline structure, factors such as gas volume dose, pipeline cross-sectional area, and obstacle distribution also have a significant impact on the overpressure evolution law and flame propagation characteristics of shock waves.13−17 Cheng et al.18 studied the relationship between explosion flame and gas volume dose and found that the length of the explosion flame is 3–5 times the length of the initial gas accumulation zone. Lin et al.19−22 conducted gas explosion experiments in the presence of obstacles and found that obstacles can intensify explosion intensity and significantly increase explosion pressure. Nie et al.23 conducted a 9.5% gas explosion experiment and found that the metal wire mesh in pipelines can accelerate flame propagation speed. Wang et al.24 studied the effects of concentration and obstacles on the transition from methane air mixture explosion to detonation in long pipelines. They found that the higher the blockage rate of obstacles, the stronger the interaction between the unburned mixture and shock wave, which is very beneficial for accelerating the explosion flame.
In addition, some researchers have also paid attention to the influence of other factors on the characteristics of gas explosions. Cui et al.25 analyzed the effects of pressure and temperature on combustion duration within the initial temperature range of 123–273 K. Ajrash et al.26 investigated the effects of different concentrations of methane and reaction lengths on pressure waves and flame characteristics in a 30 m long, straight large detonation tube. Jiang et al.27 found that in a semiclosed straight pipe, the peak overpressure of shock waves and flame propagation velocity increases with distance, and this result was verified through numerical simulations. Yue et al.28 found that due to effective ventilation of doors and windows, the maximum overpressure of gas explosions in residential buildings is less than 10 kPa. Researchers have also conducted an in-depth analysis of the propagation law of gas explosion shock waves from a theoretical perspective. Qu et al.,29,30 Wang et al.,31 and Jiao et al.32 proposed a simplified model for shock wave propagation. Xu et al.33,34 conducted experimental research on the propagation characteristics of gas explosions in a 7.2 m square section roadway, revealing the close relationship between the peak overpressure of gas explosions and the gas volume and propagation distance. Zhu et al.35 established an analytical model for the propagation of gas explosions along the roadway and used numerical simulation methods to obtain the variation law of gas explosion shock wave propagation along the roadway.
In summary, although a large amount of research has been conducted on the shock wave overpressure and flame propagation characteristics of gas explosions, relevant research on turning pipelines is still relatively limited. The specific mechanism of the influence of the turning angle on shock wave overpressure and flame propagation behavior is not yet fully understood. Therefore, this study aims to analyze in detail the shock wave overpressure and flame propagation characteristics of gas explosions in turning pipelines by designing a transparent organic glass pipeline test system with different turning angles, in order to provide an important basis for a deeper understanding of the mechanism of gas explosions in turning pipelines and evaluating their potential hazards.
2. Experimental System and Plan
2.1. Testing System
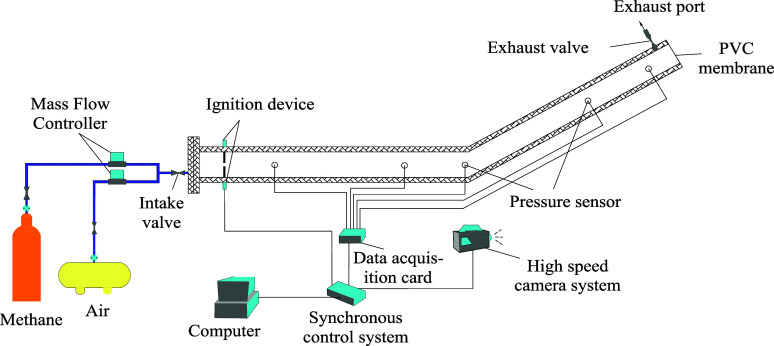
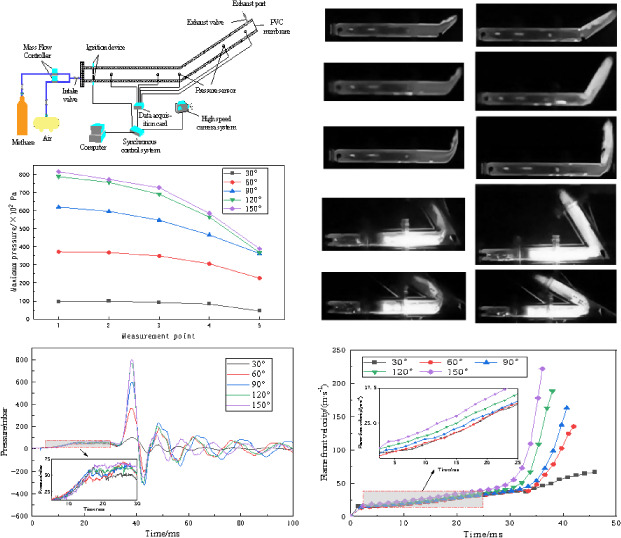
The experimental system includes experimental pipelines, gas distribution systems, ignition systems, pressure data acquisition systems, high-speed camera systems, and synchronous control systems. The test pipeline is a transparent organic glass pipeline with different turning angles. The pipeline is divided into two parts: a horizontal pipe section and an inclined pipe section. The length of the horizontal pipe section is 900 mm, and the length of the inclined pipe section is 800 mm. The cross-sectional size of the pipeline is 80 × 80 mm, the wall thickness of the pipeline is 20 mm, and the compressive strength is 2 MPa. One end of the test pipeline is completely closed, and the other end is sealed with a PVC film. The gas distribution system includes a methane cylinder, an air compressor, and two gas mass flow controllers (ALICAT, America) for preparing a premixed gas of methane and air at the desired concentration. The ignition system includes a high-energy igniter and ignition electrodes, with an ignition voltage of 6 kV and an ignition energy of 2.5 J. The ignition point is located on one side of the fully sealed orifice, 100 mm away from the orifice. The pressure data acquisition system includes an MD-HF high-frequency dynamic pressure sensor (MEOKON, China) and a USB-1608FS data acquisition card (NI MCC, America), which in real time collects pressure data generated by explosions during the test process. The acquisition frequency of the high-frequency dynamic pressure sensor is 20K/s. The high-speed camera system captures the flame development process during the experiment at a frequency of 2000 fps, with a pixel size of 1024 × 1024 nm, to capture the shape of the explosion flame and the position of the flame front. The synchronous control system is used to control the ignition system, pressure data acquisition system, and high-speed camera system to operate in a preset start stop sequence and interval. The schematic diagram of the experimental system is shown in Figure 1.
Figure 1.
Experimental system diagram.
The connection of the experimental system is shown in Figure 1. We connect the various components of the experimental system as shown in the figure. Before each experiment, a layer of PVC film was laid at the position indicated by the PVC film in the figure to complete the preparation work. Simultaneously, we open the intake and exhaust valves to start ventilation, control the intake of air and methane through a gas flow controller, and then inject a certain concentration of methane air premixed gas into the pipeline. The raw gas in the pipeline is discharged through the exhaust port at the end of the pipeline. To ensure that the original gas in the pipeline is completely discharged, the volume of gas injected into the pipeline is set to four times the volume of the pipeline. After inflation, the inlet and exhaust valves of the pipeline were closed, the methane cylinder and air compressor valves were closed, the gas flow controller was closed, and the pipeline was prepared for explosion testing. In order to ensure the complete collection of all data during the explosion process, the pressure data acquisition system and high-speed camera system should be activated before the ignition system. We press the start button of the synchronous controller, and the pressure data acquisition system and high-speed camera system will immediately start (t = 0 ms). When t = 10 ms, the ignition system starts. After the experiment is completed, we organize and save the experimental data, clean the experimental pipeline, and prepare for the next set of experiments.
2.2. Experimental Plan Design
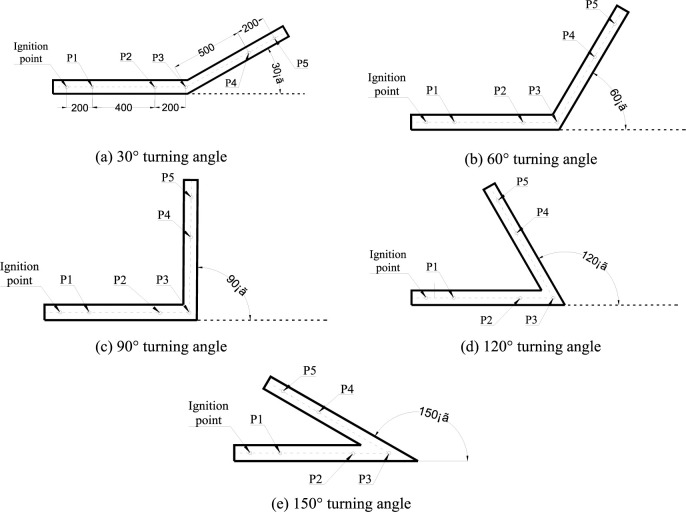
The gas used in this study is 99.99% pure methane gas with a gas concentration set at 9.5%. The pipeline is designed with five sets of turning angles, namely 30°, 60°, 90°, 120°, and 150°. The specific form of the pipeline is shown in Figure 2. The specific layout of the pressure sensor measuring points is shown in Figure 2a. Measuring point 1 is located 200 mm to the right of the ignition point, measuring point 2 is located 200 mm in front of the center point of the pipeline bend, measuring point 1 is 400 mm away from measuring point 2, measuring point 3 is located at the center of the pipeline bend (intersection of the centerline of the straight pipe section and the centerline of the inclined pipe section), measuring point 4 is located 500 mm behind the center point of the pipeline bend, and measuring point 5 is located 200 mm behind measuring point 4. During the experiment, in order to ensure the reliability of the experimental results, each group of experiments was conducted three or more times. According to scientific statistical principles, three sets of valid data were taken for each level as the final experimental data.
Figure 2.
Schematic diagram of the measuring point layout.
3. Results and Discussion
3.1. Propagation Law of Explosion Shock Wave Overpressure
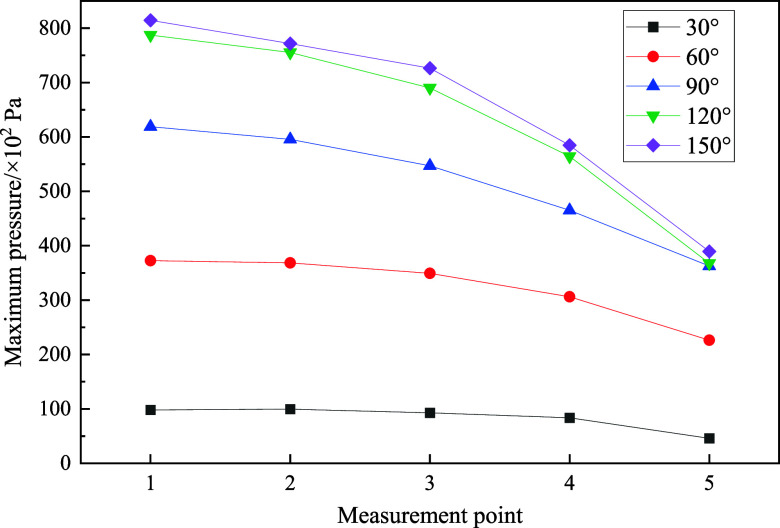
The maximum explosion pressure distribution curve reflecting the distribution of the gas explosion shock wave overpressure inside the pipeline is shown in Figure 3. First, we analyze the overall development trend of shock wave overpressure. The distribution of internal explosion shock wave overpressure in pipelines with 30°, 60°, 90°, 120°, and 150° corners shows a similar pattern. In the section of the pipeline before the corner, the explosion shock wave overpressure shows a relatively gentle development trend, with the first half almost horizontal, and a certain decrease near the corner of the pipeline. We further analyze the specific numerical values of shock wave overpressure. When the corner of the pipeline is 30°, the values of shock wave overpressure in various parts of the pipeline are relatively small, with the maximum shock wave overpressure obtained at sensor 1 and an average shock wave overpressure value of 98.05 mbar. As the turning angle gradually increases, the overpressure values of shock waves in various parts of the pipeline also increase. At a turning angle of 150°, the maximum value of 814.38 mbar was obtained at sensor 1.
Figure 3.
Distribution curve of the maximum explosion pressure.
When a gas explosion occurs inside a turning pipeline, the impact of the pipeline corner on the explosion pressure is mainly reflected in two aspects. On the one hand, pipeline corners can cause significant turbulence effects inside the pipeline. This turbulence effect will significantly increase the reaction efficiency of reactants inside the pipeline, thereby enhancing the overpressure of the explosive shock waves. The larger the turning angle of the pipeline, the more significant the turbulence effect caused, which, in turn, leads to a greater overpressure of the explosion shock wave. On the other hand, when the shock wave develops to the bend of the pipeline, it will undergo intense reflection with the pipeline wall, generating a complex flow field. Part of the energy of the shock wave was consumed by the reflection of the pipeline wall. The larger the turning angle of the pipeline, the larger the reflection area generated and the more significant the turbulence effect generated by the shock wave, which consumes more energy on the reflection of the pipeline wall. Previous studies have mostly conducted experiments in nonflame zones, where no reactants have reacted and the explosive shock wave has lost its source of energy replenishment. Therefore, the shock wave is only affected by the second aspect of pipeline turning, which causes severe reflection between the shock wave and the wall, resulting in a complex flow field and weakening the strength of the shock wave. However, in this experiment, the study area was the gas explosion flame zone. During the propagation of the explosion shock wave in the pipeline, the reactants continue to react. Therefore, the explosion shock wave inside the pipeline is simultaneously affected by the bending of the pipeline, resulting in both excitation and suppression effects. The experimental results show that the excitation effect of the pipeline turning on the explosion shock wave inside the pipeline is more significant, which leads to an overall trend of increasing shock wave overpressure inside the pipeline with the increase of the pipeline turning angle.
3.2. Analysis of Pressure Fluctuations at Measurement Points
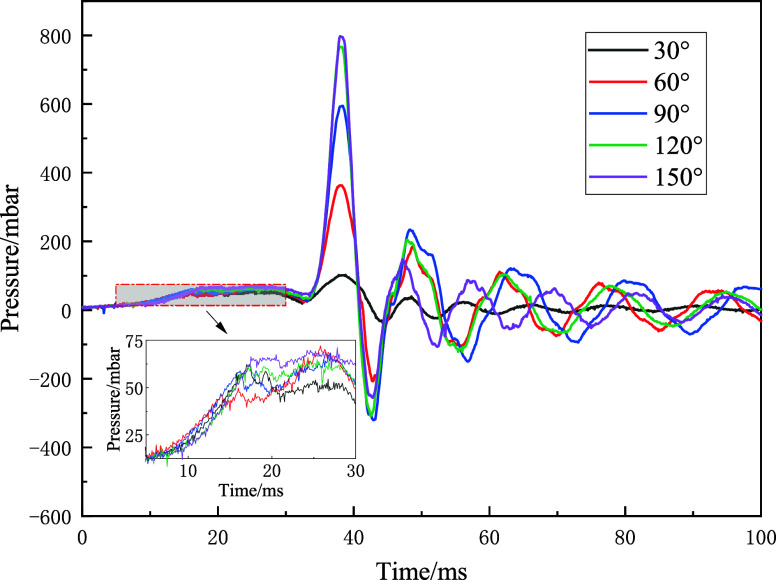
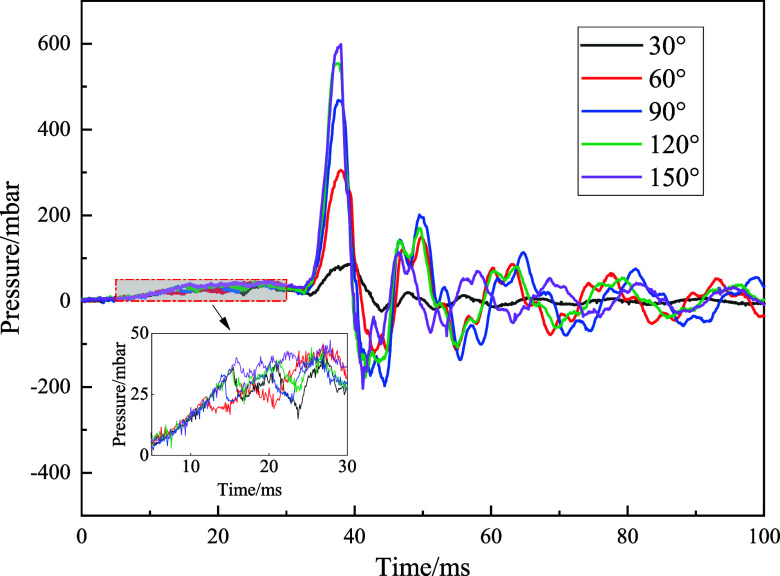
In order to further investigate the impact of pipeline bends on explosion shock wave overpressure, this study focuses on the analysis and research of changes in shock wave overpressure before and after pipeline bends. The pressure data from sensors 2 and 4 are selected for analysis, as they are located before and after the turning angle. The changes in pressure data of sensors 2 and 4 over time are shown in Figures 4 and 5, respectively.
Figure 4.
Time-varying curve of pressure data at measuring point 2.
Figure 5.
Time-varying curve of pressure data at measuring point 4.
Figures 4 and 5, respectively, show the pressure data of measuring point 2 located in the front area of the turning pipeline corner and measuring point 4 located in the back area of the turning pipeline corner during the explosion process over time. Both measuring points experienced a slow and small increase in pressure during the initial ignition stage, with slight differences in the pressure rise at different turning angles, but the overall difference was not significant. As the reaction progresses, when the time reaches 30–35 ms, the pressure values of the two measuring points at different turning angles begin to rapidly rise and reach the pressure extremum point at 35–40 ms, which is also the maximum pressure value in the entire explosion reaction process. At this point, the greater the turning angle, the greater the pressure value. Measurement point 2 achieved a maximum explosion pressure of 797.65 mbar at a turning angle of 150°, while measurement point 4 achieved a maximum explosion pressure of 598.43 mbar at a turning angle of 150°. The pressure data of measuring point 4 are generally significantly lower than those of measuring point 2. Subsequently, the explosion pressure began to rapidly decrease after reaching its maximum value and reached another extreme point on the pressure curve at 40–46 ms, at which point the pressure value was negative, indicating the formation of a certain negative pressure space at both measuring points. This is mainly because the gas generated by the explosion rapidly expands and spreads outward, causing the gas around the measuring point to be quickly drawn away and forming a temporary low-pressure area. Afterward, the pressure values of both measuring points began to rise again and then fell again, forming a wave-like pressure change curve in a cyclic manner. The peak absolute value of the wavy pressure curve shows a regular downward trend until it approaches the horizontal level. At this stage, except for the very small vibration amplitude of the pressure curve at a turning angle of 30°, the vibration amplitude of the pressure curve at other turning angles is at a similar level. This indicates that in the later stage of the explosion reaction, the influence of different turning angles on the pressure changes at the two measuring points tends to be consistent.
In addition, there are certain differences in the pressure fluctuation characteristics between the two measuring points. The second measuring point is basically composed of some relatively regular large oscillations, while the fourth measuring point is mixed with some small fluctuations resembling steps in the large oscillations. This is mainly because measuring point 4 is located after the bend and the explosion wave undergoes more complex reflections and interactions during propagation, especially generating more vortices and turbulence at the bend. These complex gas dynamic behaviors have led to more complex and diverse pressure fluctuations at measuring point 4, resulting in small fluctuations resembling steps in large oscillations.
3.3. Explosion Flame Morphology and Structure
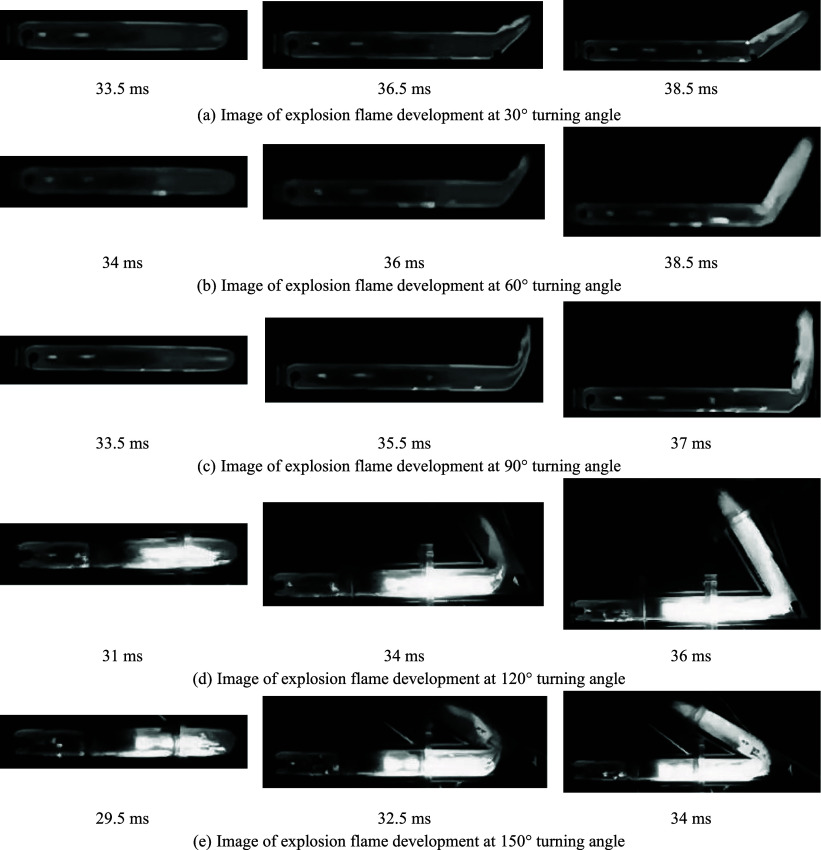
Figure 6 shows the development of the explosion flames at different turning angles. By carefully observing the flame structure, it can be found that the bending structure of the pipeline has varying degrees of influence on the structure of the explosion flame. In the initial stage of explosion flame development, the shape of the explosion flame remains basically the same at different turning angles, presenting an arched structure and gradually moving forward. When the explosion flame enters the corner area of the pipeline, its front shape begins to change. Specifically, when the turning angle is small, the explosion flame will adhere to the outer wall of the pipeline corner and develop in the direction of flame propagation. At this point, there was initially no flame present on the inner wall of the pipeline corner, but as the explosion flame continued to spread forward, the flame surface gradually widened and eventually filled the entire pipeline section. This phenomenon is mainly attributed to the fact that when the turning angle is small, the impact of the pipeline corner on the propagation of the explosion flame is relatively small, and it can easily adhere to the outer wall of the pipeline corner and propagate forward. At the same time, due to the reflection and vortex effect of the inner wall of the pipeline, the flame surface gradually widens and eventually fills the entire cross-section of the pipeline.
Figure 6.
Image of explosion flame development at different turning angles.
As the turning angle of the pipeline increases, the explosion flame begins to create a flame blank area near the outer wall of the pipeline corner when it reaches the corner. And as the corner of the pipeline further increases, the blank area of the flame also expands. The analysis of this phenomenon is as follows: With the increase of the turning angle of the pipeline, when the explosion flame propagates to the corner of the pipeline, the flow velocity of the flame near the outer wall of the corner decreases due to the enhanced blocking and guiding effect of the corner on the flame. This in turn hinders the transfer of reactants and heat to the front face of the flame, resulting in the formation of a flame blank in that area. In addition, the larger the turning angle, the more significant the blocking and guiding effects, leading to further expansion of the flame blank area.
3.4. Explosion Flame Front Velocity
The front velocity of explosive flames is also an important indicator of the characteristics of the explosive flames. Therefore, this section mainly analyzes the flame front velocity of gas explosions at different turning angles. We use MATLAB software to obtain the brightness data of the image and binary the grayscale of the image, as shown in Figure 7.
Figure 7.
Binary grayscale processing of explosion flame.
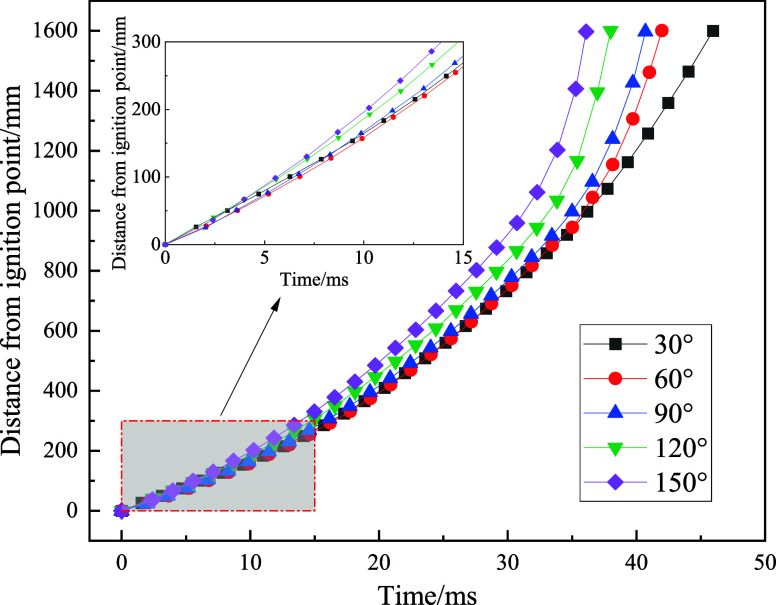
Based on the data organized by MATLAB software, we further plotted the curve of the position of the explosion flame front over time, as shown in Figure 8.
Figure 8.
Time-dependent curve of the position of the explosion flame front.
The graph in Figure 8 shows the temporal variation of the position of the flame front. From the graph, it can be observed that the position of the explosion flame front shows a relatively stable curve over time, and the slope of the curve gradually increases, indicating that the front velocity of the explosion flame is gradually increasing. Especially when the time develops to around 30–35 ms, the rate of change in the slope of the curve begins to show a significant increase, indicating that the rate of increase in the velocity of the explosion flame front is accelerating. In addition, there is a certain regularity in the total time of explosion flame propagation.
The flame front velocity is calculated from the data of the change in the position of the explosion flame front over time, and the calculation formula is as follows:
| 1 |
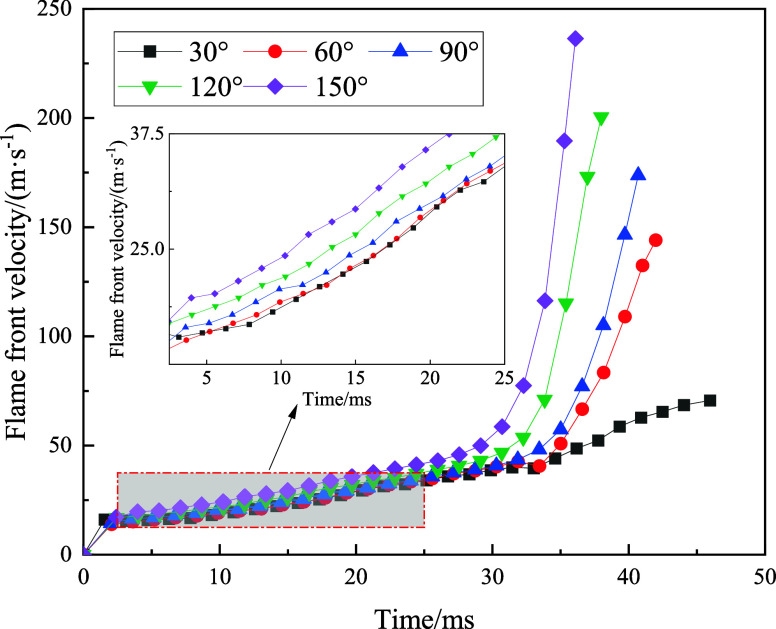
In the formula, t1 and t2 are time, Δ is the distance represented by the unit pixel, and N1 and N2 are the horizontal coordinates of the flame front pixels in the photo at time t1 and t2, respectively. We calculate the data of speed variation over time and plot the curve of speed variation over time, as shown in Figure 9.
Figure 9.
Time-dependent curve of explosion flame front velocity.
The graph in Figure 9 shows variation of the velocity of the explosion flame front over time. It can be observed from the graph that the variation of the velocity of the explosion flame front shows a certain regularity. In the initial stage of the explosion, the velocity of the explosion flame front maintains a steady development. Subsequently, the velocity of the explosion flame front rapidly increased until the flame spread to the outlet of the test pipeline. By comparing and analyzing the time-varying curves of the explosion flame front velocity at different turning angles, it can be clearly seen that as the turning angle increases, the front velocity of the explosion flame shows a gradually increasing overall trend. At a turning angle of 150°, the velocity of the explosion flame front reaches its maximum value. This indicates that the increase in the turning angle has a significant promoting effect on the development of the velocity of the explosion flame front. The experimental results are consistent with those obtained by Sulaimana et al. using FLACS numerical simulation and further confirm that the turning structure can significantly accelerate flame propagation under specific conditions.
As the turning angle of the pipeline increases, the velocity of the explosion flame front gradually increases, which is closely related to the turbulence effect inside the pipeline during propagation of the explosion flame. When the explosion flame passes through the bend of the pipeline, the airflow in the main flow area is affected by the rebound of the pipeline wall, thereby enhancing the turbulence effect in the bend area of the pipeline. In addition, vortices will form in the turning area, which further distorts the explosion flame front and increases its area. The increase in the area of the flame front increases the contact area between the flame and the unburned gas, thereby accelerating the combustion reaction rate and increasing the flame propagation speed. When the flame front propagates to the unburned gas vortex, it is drawn into it and coupled with the unburned gas vortex to form a turbulent flame, further increasing the flame propagation speed. As the angle of pipeline turning increases, the turbulence effect caused by pipeline turning gradually strengthens, which further increases the velocity of the explosion flame front after the pipeline turning point.
4. Conclusions
This account delves into the overpressure and flame propagation characteristics of gas explosion shock waves in turning pipelines. Through experimental design and data analysis, the following main conclusions are drawn:
(1) In a turning pipeline, the overpressure of the explosion shock wave significantly increases with an increase in the pipeline turning angle. The effect of pipeline corners on shock waves is manifested as a dual effect of excitation and suppression. However, in this study, the excitation effect dominates, leading to an increase in the overpressure values with increasing corners. In addition, the reflection of shock waves and turbulence effects at the corners of pipelines have a significant impact on the distribution of overpressure.
(2) The pressure data from the measuring points before and after the turn indicate that the pressure slowly increases during the initial stage of the explosion and then quickly reaches its peak, and a negative pressure area appears after reaching its peak. The pressure fluctuation at the measuring point behind the pipeline corner is more complex, showing more stepped small fluctuations, which are attributed to the complex reflection and eddy current effects at the corner.
(3) In the initial stage of flame propagation, the flame morphologies are similar at different turning angles. However, as the flame enters the corner area, the flame structure undergoes significant changes. When the corner is small, the flame advances toward the outer wall of the corner. When the corner increases, a flame blank area appears near the outer wall of the corner, and the blank area expands with the increase of the corner.
(4) The increase in the turning angle significantly promotes the increase in the velocity of the explosion flame front. This is due to the enhanced turbulence effect at the corners of the pipeline, which increases the contact area between the flame and unburned gas, thereby improving the combustion reaction rate and the flame propagation speed.
Acknowledgments
This research work was supported by the National Natural Science Foundation of China (Nos. 52374196 and U1904210), the Henan Key Research and Development Special Project (No. 221111321000), the Henan Science and Technology Research Project (Nos. 242102321038 and 242102320002), and the North China University of Water Resources and Electric Power Scientific Research Launching Project for High-Level Talents (No. 202109003).
The authors declare no competing financial interest.
Notes
S.G. contributed to writing of the original draft and writing, reviewing, and editing. G.J. contributed to writing, reviewing, and editing. Y.W. contributed to investigation and formal analysis. Y.S. contributed to formal analysis.
References
- Cheng L.; Jiang B.; Guo H. Modeling the causes of accidental gas explosions from the perspective of safety information loss. Process Saf. Prog. 2022, 41 (4), 772–782. 10.1002/prs.12356. [DOI] [Google Scholar]
- Lou Z.; Wang K.; Kang M.; Zhao W.; Wei G.-Y.; Yue J.-W.; Yao H.-W. Plugging methods for underground gas extraction boreholes in coal seams: A review of processes, challenges and strategies. Gas Sci. Eng. 2024, 122, 205225. 10.1016/j.jgsce.2024.205225. [DOI] [Google Scholar]
- Song W.; Cheng J.; Wang W.; Qin Y.; Wang Z.; Borowski M.; Wang Y.; Tukkaraja P. Underground mine gas explosion accidents and prevention techniques–an overview. Arch. Min. Sci. 2021, 66 (2), 297–312. 10.24425/ams.2021.137463. [DOI] [Google Scholar]
- Yang A.; Liu Y.; Gao K.; Li R.; Li Q.; Li S. Numerical simulation of gas explosion with non-uniform concentration distribution by using Open FOAM. ACS Omega 2023, 8 (51), 48798–48812. 10.1021/acsomega.3c06054. [DOI] [PMC free article] [PubMed] [Google Scholar]
- Richmond J.-K.; Liebman I. A physical description of coal mine explosions. Symp. Combust. 1975, 15 (1), 115–126. 10.1016/S0082-0784(75)80289-X. [DOI] [Google Scholar]
- Richmond J.-K.; Liebman I.; Bruszak A.-E.; Miller L.-F. A physical description of coal mine explosions. Symp. Combust. 1979, 17 (1), 1257–1268. 10.1016/S0082-0784(79)80119-8. [DOI] [Google Scholar]
- Oh K.-H.; Kim H.; Kim J.-B.; Lee S.-E. A study on the obstacle-induced variation of the gas explosion characteristics. J. Loss Prev. Process Ind. 2001, 14 (6), 597–602. 10.1016/S0950-4230(01)00054-7. [DOI] [Google Scholar]
- Zhu Y.; Wang D.; Shao Z.; Xu C.; Li M.; Zhang Y. Characteristics of methane-air explosions in large-scale tunnels with different structures. Tunn. Undergr. Sp. Technol. 2021, 109, 103767. 10.1016/j.tust.2020.103767. [DOI] [Google Scholar]
- Zhang L.-L.; Yang Q.-Y.; Shi B.-M.; Niu Y.; Zhong Z. Influences of a pipeline’s bending angle on the propagation law of coal dust explosion induced by gas explosion. Combust. Sci. Technol. 2021, 193, 798–811. 10.1080/00102202.2019.1673381. [DOI] [Google Scholar]
- Sulaimana S. Z.; Kasmani R. M.; Kiaha M. H.; Kidamb K.; Hassimb M. H.; Ibrahima N.; Alib R. R. The influence of 90 degree bends in closed pipe system on the explosion properties using hydrogen-enriched methane. Chem. Eng. 2014, 36, 271–276. 10.3303/CET1436046. [DOI] [Google Scholar]
- Si R.; Zhang L.; Niu Y.; Wang L.; Huang Z.; Jia Q.; Li Z. Experimental study on characteristics of flame propagation and pressure development evolution during methane-air explosion in different pipeline structures. Front. Earth Sci. 2024, 12, 1358876. 10.3389/feart.2024.1358876. [DOI] [Google Scholar]
- Li S.; Gao K.; Liu Y.; Ma M.; Huo C.; Cong M.; Li Y. Influence of the cavity structure in the excavation roadway on the gas explosion characteristics. ACS Omega 2022, 7 (8), 7240–7250. 10.1021/acsomega.1c07027. [DOI] [PMC free article] [PubMed] [Google Scholar]
- Huang F.; Cao Z.; Guo J.; Jiang S. Comparisons of heuristic, general statistical and machine learning models for landslide susceptibility prediction and mapping. Catena 2020, 191, 104580. 10.1016/j.catena.2020.104580. [DOI] [Google Scholar]
- Niu Y.-H.; Zhang L.-L.; Shi B.-M. Experimental study on the explosion propagation law of coal dust with different moisture contents induced by methane explosion. Powder Technol. 2020, 361, 507–511. 10.1016/j.powtec.2019.11.089. [DOI] [Google Scholar]
- Yan G.-X.; Li Z.; Galindo Torres S.-A.; Scheuermann A.; Li L. Transient two-phase flow in porous media: A literature review and engineering application in geotechnics. Geotechnics 2022, 2 (1), 32–90. 10.3390/geotechnics2010003. [DOI] [Google Scholar]
- Jia Q.-S.; Si R.-J.; Wang L.; Li Z.; Xue S. Influence of initial gas concentration on methane-air mixtures explosion characteristics and implications for safety management. Sci. Rep. 2023, 13 (1), 13519. 10.1038/s41598-023-40383-3. [DOI] [PMC free article] [PubMed] [Google Scholar]
- Niu Y.-H.; Zhang L.-L.; Shi B.-M.; Yang Q.; Zhong Z. Methane-coal dust mixed explosion in transversal pipe networks. Combust. Sci. Technol. 2021, 193 (10), 1734–1746. 10.1080/00102202.2019.1711071. [DOI] [Google Scholar]
- Cheng C.-L.; Si R.-J.; Wang L.; Jia Q.-S.; Xin C.-P.; Chen X. Experimental study on the effect of initial accumulation pattern on gas explosion and explosion suppression in a real roadway. Case Stud. Therm. Eng. 2023, 51, 103544. 10.1016/j.csite.2023.103544. [DOI] [Google Scholar]
- Lin B.-Q.; Guo C.; Sun Y.-M.; Zhu C.-J.; Yao H. Effect of bifurcation on premixed methane-air explosion overpressure in pipes. J. Loss Prev. Process Ind. 2016, 43, 464–470. 10.1016/j.jlp.2016.07.011. [DOI] [Google Scholar]
- Lin B.-Q.; Hong Y.-D.; Zhu C.-J.; Jiang B.-Y.; Liu Q.; Sun Y.-M. Quantitative relationship between flow speed and overpressure of gas explosion in the open-end square tube. Explos. Shock Waves 2015, 35 (1), 108–115. 10.11883/1001-1455(2015)01-0108-08. [DOI] [Google Scholar]
- Zhu C.-J.; Lin B.-Q.; Jiang B.-Y.; Zhai C. Characteristics of flame and blast-wave propagation during a gas explosion in parallel tunnels. J. China Univ. Min. Technol. 2011, 40 (3), 385–389. [Google Scholar]
- Jiang B.-Y.; Lin B.-Q. Numerical simulation of explosion-proof safety distance and propagation characteristics of gas deflagration. J. Min. Saf. Eng. 2014, 31 (1), 139–145. [Google Scholar]
- Nie B.; Hu S.; Yang L.; Wang L.; Su X. Characteristics of flame velocity of gas explosion with obstruction in pipeline. Perspect Sci. 2016, 7, 277–281. 10.1016/j.pisc.2015.12.003. [DOI] [Google Scholar]
- Wang C.; Huang F.; Addai E.-K.; Dong X. Effect of concentration and obstacles on flame velocity and overpressure of methane-air mixture. J. Loss Prev. Process Ind. 2016, 43, 302–310. 10.1016/j.jlp.2016.05.021. [DOI] [Google Scholar]
- Cui G.; Wang S.-H.; Liu J.-G.; Bi Z.; Li Z. Explosion characteristics of a methane/air mixture at low initial temperatures. Fuel 2018, 234, 886–893. 10.1016/j.fuel.2018.07.139. [DOI] [Google Scholar]
- Ajrash M.-J.; Zanganeh J.; Moghtaderi B. Deflagration of premixed methane-air in a large scale detonation tube. Process. Saf. Environ. 2017, 109, 374–386. 10.1016/j.psep.2017.03.035. [DOI] [Google Scholar]
- Jiang B.; Su M.; Liu Z.; Cai F.; Yuan S.; Shi S.; Lin B. Effects of changes in fuel volume on the explosion-proof distance and the multipara meter attenuation characteristics of methane-air explosions in a semi-confined pipe. J. Loss Preven. Process Ind. 2016, 39, 17–23. 10.1016/j.jlp.2015.11.008. [DOI] [Google Scholar]
- Yue C.-J.; Chen L.; Li Z.; Mao Y.-C.; Yao X.-H. Experimental study on gas explosions of methane-air mixtures in a full-scale residence building. Fuel 2023, 353, 129166. 10.1016/j.fuel.2023.129166. [DOI] [Google Scholar]
- Qu Z.-M.; Zhou X.-Q.; Wang H.-Y.; Ma H.-L. Overpressure attenuation of shock wave during gas explosion. J. China Coal Soc. 2008, 33 (4), 410–414. [Google Scholar]
- Qv Z.-M.Study on attenuation Law and failure Mechanism of shock Wave of Gas explosion in Coal Mine roadway, Ph. D. Thesis; China University of Mining and Technology: BeiJing, 2007. [Google Scholar]
- Wang H.-Y.; Cao T.; Zhou X.-Q.; Tan G.-Q.; Xie J.-G.; Jiang W. Research and application of attenuation law about gas explosion shock wave in coal mine. J. China Coal Soc. 2009, 34 (6), 778–782. [Google Scholar]
- Jiao Y.; Zhou X.-Q.; Duan Y.-L.; Gong W. Concentration and temperature diffusion laws of smoke plume after methane explosions. J. China Coal Soc. 2011, 36 (2), 293–297. [Google Scholar]
- Xu J.-D.; Li H.; Hao X. Application of FLACS in the Study of Numerical Simulation of Gas Explosion in Confined Space. J. N. China Inst. Sci. Technol. 2016, 13 (3), 7–11. [Google Scholar]
- Xu J.-D.; Zhang L.-C.; Li T.-F.; Yang G.-Y. A numerical simulation of stimulating effect of tramcars during the methane explosion propagation. Explos. Shock Waves 2012, 32 (1), 47–50. [Google Scholar]
- Zhu Z. Numerical simulation of gas explosion flow field characteristics and influencing factors in pipelines. J. China Univ. Min. Technol. 2017, 46 (2), 300–305. [Google Scholar]


