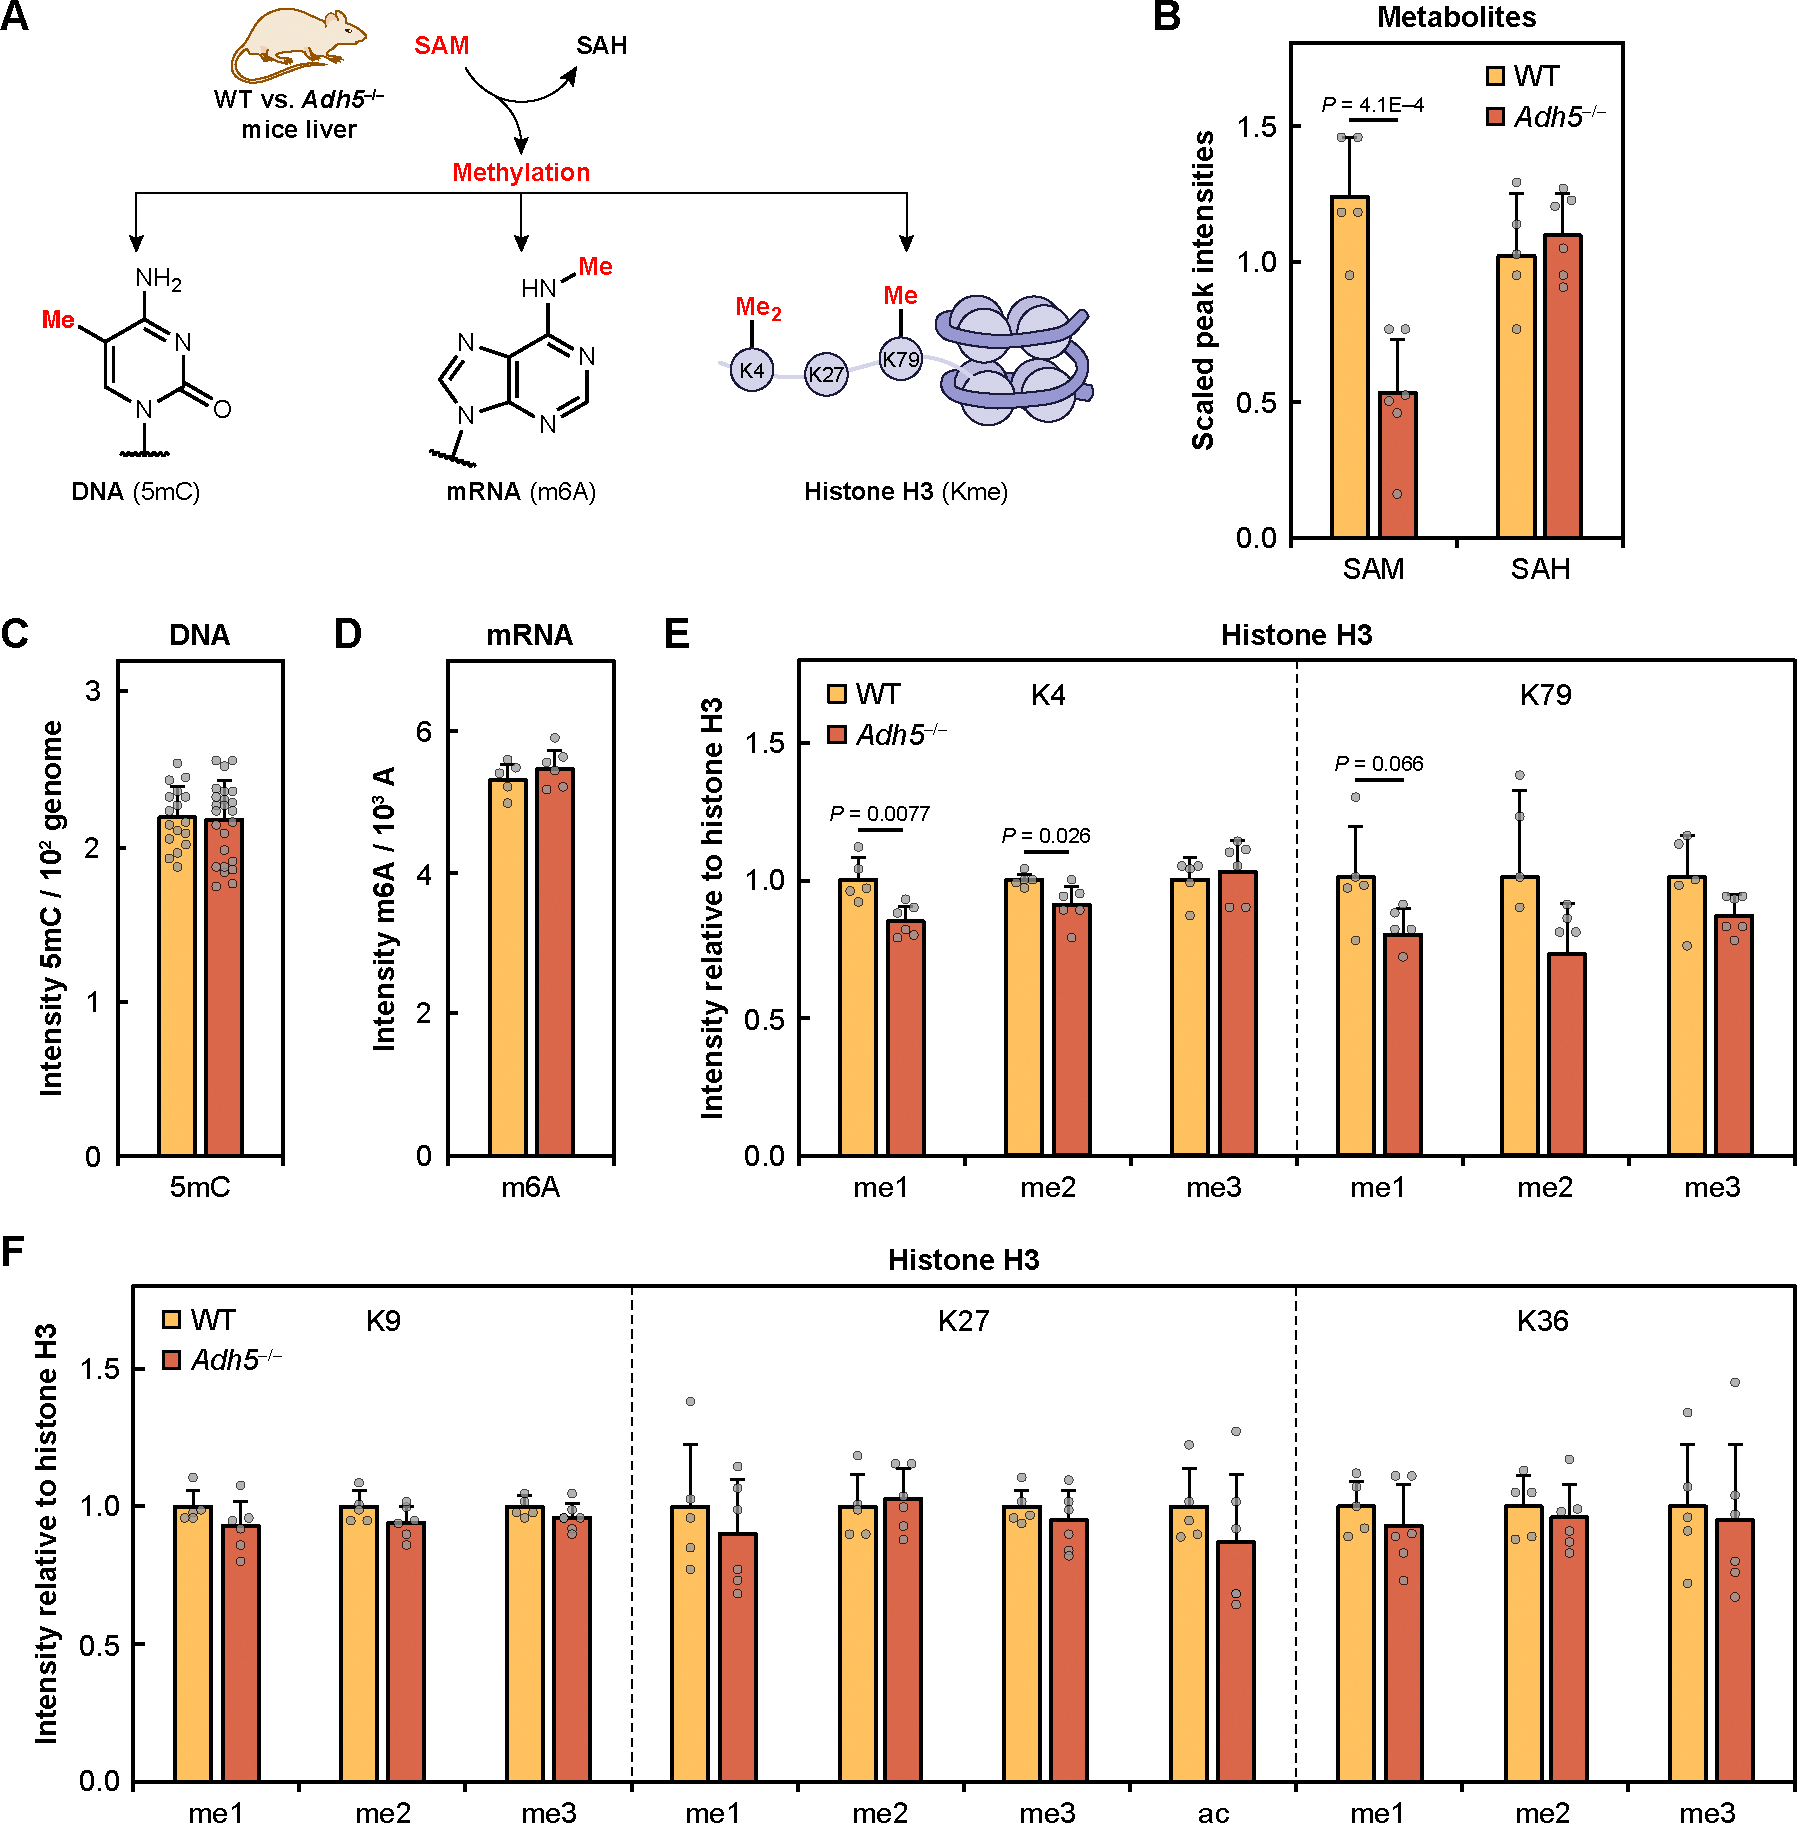
Fig. 4. Genetic mouse model of chronic formaldehyde overload has reduced methylation potential that specifically targets histone methyl sinks.

(A) Schematic of SAM and its downstream methylation that were measured in WT and Adh5−/− mice liver. (B) SAM and SAH measured by mass spectrometry in WT and Adh5−/− liver. (C) Global DNA methylation measured by 5-methyldeoxycytidine (5mC) and normalized by deoxycytidine (dC). (D) Global RNA methylation measured by N6-methyladenosine (m6A) and normalized by adenosine (A). (E) Histone H3 methylation measured by immunoblotting for K4 and K79 mono- (me1), di- (me2), and trimethylation (me3). (F) Histone H3 methylation measured by immunoblotting for K9, K27, and K36 mono-, di-, and trimethylation and K27 acetylation (ac). All histone blots were normalized by total histone H3. WT (n = 5, yellow) and Adh5−/− (n = 6, orange) of biological replicates. Error bars represent SD for all graphs. Statistical significance was determined with two-tailed t-test.
