Abstract
Voltage imaging with cellular specificity has been made possible by the advances in genetically encoded voltage indicators (GEVIs). However, the kilohertz rates required for voltage imaging lead to weak signals. Moreover, out-of-focus fluorescence and tissue scattering produce background that both undermines signal-to-noise ratio (SNR) and induces crosstalk between cells, making reliable in vivo imaging in densely labeled tissue highly challenging. We describe a microscope that combines the distinct advantages of targeted illumination and confocal gating, while also maximizing signal detection efficiency. The resulting benefits in SNR and crosstalk reduction are quantified experimentally and theoretically. Our microscope provides a versatile solution for enabling high-fidelity in vivo voltage imaging at large scales and penetration depths, which we demonstrate across a wide range of imaging conditions and different GEVI classes.
Introduction
Instruments capable of monitoring the activity of large numbers of neurons with genetic specificity are crucial for the study of brain function1–3. High-performance genetically encoded calcium indicators have made possible routine recordings of intracellular calcium dynamics across thousands of neurons1. However, calcium activity is a surrogate for the more fundamental electrical activity of neurons4. To directly capture membrane potential, genetically encoded voltage indicators (GEVIs) are required5, whose development has been an area of intense and ongoing activity. The latest generation of GEVIs can easily resolve individual action potentials with millisecond precision6–14, with sensitivities adequate to monitor subthreshold membrane potential variations.
Despite the enormous potential of GEVIs, their application to in vivo voltage imaging remains fraught with challenges. When attempting high-speed imaging over large fields-of-view (FOVs), signal levels per pixel are inevitably small, making it difficult to maintain adequate signal-to-noise ratio (SNR). This difficulty is exacerbated by tissue scattering and out-of-focus fluorescence that lead to background contamination and signal crosstalk (i.e. spurious signal from other neurons). To address these challenges, enhancements in GEVI performance, together with soma targeting15 and/or sparse labeling16, have made it possible to simultaneously image tens of cells in vivo using widefield microscopes equipped with state-of-the-art high-speed cameras featuring near perfect quantum efficiencies (QEs). However widefield imaging fails to provide background rejection, making it vulnerable to crosstalk and reduced SNR in cases of denser labeling. Targeted illumination can help limit the generation of out-of-focus background7,9,17, but becomes less effective with increasing target density. Alternatively, background can be inherently rejected with laser scanning microscopy (LSM), such as confocal19 or two-photon10,14,20–22 microscopy (2PM). However, most LSMs suffer from limitations in single-pixel detector sensitivity (<40% QE) and laser scanner throughput, both of which undermine SNR and FOV. While simultaneous multisite two-photon excitation23,24 can allow high-speed large FOV imaging with suppressed background, it comes at the cost of reduced excitation efficiency. To date, the ability to routinely perform sustained large-scale in vivo voltage imaging in densely labeled tissues with high SNR remains highly challenging.
To meet this challenge, we developed a kilohertz-rate targeted illumination confocal (TICO) microscope that combines the distinct advantages of widefield and scanning microscopy while circumventing their drawbacks. Our system incorporates technical innovations that simultaneously enable high fluorescence detection efficiency, high degree of background rejection, low photobleaching rates, kilohertz frame rates, wide imaging FOVs, and large penetration depths. We experimentally quantify the advantages of our microscope across multiple performance metrics in live mouse brains, which we supplement with a general theoretical framework for its optimization for in vivo applications.
We demonstrate the versatility of TICO microscopy with both a fully genetically encoded sensor somArchon8 and a hybrid chemogenetic sensor Voltron213, under a variety of imaging conditions and across multiple brain regions, with a large FOV up to 1.16 × 0.325 mm (at 800 Hz) or a fast imaging speed up to 4 kHz (over reduced FOVs). At relatively superficial layers (< 200 μm) we demonstrate sustained voltage imaging of over 50 neurons in densely labeled tissue over recording durations of 20 minutes. The imaging depth is further extended for more sparsely labeled tissue regions, where we demonstrate high SNR voltage imaging of cortical layer 3 neuronal populations. Still deeper imaging is demonstrated of cortical layers 1–5 neurons through an implanted microprism, and of hippocampal CA1 neurons through an imaging cannula. With the combined advantage of large FOV, high SNR and background rejection, TICO microscopy allows not only the simultaneous observation of distinct spiking activities across multiple cortical layers, but also spatially varying subthreshold oscillations across large neuronal populations, while at the same time achieving the highest single-photon voltage imaging depth of 300 μm in the mouse brain.
Results
TICO microscope design
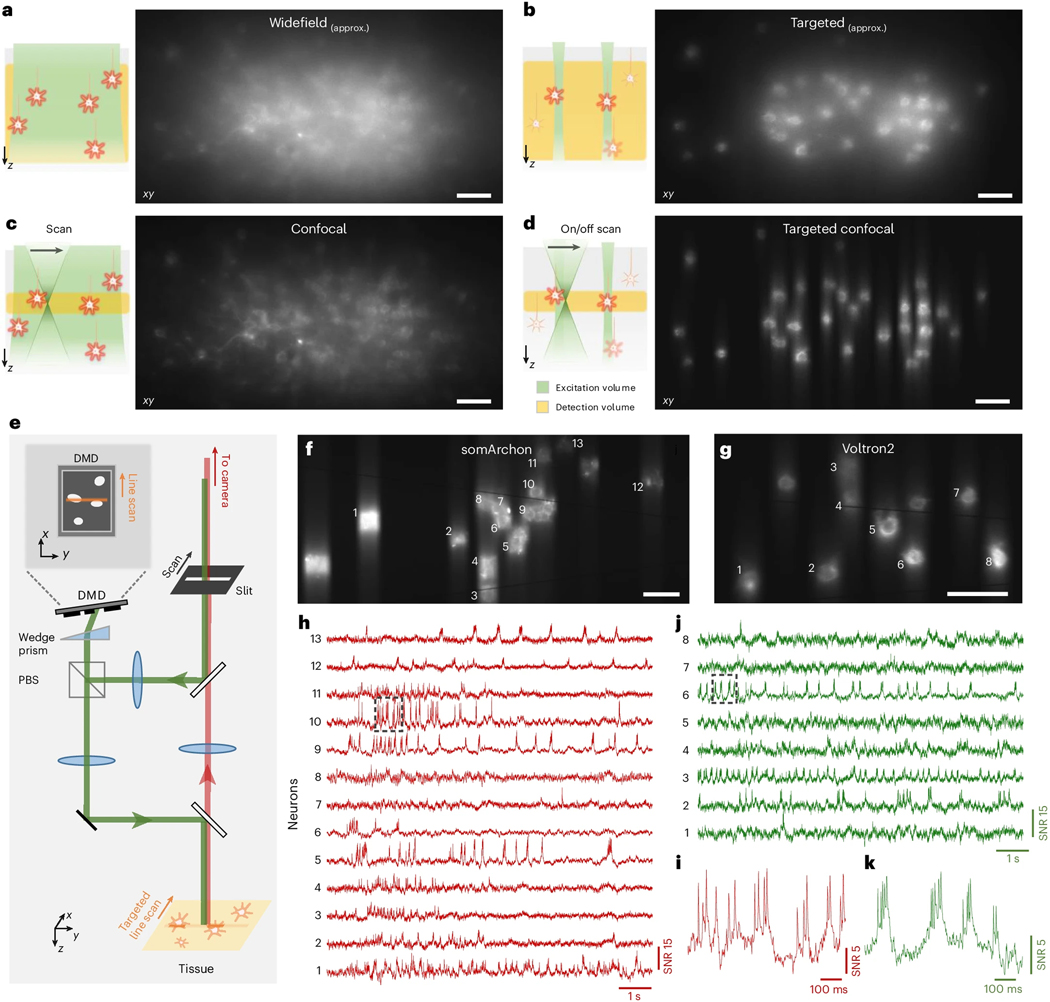
The idea of integrating targeted illumination and confocal gating into a single instrument is guided by the fact that, while both techniques are effective at reducing out-of-focus background, they operate on complementary components of the image formation process: targeted illumination suppresses background generation by limiting out-of-focus excitation; confocal gating rejects out-of-focus fluorescence in the detection path. When combined, the techniques operate in synergy, minimizing background and its associated shot noise and signal contamination [Fig. 1(a–d)]. This principle is validated by a theoretical model that incorporates both targeted illumination and confocal gating, enabling their respective contributions in improving SNR and signal-to-background ratio (SBR) to be quantified for in vivo voltage imaging (Supplementary Note 1.1,1.2, Supplementary Fig. 1,Supplementary Fig. 2). Our results confirm that the optimized combination of targeted illumination and confocal gating offers higher SNR and SBR than either strategy alone (Supplementary Note 1.3, Supplementary Fig. 3).
Figure 1. Principle and design of TICO microscope.
(a-d) Illustration (left panel, x-z view) and example images (right panel, x-y view) of different excitation and detection strategies applied to in vivo voltage imaging of Voltron2: (a) standard widefield microscopy where all neurons in a volume are uniformly illuminated and detected with a widefield camera; (b) targeted illumination microscopy where only selected neurons within the focal plane are illuminated, but fluorescence from the entire volume is detected; (c) confocal microscopy where all cells within the volume are illuminated but only fluorescence near the focal plane is detected; (d) TICO microscopy where only selected cells within the focal plane are illuminated, and only the generated fluorescence near the focal plane is detected. Note that images in (a,b) were acquired using a confocal slit size of 156 μm, which produces higher contrast than a true widefield microscope (see Supplementary Fig. 4).
(e) Simplified schematic of TICO microscope (see Extended Data Fig. 1d for a more detailed schematic).. Note that in the actual setup, the slit is fixed and scanning is performed with galvanometers. PBS, polarizing beamsplitter.
(f-k) Demonstration of in vivo voltage imaging of somArchon (f,h,i) and Voltron2 (g,j,k) in the neocortex using TICO microscopy. (f,g) Averaged fluorescence images from somArchon and Voltron2. (h,j) Fluorescence traces from the active neurons labeled in (f) and (g) respectively. (i,k) Zoomed-in fluorescence traces from the boxed regions in (h) and (j) respectively. Scale bars in (a-d, f, g) are 50 μm.
To achieve confocal imaging over large scales and at high speeds, we implemented a line-scan strategy1. This not only enables millimeter FOVs to be sampled at kilohertz rates by 1D scanning, but also allows the use of large-aperture scanners to achieve high numerical aperture fluorescence collection. However, a drawback of most LSMs is their low detection efficiency that comes from the use of single-pixel detectors or a line-scan camera. We addressed this issue by additionally implementing a re-scan strategy where the fluorescence is re-imaged onto an area-scan camera by a second galvanometric scanner, thus allowing us to benefit from the exceptionally high QE and low noise of modern sCMOS cameras. Still, line-scan illumination alone does not maximize the efficiency with which excitation power is delivered to the sample, and line confocal gating alone does not maximize the suppression of background. To achieve these, we complemented our microscope with targeted illumination.
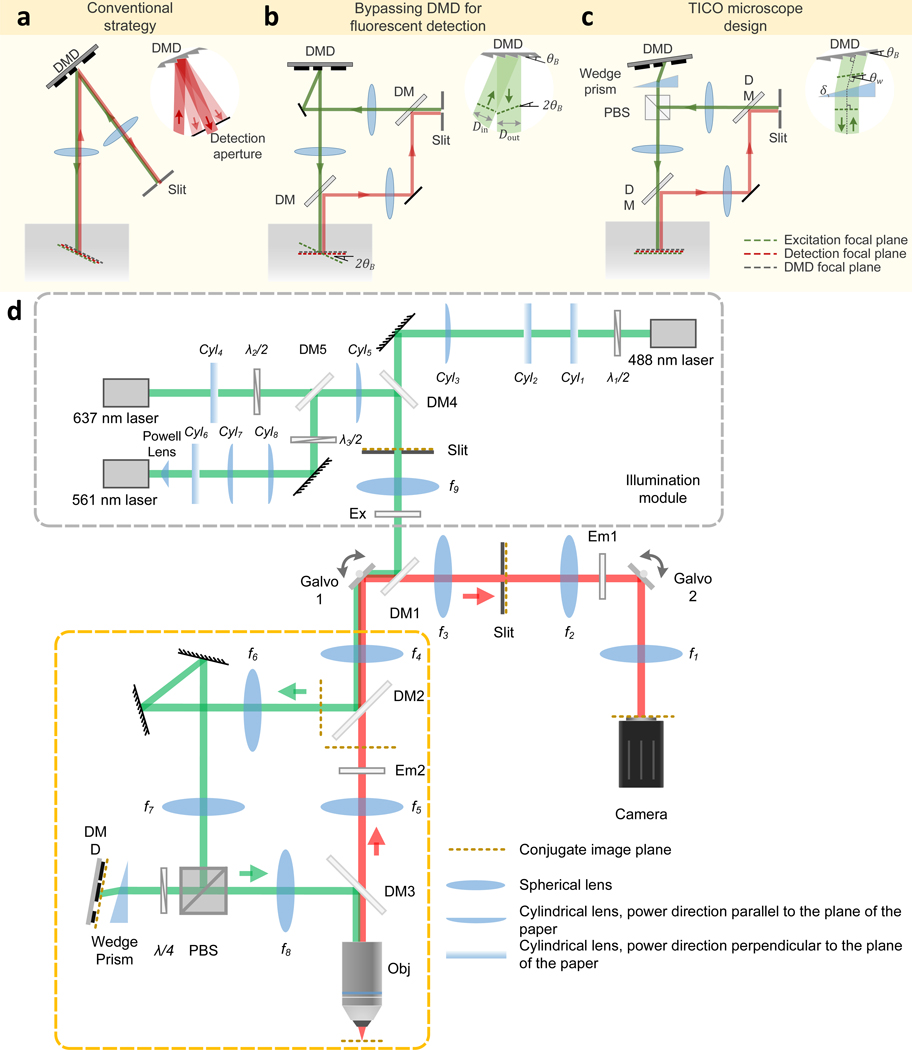
To enable targeted illumination, we inserted a digital micromirror device (DMD) in an intermediate image plane in the illumination path7. The illumination beam thus scans over a user-defined target pattern imprinted on the DMD, which is then projected into the sample with high contrast. While in conventional confocal microscopy the fluorescence detection path retraces the illumination path to achieve synchronized scan/de-scan1, here such a path overlap would severely undermine SNR because of diffraction losses introduced by the DMD [typically ~40–50%; Supplementary Note 3, Supplementary Fig. 8, Extended Data Fig. 1a]. To minimize fluorescence loss we decoupled the illumination and detection paths [Extended Data Fig. 1b], enabling the fluorescence signal to be de-scanned without passing through the DMD, resulting in a loss of only 6% due to the addition of two dichromatic mirrors. However, this led to a technical complication that the illumination and detection planes were no longer co-planar in the sample, due to the tilted-mirror geometry of DMDs, resulting in a mismatch, both lateral and axial, of the illumination and detection FOVs that prevented effective confocal gating. While a lateral FOV mismatch can be corrected by placing the DMD in a Littrow configuration26, an axial mismatch is more difficult to correct, with approaches typically involving the addition of a matched grating27 or a multi-pass geometry28. Our own solution was simpler and more light efficient, and corrected the DMD-induced image plane tilt with the use of a single wedge prism, which is capable of tilting the image plane by an angle with an apex angle and refractive index 29 [illustrated in Extended Data Fig. 1c]. When the DMD is tilted by this same angle, the excitation line remains in focus as it is swept across the DMD surface, allowing high-resolution light patterning across the entire FOV (Supplementary Fig. 10). After beam reflection from the DMD, the backward path through the same wedge prism cancels this tilt such that the image plane becomes perpendicular again with respect to the propagation direction, restoring full confocality between the excitation and detection beams.
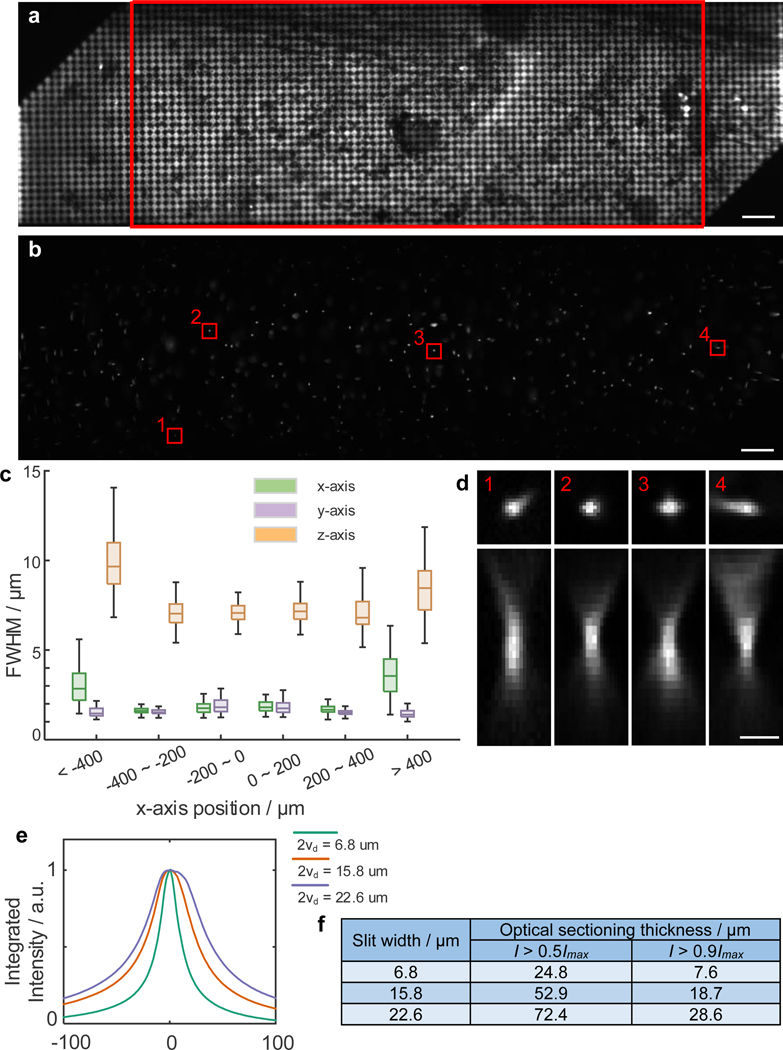
Following the design principles described above, we built a TICO microscope with decoupled illumination and detection paths using a DMD and off-the-shelf wedge prism [Fig. 1(e), Extended Data Fig. 1d]. We confirmed the system’s confocality and capacity to target/image with cellular resolution over a FOV of 1.16 × 0.325 mm (Extended Data Fig. 2). Three excitation wavelengths (488 nm, 561 nm and 637 nm) were integrated in the system to enable multicolor imaging of either somArchon-GFP or Voltron2-JF552 [Fig. 1(f–k)]. Added flexibility was provided by the use of an adjustable confocal slit (0 – 156 μm width), which allowed us to readily control the degree of confocal sectioning. As shown below, this flexibility in both illumination targeting and confocal sectioning was critical in allowing the system to adapt to different sample conditions for maximum SNR.
Characterization for in vivo voltage imaging
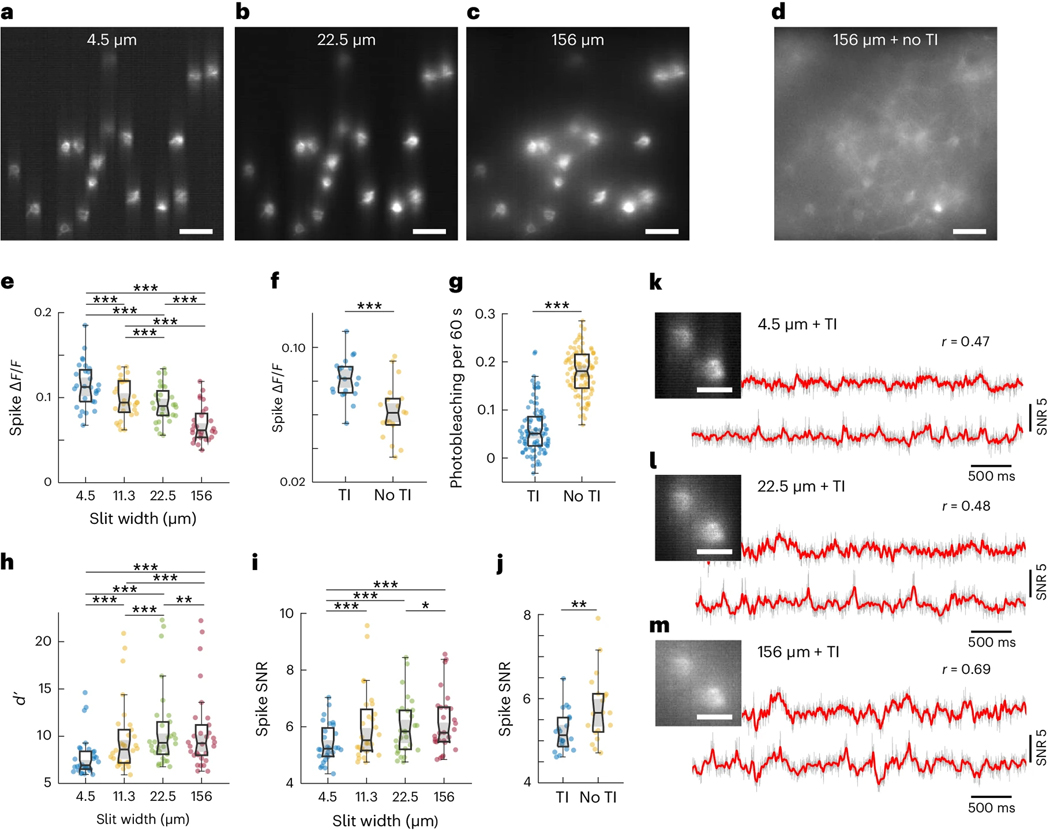
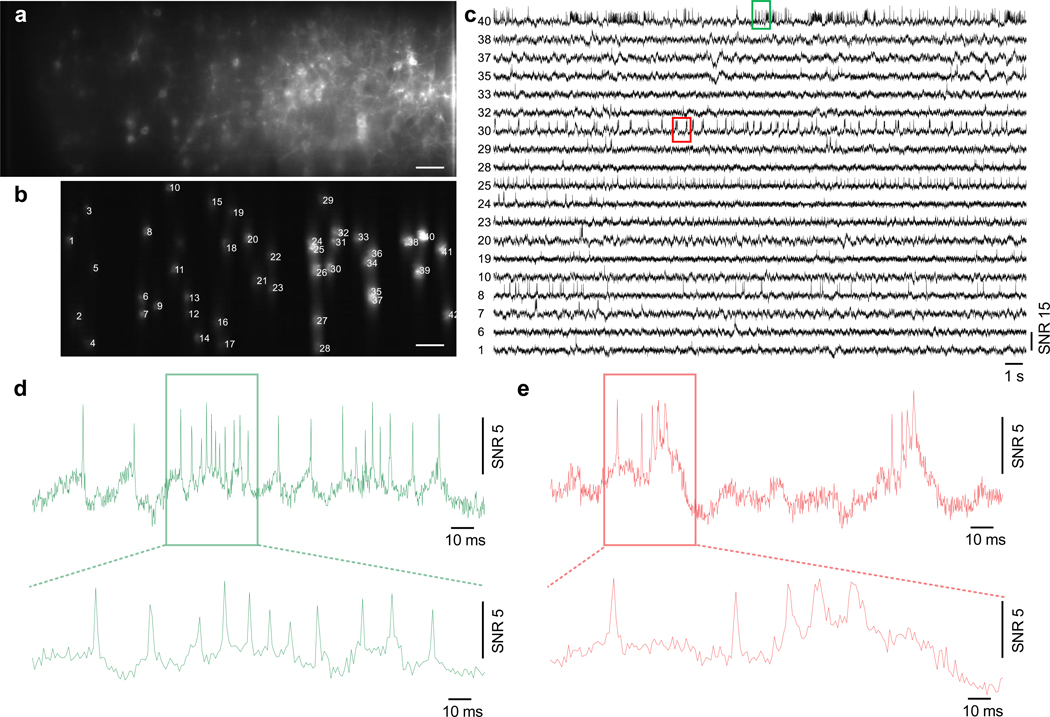
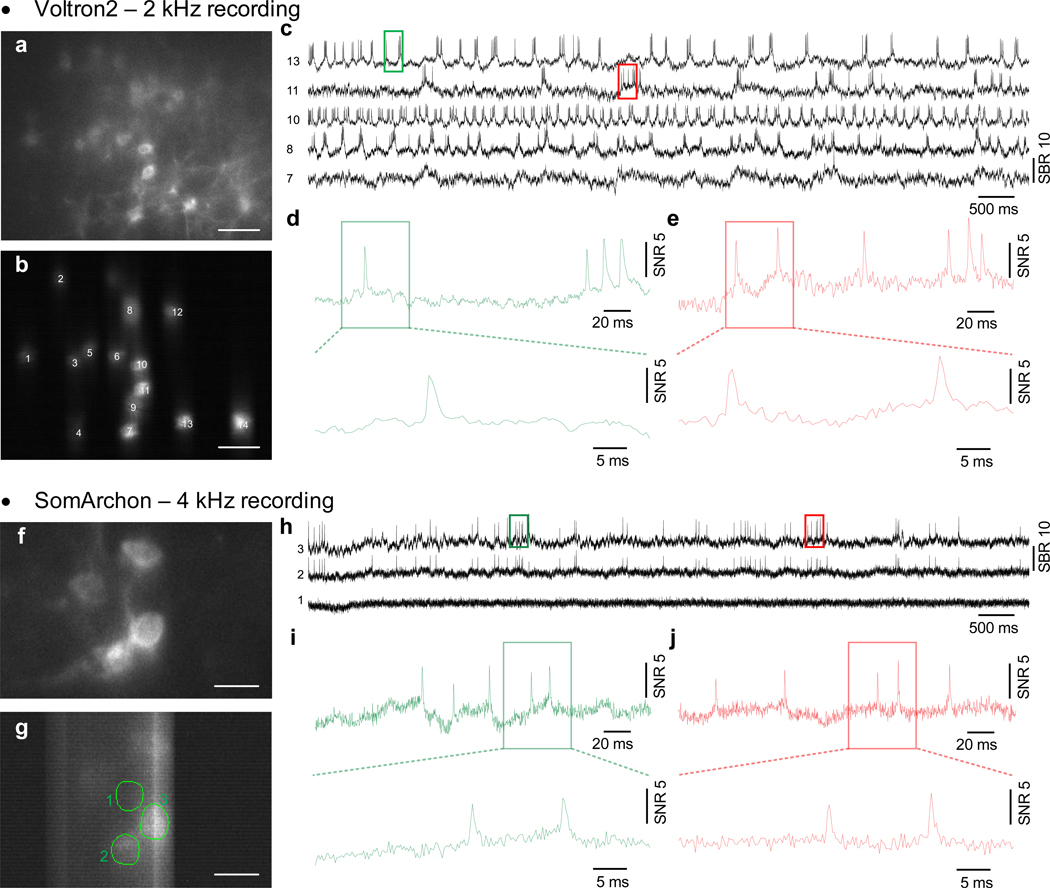
The purpose of combining targeted illumination with confocal gating is to increase the fidelity and duration with which neuronal activity can be monitored and quantified. By imaging Voltron2-expressing neurons using the same laser intensity at the brain surface but different microscope configurations (different confocal slit widths, with or without targeted illumination), we experimentally quantified the advantages of TICO microscopy over standard targeted illumination and confocal microscopy for in vivo voltage imaging. As is apparent from Figs. 1(a–d) and 2(a–d), both the application of targeted illumination and the strength of confocal gating affect spatial image contrast. When combined in TICO microscopy these provide a more than 50×SBR improvement over conventional widefield microscopy (Supplementary Note 2.1, Supplementary Fig. 4, Supplementary Fig. 5). This capacity for background reduction was also reflected in a higher temporal signal contrast, as characterized by associated with individual spikes. With targeted illumination and moderate confocal gating (10 – 20 μm slit width) we were able to obtain an average spike as high as 8 – 10 % even in densely labeled tissue for single-photon imaging of Voltron2 [Fig. 2(e,f)], which had previously only been reported with background-free neuron cultures13. We found TICO microscopy was able to significantly reduce background-induced crosstalk caused by both tissue scattering and out-of-focus neurons (detailed in Supplementary Note 2.2, Supplementary Fig. 6), as is evident from Fig. 2(l–n). While most of our results were obtained with a frame rate of 800 Hz, we were readily able to increase this rate albeit at the cost of FOV. For example, with frame rates 1 kHz, 2 kHz and 4 kHz, we obtained FOVs of 880 × 325 μm (Extended Data Fig. 3), 400 × 325 μm and 60 × 180 μm (Extended Data Fig. 4), respectively.
Figure 2. Quantification of TICO microscope performance for in vivo voltage imaging.
(a-c) Example Voltron2 fluorescence images under targeted illumination with confocal slit width set to 4.5, 22.5, and 156 μm. Scale bar 50 μm.
(d) Voltron2 fluorescence image over the same FOV but acquired without targeted illumination and with a confocal slit width of 156 μm. TI, targeted illumination. Scale bar 50 μm.
(e,h,i) Comparison of spike , spike detection fidelity , and spike SNR measured with targeted illumination and confocal slit widths of 4.5, 11.3, 22.5, and 156 μm (Two-sided Wilcoxon signed rank test; n = 30 cells from 6 FOVs, 2 mice). Box plots: box, 25th (Q1, bottom line) to 75th (Q3, top line) percentiles; whiskers, to , where ; middle line, median (m); notch, from to ; dots, measurement points.
*p < 0.05, **p < 0.01, ***p < 0.001, no label if p ≥ 0.05, pairwise Wilcoxon signed-rank test, see Source Data Fig. 2 for statistics.
(f,g,j) Comparison of spike , photobleaching rate, and spike SNR measured with and without targeted illumination when using a 14 μm confocal slit. Two-sided Wilcoxon signed rank test. For (f,j), n = 20 cells from 5 FOVs, 2 mice. For (g), n = 92 cells from 5 FOVs, 2 mice. Box plots same as (e), see Source Data Fig. 2 for statistics.
(k,l,m) Example images (scale bar, 20 μm) and corresponding fluorescence traces from two neighboring neurons with targeted illumination and confocal slit widths of 4.5, 22.5, and 156 μm (from top to bottom). Gray line, fluorescence traces; red line, extracted subthreshold Vm traces; r, Pearson cross-correlation coefficient between the subthreshold Vm traces from the 2 neurons.
Another important factor for high-fidelity recording is SNR, which we quantified using both the theoretical shot-noise-limited spike detection fidelity (see Supplementary Note 4 and Ref.6) and the experimental spike SNR (defined as spike amplitude over baseline noise, see Methods). As with conventional confocal microscopy1, an optimization of the confocal gating strength is required to achieve optimal SNR, which was attained in our case with a slit width of about 20 μm [Fig. 2(h,i)]. However, this optimum was found to be only weakly peaked and tolerant to a relatively wide range of slit widths, permitting a bias toward slightly stronger confocal gating for reduced crosstalk (Supplementary Note 1.3.1, 2.3). When targeted illumination was added, we observed a large reduction in photobleaching rate of 71.4% [Fig. 2(g)], caused by the reduction in scattering-mediated excitation power received by the targeted neurons [Supplementary Fig. 1(f)]. Despite this large reduction in excitation power (and hence fluorescence), the spike SNR was found to degrade only slightly from 5.66 to 5.13 [Fig. 2(j)], owing to the increased signal collection efficiency and background rejection resulting from the addition of targeted illumination [Supplementary Note 2.3, Supplementary Fig. 7]. That is, TICO microscopy provides a capacity for long-duration imaging by virtue of significantly reduced photobleaching rates that in our case more than counterbalanced the observed small degradation in SNR compared to confocal microscopy alone.
Large-scale voltage imaging with different GEVI classes
State-of-the-art GEVIs can be fully genetically encoded or hybrid, and differ in brightness, photostability, kinetics, voltage sensitivity, and even signal polarity. As shown above, TICO microscopy delivers minimum amounts of excitation power while maintaining high signal contrast and SNR, ensuring compatibility with different GEVI types. Together with the advantage of large FOV, TICO microscopy enables routine large-scale voltage imaging that can be sustained over long durations.
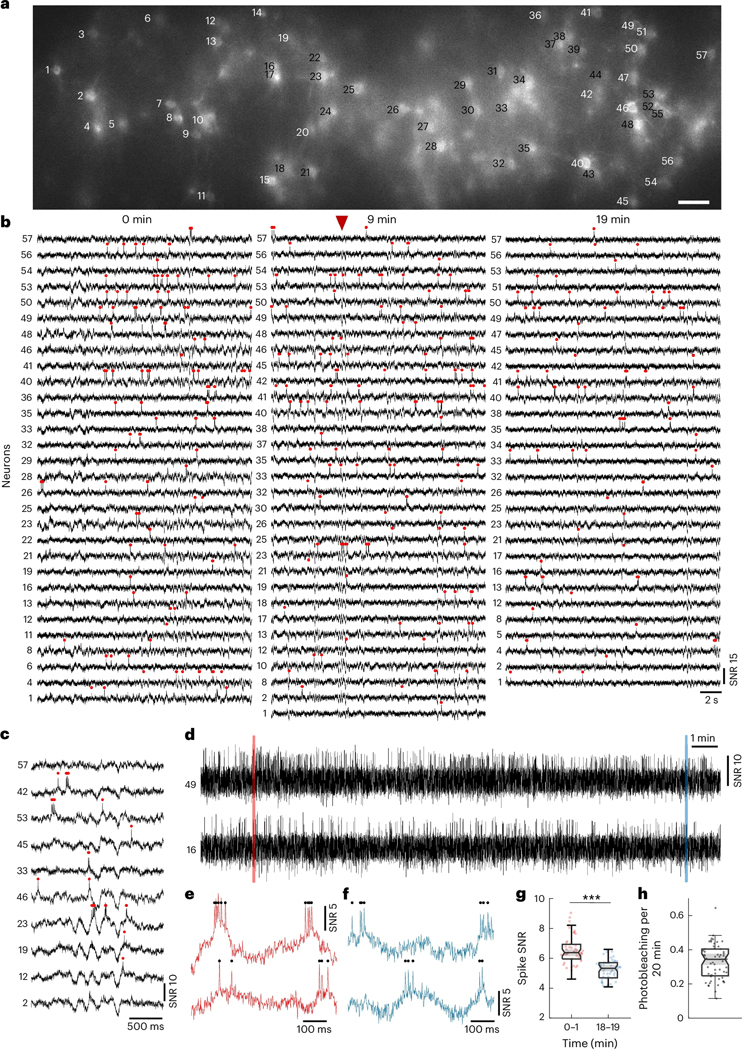
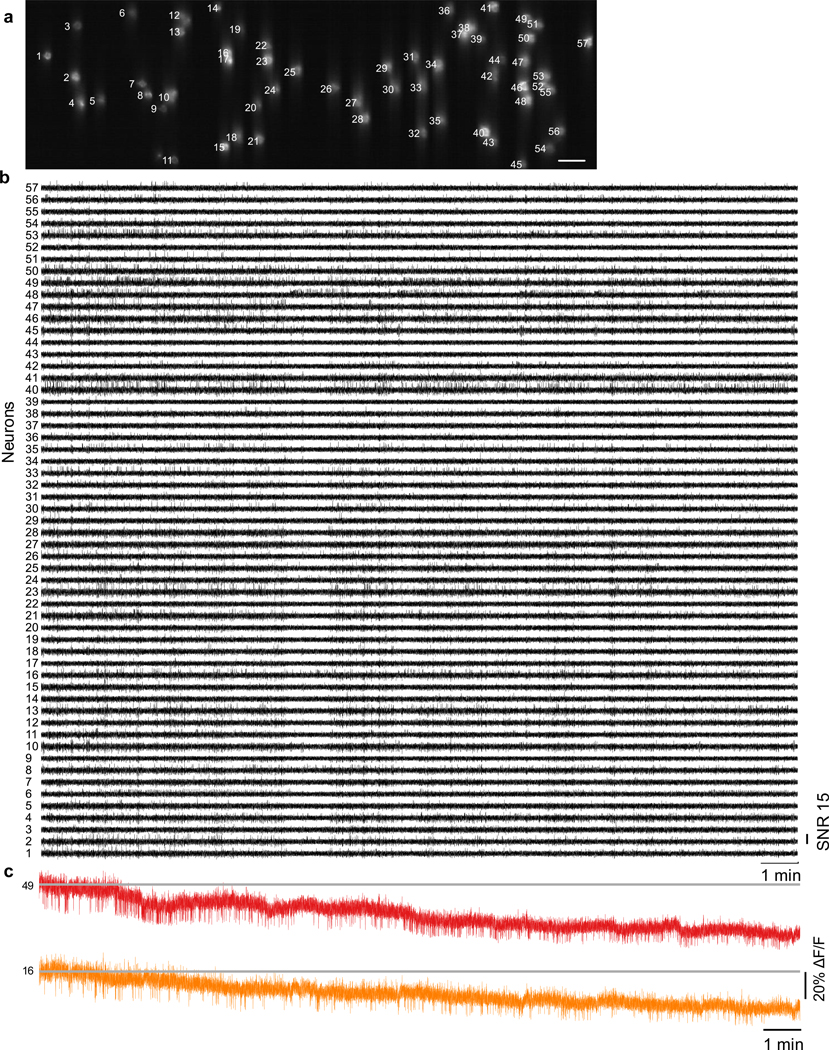
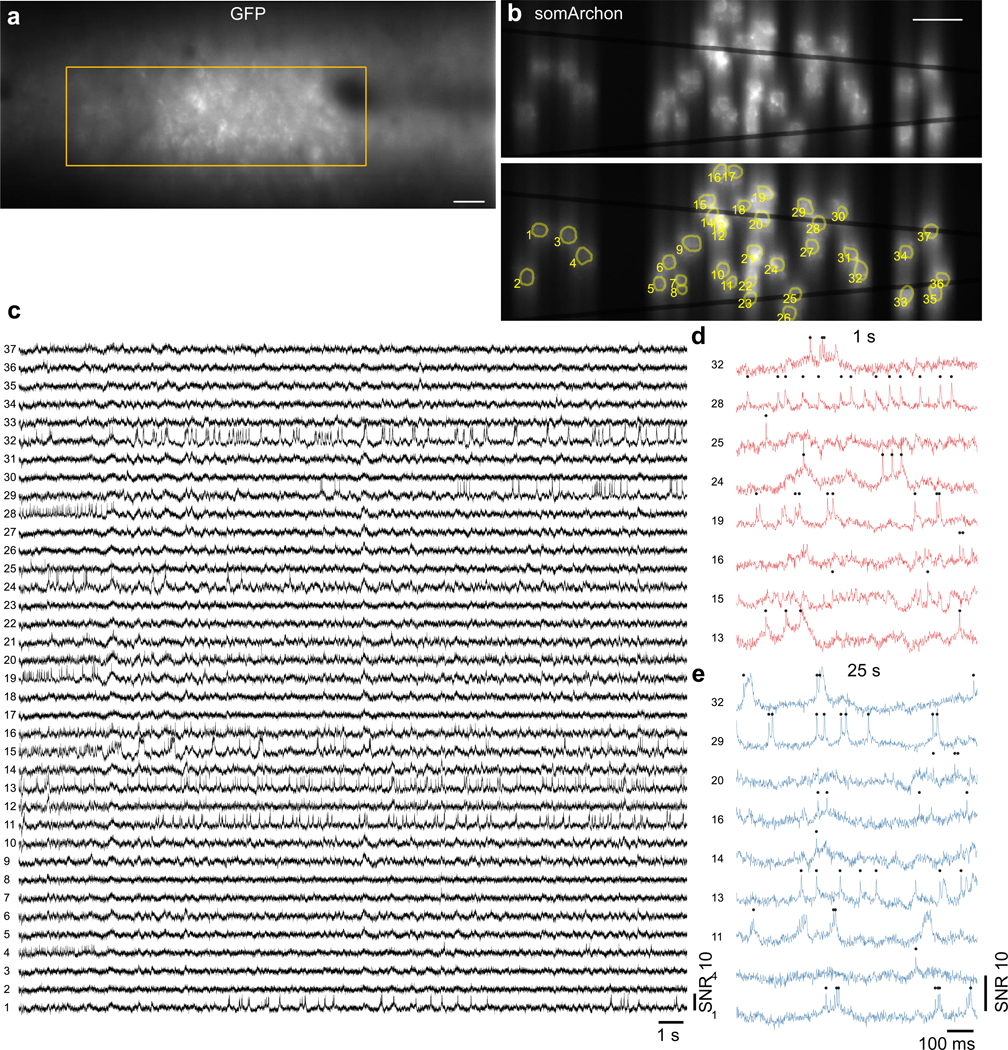
To demonstrate this, we imaged Voltron2-expressing neurons in cortical layer 2 of awake mice. We selected a confocal slit size of 14 μm to balance SNR and crosstalk. Because of this larger slit size, residual background remained visible under confocal microscopy but was largely removed with the addition of targeted illumination [Fig. 3(a), Extended Data Fig. 5a]. With 40 mW/mm2 excitation intensity at the brain surface, we were able to image 57 neurons over a FOV of 1.1 × 0.325 mm2 continuously for 20 minutes (Fig. 3, Extended Data Fig. 5). Individual spikes and Vm depolarizations can be observed throughout the full length of the recording [Fig. 3(d–f)]. The total photobleaching was measured to be 0.34/0.25–0.40 [median/Q1-Q3; Fig. 3(h)] across all imaged neurons, leading to a downward trend in spike SNR from 6.32/5.86–6.80 to 5.24/4.83–5.67 [median/Q1-Q3; Fig. 3(g)]. A similar such demonstration was performed using the fully genetically encoded sensor somArchon, both in superficial layers of cortex and in the hippocampal CA1 region (Extended Data Fig. 6, Supplementary Fig. 14), where we were able to image more than 50 neurons. Benefiting from the large FOV, up to 78 neurons could be imaged simultaneously (Supplementary Fig. 12, Supplementary Fig. 13), demonstrating the ability of TICO microscopy to perform sustained large-scale voltage imaging even in densely labeled tissues.
Figure 3. TICO microscope enables in vivo voltage imaging at large scales over extended durations.
(a) Confocal image of Voltron2 fluorescence over the imaging FOV. Imaging depth 160 ± 20 μm, excitation intensity 40 mW/mm2, scale bar 50 μm. See Extended Data Fig. 5a for the averaged Voltron2 fluorescence image over the same FOV with both confocal and targeted illumination.
(b) Voltron2 fluorescence traces of active cells over 20 s periods starting at 0, 9, and 19 min in the recording. See Extended Data Fig. 5b for the entire 20 min recording of all 57 cells.
(c) Fluorescence traces from selected cells showing partially synchronized subthreshold oscillations. Extracted at the time point indicated by the red arrow in (b).
(d) Example fluorescence traces from 2 selected cells during the entire 20 min recording. See Extended Data Fig. 5c for raw fluorescence traces.
(e,f) Zoomed-in fluorescence traces from the shaded areas labeled in (c).
(g) Comparison of spike SNR during 0–1 and 18–19 min of the recording. Two-sided Wilcoxon signed rank test, *p = 3.13e−10. Box plots same as Fig. 2(e).
(h) Measured photobleaching rate across all 57 imaged cells over the 20 min recording. Box plot same as Fig. 2(e). Median/Q1-Q3, 0.34/0.25 – 0.40.
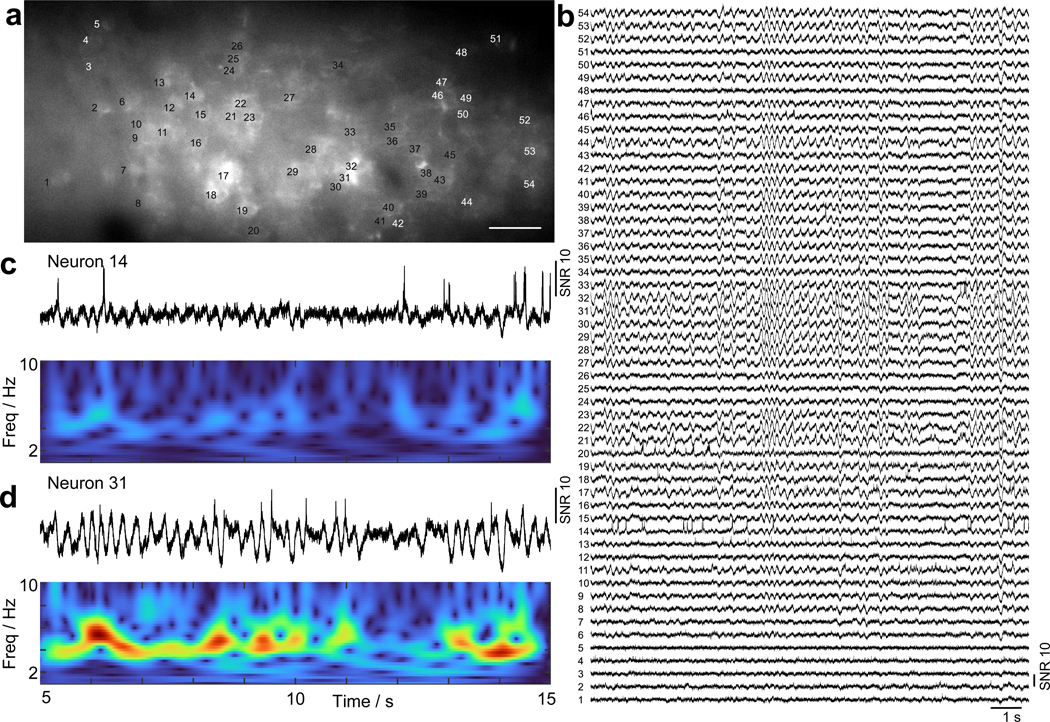
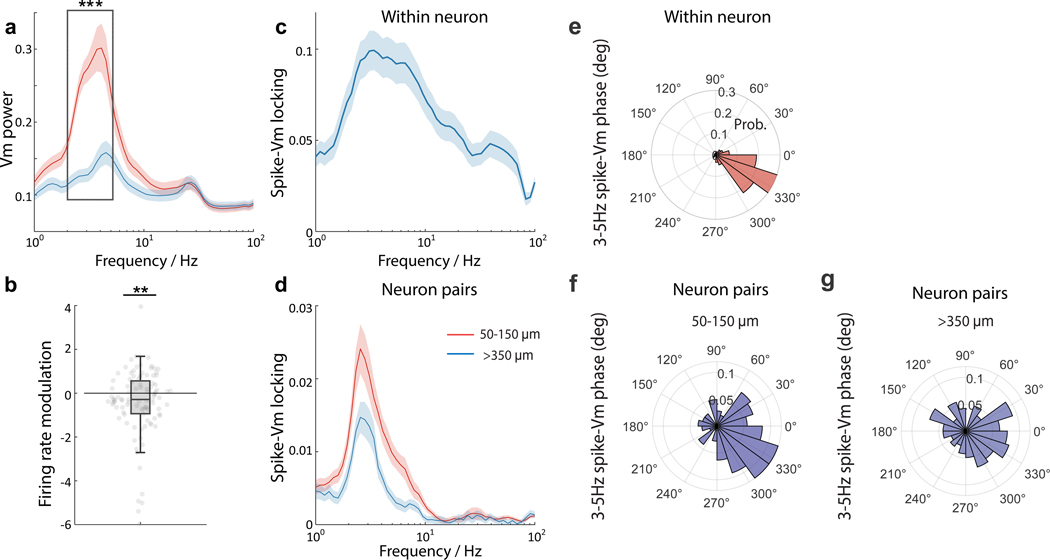
Crucial to voltage imaging is the ability to detect subthreshold membrane potential oscillations. With TICO microscopy we were able to observe these among populations of neurons with high SNR using both Voltron2 and somArchon [Fig. 3(c), Extended Data Fig. 7, Supplementary Fig. 16]. The advantages of high imaging throughput and low crosstalk are further highlighted by the observation of different oscillation patterns across distinct neuronal groups [Fig. 3(c)], as well as individual neurons that did not participate in this coordinated behavior [Extended Data Fig. 7c, Supplementary Fig. 16(e)]. We found that popular functional imaging analysis algorithms31–33 were unable to faithfully extract correlated subthreshold activities because of their reliance on signal independence and non-negativity, especially within densely labeled neuronal populations (Supplementary Fig. 15). We analyzed subthreshold activities from one of our experimental animals, showing a 3 −5 Hz central oscillation frequency, an association with hyperpolarization and reduced spike rates, and phase-locked spike timing to the oscillation cycles (Extended Data Fig. 8). Similar 3 – 5 Hz membrane oscillations have previously been observed from neurons in cortical layer 2–634–36, though mostly restricted to intracellular recordings of single neurons. Here, the high degree of temporal coordination of L1 membrane oscillations is in line with the proposed origin of thalamic axonal innervations37,38, although further study is required to elucidate its actual mechanism.
Deep tissue voltage imaging
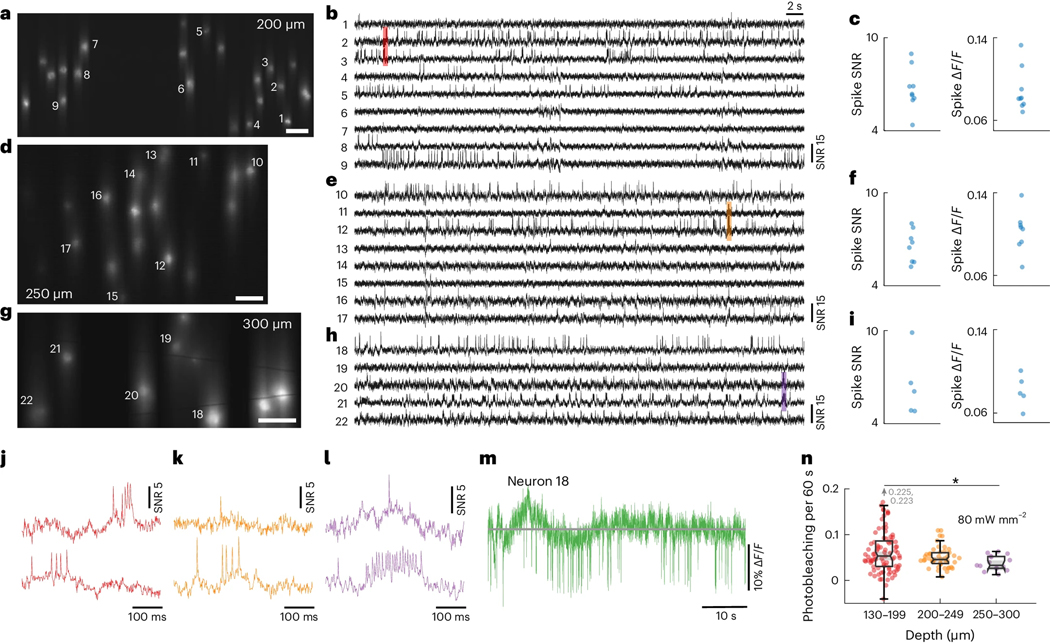
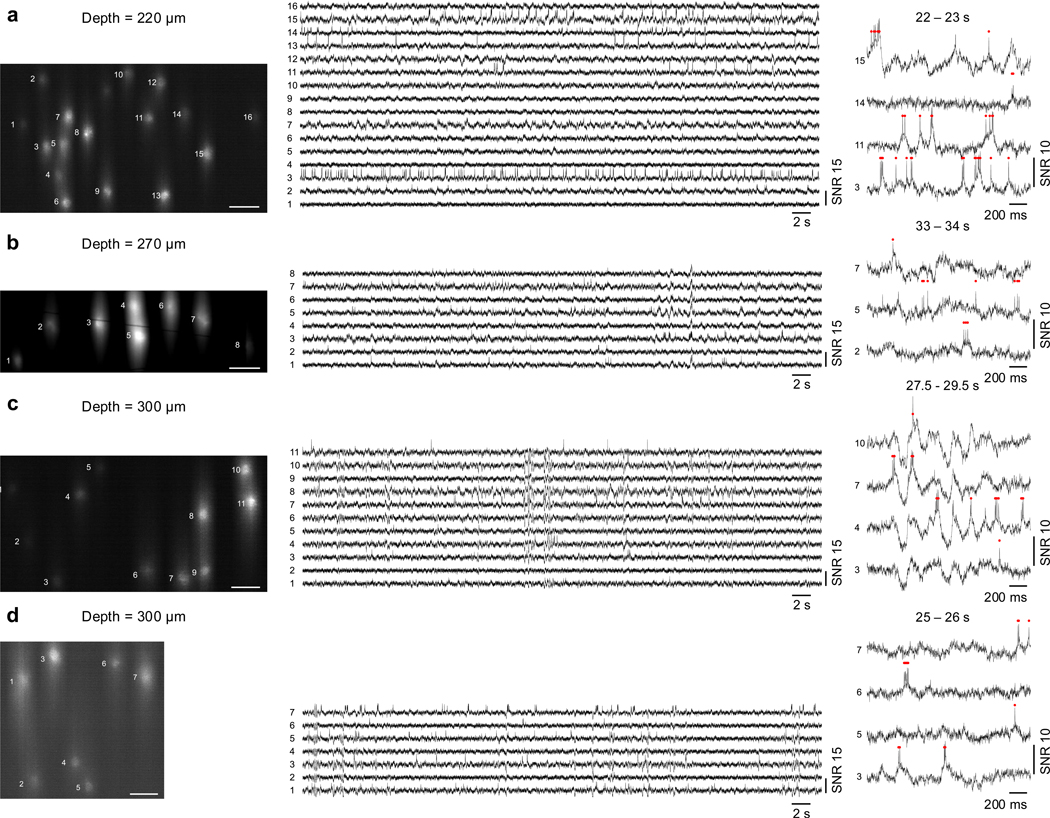
Microscopes based on single-photon excitation provide only limited depth penetration in thick tissue because of scattering and out-of-focus background. In the case of voltage imaging, reported depth penetrations so far have been limited to typically 100 – 150 μm7,9,11,17,39. Here, with the combined benefits of targeted illumination and confocal gating, we could extend this penetration depth to 300 μm, providing access even to cortical layer 3. The main challenge stems from the increased light scattering that comes with increased imaging depth, rendering both background reduction mechanisms less effective. Regarding targeted illumination, tissue scattering blurs the excitation patterns such that they become less confined to the target neurons. As a result, reduced excitation power is incident on the targets [Fig. 4(n), Supplementary Fig. 1(f)], which we compensate for by increasing the excitation intensity up to 80 – 150 mW/mm2 when imaging deep in tissue. Tissue scattering also blurs the emission signals, prescribing a larger confocal slit size to maintain optimized SNR, as predicted by theory [Supplementary Fig. 2(h)]. In practice, we adopted a larger slit size of 23 μm when imaging deep in tissue. Because of the resultant increase in overall background fluorescence compared to in-focus signal, we intentionally sought to image more sparsely labeled brain regions where the SBR was naturally higher: the median SBRs across two typical FOVs at depths of 160 μm and 300 μm was 0.055 and 0.073 respectively when imaged without targeted illumination with a 156 μm confocal slit (Supplementary Fig. 5). Note that for these experiments we did not specifically perform sparse labeling but rather used the same mice as above, targeting regions away from the viral injection sites where Voltron2-expressing neurons tended to be more sparsely distributed and approached cortical layer 4. Ultimately, with Voltron2 we were able to routinely image populations of neurons at depths exceeding 200 μm (Fig. 4, Extended Data Fig. 9; n = 12 FOVs from 3 mice), and up to 300 μm [Fig. 4(g,h,i), Extended Data Fig. 9(c,d)]. Across all of our trials, the measured spike SNR and were 6.02/5.48–6.87 and 9.93%/7.61% - 11.76% (median/Q1-Q3; 61 active neurons out of 138 total neurons, 12 FOVs), comparable to our imaging results from more superficial layers.
Figure 4. TICO microscope enables high SNR voltage imaging at 300 μm depth.
(a-i) Example Voltron2 fluorescence images (a,d,g), voltage traces of spiking neurons (b,e,h), and average spike SNR,
(c,f,i) at increasing imaging depths of 200 μm (a-c), 250 μm (d-f), and 300 μm (g-i) below the brain surface. Median spike SNR and are 6.37/0.081, 6.63/0.105, 6.08/0.078 for the active neurons shown in (b,e,h), respectively. See Supplementary Table 3 for a list of imaging parameters. Scale bars in (a,d,g) are 50 μm.
(j-l) Zoomed-in fluorescence traces from the shaded regions in (b,e,h).
(m) Raw fluorescence trace (non-inverted) of neuron 18 over the 1 min recording.
(n) Comparison of photobleaching rate measured at different imaging depths. Excitation power density at the brain surface was kept constant at 80 mW/mm2. The reduction in photobleaching rate with increasing imaging depth is caused by the reduction in excitation power received by the targeted neurons due to tissue scattering. Box plot same as Fig. 2(e). Wilcoxon rank sum test, p = 2.21e−1 for 130 − 199 vs. 200 − 249, p = 8.60e−2 for 130 − 199 vs. 250 − 300, p = 3.86e−2 for 200 − 249 vs. 250 − 300.
When using somArchon, we found deep tissue imaging to be more difficult because of both a higher labeling density and an increased amount of tissue autofluorescence. The maximum imaging depth we were able to achieve was 230 μm (Fig. Supplementary Fig. 18). Deeper tissue voltage imaging with fully genetically encoded voltage indicators may be possible with the use of more recently developed sensors11,12 with better reported performances.
Simultaneous imaging across multiple cortical layers
Many deep brain regions such as the dorsal striatum and hippocampus are located well below the penetration depth limit of single- or even multi-photon microscopes40. To access these regions, a widely adopted strategy involves introducing tissue penetrating imaging conduits such as cannula41, gradient-index lenses42 or microprisms43. Our TICO microscope is entirely compatible with the use of such conduits, providing cellular resolution voltage imaging in densely labeled tissue in the hippocampus CA1 region (Supplementary Fig. 14) and deep cortical layer 5 (Supplementary Fig. 19).
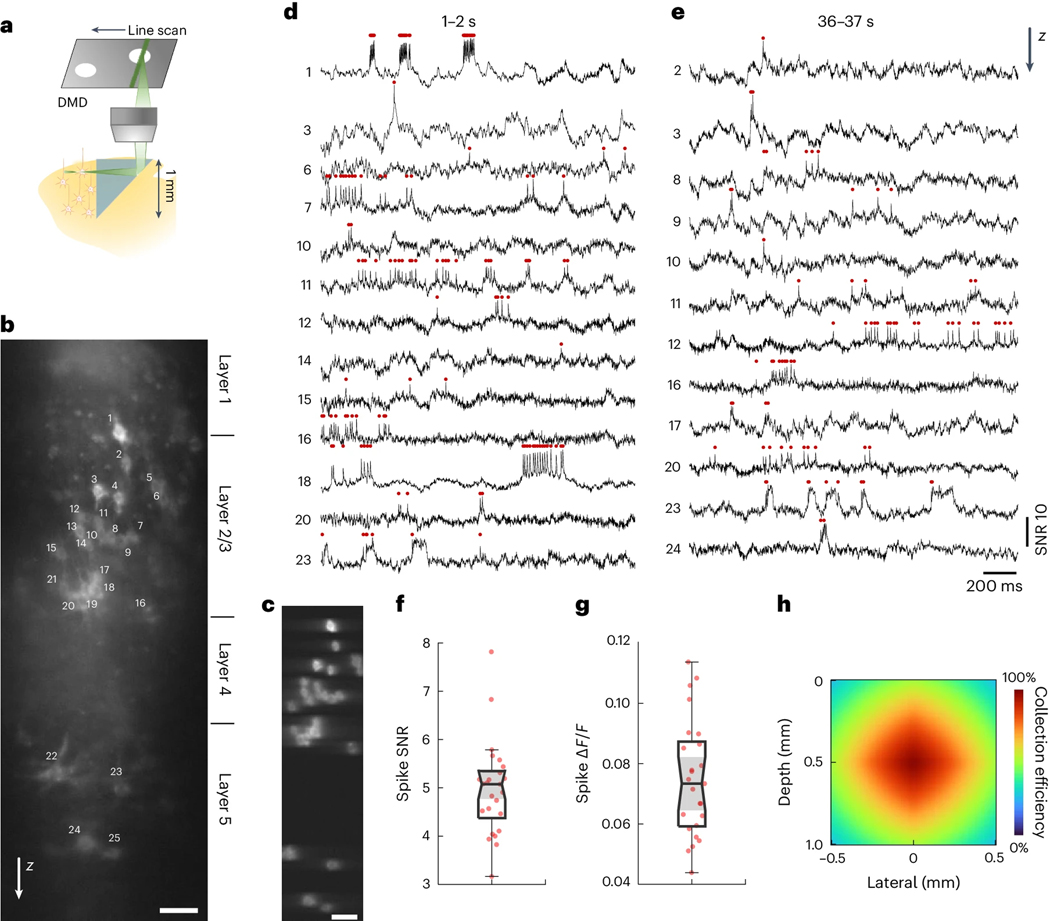
A unique advantage of using an implanted microprism conduit is that it provides a side-on view of the brain. When coupled with a large imaging FOV, neural activity from an extended depth range can be recorded simultaneously. This is particularly important in brain regions such as neocortex, which is organized into multiple layers of distinct cell types and connectivity44. We injected Voltron2 virus at around 200 and 600 μm depth in the somatosensory mouse cortex, and implanted a right-angle prism of 1 × 1 mm2 facet size. Using TICO microscopy, we could simultaneously image over a vertical FOV of ~800 μm spanning cortical layers 1 to 5 [Fig. 5(b,c)], almost the entire cortex. Distinct firing patterns were observed at different layers: while neurons in layer 2/3 (neuron # 2–20) mostly produced single, isolated spikes, 3 out of the 4 layer 5 neurons (neuron # 22–24) tended to produce more bursting events with substantial after-depolarizations [Fig. 5(d,e), Extended Data Fig. 10]. We note that owing to geometric constraints, the fluorescence collection efficiency was somewhat compromised when imaging away from the center of the microprism facet [Fig. 5(h)]. These constraints could be alleviated by using higher index glass, rectangular facet microprisms, or gradient-index lenses. Nevertheless, clear spike and subthreshold activity remained apparent even toward the top and bottom of the FOV, with a spike SNR of 5.07/4.37–5.34, and spike of 0.073/0.059 – 0.087 (median/Q1-Q3) across all imaged neurons [Fig. 5(f,g)].
Figure 5. Side-on voltage imaging across multiple cortical layers with an implanted microprism.
(a) Schematic illustration of side-on cortical imaging with an implanted microprism.
(b) Side-on confocal image of Voltron2 fluorescence, demonstrating simultaneous view of neurons across cortical layers 1–5. Scale bar, 50 μm. Image gamma adjusted (γ = 0.3) to highlight weaker neurons.
(c) Averaged Voltron2 fluorescence image with 25 neurons targeted within the FOV. Scale bar, 50 μm. Image gamma adjusted (γ = 0.5) to highlight weaker neurons.
(d,e) Voltron2 fluorescence traces for all active neurons during 1–2 s and 36–37 s of the recording. See Extended Data Fig. 10 for the complete 45 s recording of all 25 neurons.
(f,g) Spike SNR and spike during the recording (n = 25 neurons from 1 mouse).
(h) Fluorescence collection efficiency (0.8 objective NA) when imaging through a microprism .
Discussion
TICO microscopy significantly improves upon targeted illumination or confocal microscopy in many aspects. Compared to confocal microscopy alone19, we are able to increase both fluorescence detection efficiency and imaging FOV by more than an order of magnitude using a combination of system designs including decoupled excitation/detection paths, a wedge prism for DMD tilt correction, and an adaptive confocal slit size that increases with deeper imaging. The addition of targeted illumination effectively compensates for the weaker confocal gating that comes with larger slit sizes, while also reducing the delivered excitation power and thus reducing photobleaching, enabling better compatibility with fully genetically encoded sensors. Compared to targeted illumination microscopy alone7,9,13, a key advantage of adding confocal gating is to reduce crosstalk, enabling higher fidelity voltage imaging of large numbers of neurons. Improved SBR also facilitates the initial selection of in-focus neurons that can be difficult to distinguish from background when using widefield microscopy. As a point of clarification, when comparing the effects of confocal gating strength, we were unable to remove the gating completely due to a limitation in the maximum confocal slit size of 156 μm. And yet, as shown in Supplementary Fig. 4, even this open slit led to at least 5.1× increase in SBR compared to a fully widefield microscope, allowing finer structures like proximal dendrites to become more easily identifiable. This suggests that the gains in SBR and SNR reported here are likely larger when compared to a fully widefield (no slit) targeted illumination microscope.
Another important metric when evaluating microscope performance is depth penetration, where 2PM is the most popular tool for deep imaging in scattering tissue. However, 2PM voltage imaging is limited by the requirement of exponentially increasing excitation power with depth and the moderate voltage sensitivity of currently available GEVIs, and to date has enabled only a few neurons to be imaged simultaneously14,20,21 at depths greater than 200 μm. In contrast, TICO microscopy is based on linear excitation which requires much lower laser power and benefits from the availability of better performing GEVIs, allowing such depths to be accessed routinely. Our results show that TICO microscopy, when applied to voltage imaging, can attain imaging depths roughly on par with 2PM while providing access to larger FOVs and better GEVI performance. As for deeper structures still, TICO microscopy is fully compatible with the use of optical conduits, potentially allowing voltage imaging at depths of several millimeters.
We mostly focused on demonstrating large FOV imaging with 800 Hz frame rates since this was sufficient for identifying individual spikes. This rate could be increased to a few kilohertz (Extended Data Fig. 4), limited by the speed of our galvanometric scanners, though at the cost of decreased FOV. Still faster rates could be envisioned with the use of resonant or polygonal scanners, provided the camera speed is sufficient. Alternatively, large FOVs are readily attainable when ultrafast imaging is not required. For example, TICO microscopy could be applied to other fluorescent sensors such as jGCaMP845 or iGluSnFR46, which, while fast, are not as fast as GEVIs and can be imaged at reduced imaging speeds of about 100 Hz. Yet another potential enhancement of TICO microscopy is kilohertz-rate volumetric imaging, which could be achieved by combining a high-speed remote focusing mechanism (for example, a deformable mirror47) with depth-dependent dynamic targeted illumination48.
In summary, TICO microscopy is a practical and versatile solution for single-photon fluorescence imaging that can be adapted to a wide range of samples and imaging conditions. It provides the combination of low crosstalk and high SNR, while at the same time allowing large imaging FOVs, kilohertz acquisition speeds, low photobleaching rates, and large penetration depths, making it particularly suitable for general large-scale in vivo voltage imaging applications.
Methods
Imaging setup
TICO microscope
A detailed schematic of our TICO microscope setup is shown in Extended Data Fig. 1d, with all components listed in Supplementary Table 2. In brief, the system was based on a line scan confocal microscope, where a line focus was imaged into the sample by way a series of relay lenses () and an objective (Nikon 16×/0.8NA LWD). The line focus was scanned across the FOV by a galvanometric scanner (Galvo 1, ScannerMAX Saturn-5) placed in a plane conjugate to the objective back aperture. The generated fluorescence was epi-collected by the same objective, descanned by the same galvanometric scanner, and focused onto a stationary slit (Thorlabs VA100) that rejects out-of-focus fluorescence. The slit was then re-imaged onto an sCMOS camera (Teledyne Photometric Kinetix) by a pair of relay lenses (), and a second galvanometric scanner (Galvo 2, ScannerMAX Saturn-5) placed at the pupil plane re-scans the slit to form a 2D image on the camera. A combination of excitation filter, emission filter and dichromatic mirrors (Chroma Technology Corp., 89901v2 405/488/561/640nm Laser Quad Band Set) were used to separate fluorescence from the excitation light.
Different from a conventional line-scan confocal microscope is the addition of a DMD-based targeted illumination module, which was inserted between the scan lens and the objective. To maximize collection efficiency, we avoided de-scanning the fluorescence through the DMD by separating the emission from the excitation light paths using two dichromatic mirrors (Chroma Technology ZT405/488/561/640rpcv2). That is, the DMD (Vialux V-7000 VIS, 0.94 μm pixel size at the objective space) was present only in the excitation path to pattern the illumination beam. Specifically in the excitation path, the line focus was imaged and scanned across the DMD surface by a series of relay lenses () and a galvanometric scanner (Galvo 1), which was then imaged into the sample by a tube lens and the objective. The DMD was placed in the Littrow configuration and its surface tilt was corrected by a wedge prism (Edmund Optics # 49–443) inserted before it. A polarizing beamsplitter (PBS, Thorlabs WPBS254-VIS) and quarter-wave plate (, Thorlabs AQWP10M-580) were used to separate incident and reflected light from the DMD. An additional emission filter (Em2, Chroma Technology ZET405/488/561/640mv2) was placed in the emission path to block unpatterned excitation light transmitted through DM2.
We configured our microscope to feature three different excitation lasers. A 561 nm laser (Oxxius LCX-561L-200-CBS-PPA; 200 mW output power) was used for Voltron2 imaging. Its output was shaped into a line by a Powell Lens (Laserline Optics Canada, LOCP-8.9R10–1.0) and a cylindrical lens (). Three additional cylindrical lenses () were used to further narrow the laser line focus. A 637 nm diode laser bar (Ushio America Inc., Red-HP-63X; 20 output beams, 6 W total output power) was used for somArchon imaging. Its output was collimated by a built-in fast- and slow-axis collimating lens, and two cylindrical lenses () were added to shape the output into a focused line. A 488 nm laser (Lasertack GmbH PD-01376) was used for GFP imaging, and three cylindrical lenses () were used to create a line focus. The outputs of the three lasers were combined using two dichromatic mirrors (DM4, Thorlabs DMSP550R; DM5, Thorlabs DMLP605R), and coupled into the microscope using a quadband dichromatic mirror (DM1, Chroma Technology Corp. ZT405/488/561/640rpcv2). Three half-wave plates () were placed at the output of each laser to rotate their beam polarizations such that the beams were reflected by the PBS towards the DMD in the excitation path.
Custom widefield microscope
A custom-built widefield epi-fluorescence microscope was used to compare spatial image contrast between standard widefield imaging and TICO microscopy with the largest slit width (156 μm) and without targeting. A 565 nm LED (Thorlabs M565L3) was collimated (Thorlabs ACL25416U-A), bandpass filtered (Chroma Technology Corp., ET560/40), and focused into the sample by way of an objective (Nikon 16×/0.8NA LWD). The generated fluorescence was collected by the same objective, separated from the excitation light using a dichromatic mirror (Chroma Technology Corp. T590lpxr), long-pass filtered (Chroma Technology Corp. ET590lp) and finally focused onto a sCMOS camera (Hamamatsu ORCA-Flash 4.0 V3) with a tube lens. Image acquisition was performed using HCImageLive software.
Animal surgery
All animal procedures and experiments were carried out with approval from the Boston University Institutional Animal Care and Use Committee and in accordance with National Institutes of Health policies and guidelines. C57BL/6J mice (Jackson Laboratory #000664), CAG-Sun1/sfGFP mice (Jackson Laboratory #021039), NDNF-ires-Cre mice (Jackson Laboratory #030757), PV-ires-Cre mice (Jackson Laboratory #017320), Ai14 mice (Jackson Laboratory #007914), both male and female, were used in this study.
Voltron2 mouse with crystal skull window
Both C57BL/6J and CAG-Sun1/sfGFP were used for Voltron2 cortical imaging. To allow optical access to the brain while minimizing damage, we followed methods similar to those described in Ref.49 for crystal skull preparation. Specifically, anesthesia was induced using 5% isoflurane in O2 and was maintained during surgical procedures using 1–2% isoflurane in O2. Bupivacaine (0.1 ml, 0.5%) was injected under the skin covering the skull. The skin and periosteum covering the skull were removed and the skull removed overlying the sites of interest. Virus was injected using a manual volume displacement injector (Narishige International USA, MMO-220A) connected to a glass pipette (Drummond Scientific, 5–000-2005) pulled to a 30 μm tip (Sutter Instrument, P-2000) that was beveled to a sharp tip. Pipettes were backfilled with mineral oil and virus was front-loaded before injection. Pipettes were inserted to the appropriate depth after the skull was removed.
Animals were unilaterally injected with a 1:12 dilution of AAV1-hSyn-FLEX-Voltron2-ST-WPRE virus in primary motor and primary somatosensory areas (coordinates in mm from Bregma: AP −0.5, ML +/− 1.2, DV −0.3). Cortical injections to adult C57BL/6J mice additionally included a 1:300 dilution of rAAVretro-hSyn-Cre (Addgene #105553-AAVrg) to induce expression of Voltron2-ST and a 1:150 dilution of AAV9-hSyn-Cheriff-EGFP (Addgene plasmid #51697, custom viral preparation from The Penn Vector Core). Total injection volume at each target site was 50 nL. Following virus injection, the exposed area was then covered with modified crystal skull cover glass (LabMaker) and sealed with dental acrylic. To facilitate head fixation during imaging, we utilized a custom ring-shaped titanium head bar that was attached to the remaining cranial bone using low-viscosity cyanoacrylate adhesive (Loctite 4014) and dental acrylic. Mice were administered post-operative sub-cutaneous injections of ketoprofen (5 mg/kg) and buprenorphine (0.1 mg/kg) in saline for pain management. Viruses were allowed to express for 3 weeks before imaging was performed.
Voltron2 mouse with implanted microprism
C57BL/6J mice were used for Voltron2 cortical imaging via an implanted microprism. The surgical procedure to implant the glass microprism into the cortex was performed similarly to cranial window implant protocol detailed in Ref.50. Briefly, the animal was anesthetized and given pre-operative cefazolin and buprenorphine for pain management. The depilated scalp was resected to expose the entirety of the dorsal skull. A headbar was attached to the skull approximately over the lambda suture using cyanoacrylate glue (Loctite 4014) and dental acrylic, and the skin margins were secured to the outer edges of the skull using glue. A ~3.5 mm diameter craniotomy was made over somatosensory cortex to accommodate the microprism assembly. A small lip was carved into the skull to allow the assembly cover glass to sit flush with the skull surface while resting on a thin layer of bone. The assembly was made by gluing a 1.0 mm glass microprism (hypotenuse coated with enhanced aluminum; Tower Optical MPCH-1.0) to a 3.5 mm diameter round coverglass using optical glue (Norland Products NOA61). Before implanting the assembly, 100 nL of AAV1-hSyn-FLEX-Voltron2-ST-WPRE mixed with 1:50 retroAAV-hSyn-Cre was injected into 3 sites across the craniotomy, at approximately 200 μm and 600 μm depths at each injection site. Virus was allowed to settle for approximately 15 minutes after each injection. A straight-line incision into the cortex was made using a micro scalpel blade mounted to the stereotaxic manipulator. The scalpel was inserted into the cortex first to a depth of 200 μm, and then translated in a straight line across ~1.0 mm of cortex. The scalpel was removed and then reinserted at the start position of the incision to a depth of 400 μm and a 1.0 mm incision was made again. This process was repeated at 750 μm and 1000 μm. The assembly was then positioned by slowly pressing the microprism edge into the incised cortex until the cover glass sat flush with the skull surface. A plastic pipette tip was attached to the stereotaxic manipulator and used to maintain downward pressure on the assembly while the brain tissue settled around the implanted prism. The edges of the cover glass were secured to the skull using cyanoacrylate glue, and the entire skull cap was then covered with dental acrylic while ensuring that the cover glass remained exposed. Animals were given post-operative buprenorphine and ketoprofen for 2 days following the surgery and carefully monitored for 3 days after the procedure to ensure full recovery. Imaging was performed after 4 weeks following implantation.
SomArchon mouse with cortical window
C57BL/6J, NDNF-ires-Cre, PV-ires-Cre, and Ai14 mice were used for somArchon cortical imaging. The surgical procedure for implanting an imaging window and a head-plate is detailed in Ref.8. The imaging window consisted of a circular coverslip (#0, outer diameter 3mm, Deckgläser Cover Glasses, Warner Instruments 64–0726). Virus injection and imaging window placement were performed under 1–3% isoflurane anesthesia, with sustained buprenorphine administered preoperatively to provide continued analgesia for 72 hours (buprenorphine hydrochloride, 0.03 mg/kg, i.m.; Reckitt Benckiser Healthcare). A craniotomy ~3 mm in diameter was made near the right visual cortex (AP: −2.8 mm, ML: 2.5 mm) or motor cortex (AP: 1.75 mm, ML:1.75 mm). Viruses were infused with a blunt 36-gauge stainless steel needle (World Precision Instruments NF36BL-2) connected to a microliter injection system (10 μL, World Precision Instruments), attached to a stereotactic holding arm and controlled by a microinjector pump (World Precision Instruments UltraMicroPump). Viral vectors were injected in 2–6 different locations across the craniotomy, with the needle terminating 180–250 μm below the dura. C57BL/6J mice were infused with 400 nL of AAV8-CaMKII-SomArchon-GFP (titer: 3.2 × 10¹² GC/ml). PV-ires-Cre and Ai14 mice were infused with 400 nL of AAV9-Synapsin-SomArchon-GFP (titer: 5.42 × 10¹² GC/ml). For NDNF-ires-Cre mice, 300 nL of AAV9-Syn-FLEX-SomArchon-GFP (titer: 1.28 × 10¹³ GC/mL) was diluted 1:10 using a sterile saline solution and then infused at a rate of 50 nL/min. To facilitate AAV spread, the infusion cannula was left in place for 5–10 min post-infusion. The imaging glass window (#0, outer diameter 3 mm, Deckglaser Cover Glasses, Warner Instruments 64–0726) was then positioned in the craniotomy, with surgical silicone adhesive (World Precision Instruments Kwik-Sil) or ultraviolet curable cement (Tetric EvoFlow; Ivoclar) to hold the edges of the imaging window in place. Metabond Quick Adhesive Cement System (Parkell Inc. S380) was used to cover any exposed skull. Dental cement (Stoelting Co.) was then gently applied to affix the imaging window and a custom aluminum headbar posterior to the imaging window.
SomArchon mouse with implanted hippocampal cannula
C57BL/6J mice were used for somArchon hippocampal imaging. Animals underwent one surgery including stereotaxic viral injection targeting the hippocampus and implantation of a sterilized custom imaging cannula (outer diameter: 3.17 mm, inner diameter: 2.36 mm, height: 2 mm). The imaging cannula was fitted with a circular coverslip (size 0, outer diameter: 3 mm; Warner Instruments D263), adhered to the bottom using a UV-curable optical adhesive (Norland Products NOA60). During surgery, an approximately 3 mm circle was outlined on the skull (centered at anterior/posterior: −2.0mm, medial/lateral: +1.8mm). Three injections of 200 nL AAV9-CaMKII-SomArchon-GFP virus, obtained from University of North Carolina Vector Core (titer 3.2 × 10¹² GC/mL), were made within this circle. Injections were performed with a blunt 33-gauge stainless steel needle (World Precision Instruments NF33BL-2) and a 10 μL microinjection syringe (World Precision Instruments NanoFil), using a microinjector pump (World Precision Instruments UMP3 UltraMicroPump). The needle was lowered over 1 min and remained in place for 30 sec before infusion. The rate of infusion was 50 nL/min. After each infusion, the needle remained in place for 7 min before being withdrawn over 1 min. After injections, an approximately 3 mm craniotomy was created using the outlined circle created previously. The cortical tissue overlaying the hippocampus was aspirated away to expose the corpus callosum. The corpus callosum was then thinned until the underlying CA1 became visible. The imaging cannula was then tightly fit over the hippocampus and sealed in place using a surgical silicone adhesive (World Precision Instruments Kwik-Sil). The imaging window was secured in place using bone adhesive (C&B Metabond Parkell) and dental cement (Stoelting Co.). A custom aluminum headplate was also affixed to the skull anterior to the imaging window. Analgesic was provided for at least 48 hours after each surgery, and mice were single-housed after window implantation surgery to prevent damage to the headplate and imaging window.
In vivo imaging
All videos were acquired using Teledyne Photometrics PVCAM software and recorded in RAW format for postprocessing. During the acquisition, the camera was freely running at a preset frame rate in either “sensitivity” or “speed” mode. The output trigger from the camera was used to synchronize the galvanometer scanning with a multifunctional DAQ card (National Instrument USB-6343), which produced a smoothed triangular wave defined as that controlled the line scan position ( is the scan amplitude, is the smoothing factor, is the camera frame rate, is time). The DMD was controlled using a custom Matlab script based on Vialux ALP-4.2 API.
SomArchon mouse imaging
Before imaging, mice were head-fixed under the microscope objective while allowed to freely run on a floating Styrofoam ball. Because GFP and somArchon were co-localized at the soma, imaging areas were identified using GFP fluorescence under 488 nm laser excitation, ~14 μm confocal slit size, and no targeted illumination. Based on the confocal GFP fluorescence image, small rectangular ROIs encompassing the cell bodies were manually drawn for the in-focus neurons. This created a binary mask that was uploaded to the DMD for excitation light patterning. SomArchon voltage imaging was performed using the 637 nm laser according to the parameters listed in Supplementary Table 3.
Voltron2 mouse imaging
Prior to imaging, a retro-orbital injection was performed to deliver 100 μL of solution containing 20 μL of Pluronic F-127 (20% w/v; Sigma Aldrich), 20 μL of DMSO, and 100 nmol of Janelia Fluor 552 dye in sterile PBS.
Imaging was performed 1–3 days after the dye injection. During the imaging sessions, mice were awake, head-fixed under the microscope objective while constrained within a 1-inch acrylic tube. Before acquisition, imaging areas were identified using Voltron2 fluorescence with laser power attenuated using a reflective neutral density filter (Thorlabs ND20A, 1% transmission) to avoid photobleaching. For each imaging area, a confocal image acquired without targeted illumination was used as a reference to select illumination targets as described previously. After removing the neural density filter, Voltron2 voltage imaging was performed using the same 561 nm laser according to the parameters listed in Supplementary Table 3.
For comparisons of imaging performance using different microscope configurations (Fig. 2), we imaged the same neurons under each configuration by interleaving 10 s long trials. For each FOV, each configuration was imaged for a total of 30 – 40 s over 3–4 individual trials. Imaging depths ranged from 130 to 200 μm. To estimate photobleaching in Fig. 2(g) and Fig. 4(n), the trials were extended to 60 s but only imaged once per FOV. This produced more photobleaching, allowing increased measurement accuracy. The excitation intensity at the brain surface was kept at 80 mW/mm2.
Data analysis
Video preprocessing and voltage signal extraction
All recordings were saved in RAW format using Teledyne Photometrics PVCAM software. Each recording was first corrected for global motion using a masked object Fourier domain cross-correlation algorithm51, where the registration mask was manually selected based on the most distinguishable features within the averaged frame. From each video, the ROI of each neuron was manually selected, with voltage signals extracted by averaging all pixels values within the ROI at each time point. A camera offset was subtracted from the signal (20 ADU for “speed” mode and 100 ADU for “sensitivity” mode). An experimentally calibrated camera conversion gain (0.793 e-/ADU for “speed” mode and 0.264 e-/ADU for “sensitivity” mode) obtained using the mean-variance technique52 was used to convert ADU values into actual number of detected photons. During experiments we found that the peak QE of the camera was measured to be ~ 95% under “sensitivity” readout mode, but only ~ 45% under “speed” readout mode due to a design flaw in the readout electronics.
Spike detection and spike SNR estimation
Spike detection and SNR estimation were performed using the same procedure outlined in Ref.7,8. The algorithm consisted of several steps, including estimating baseline noise , spike detection and estimating subthreshold traces . Since this algorithm assumes action potentials produce positive changes in fluorescence, all Voltron2 fluorescence traces were inverted before calculation.
From the raw fluorescence trace , we first removed photobleaching by high pass filtering at 1 Hz, resulting in a detrended fluorescence trace . This was further highpass filtered at 50 Hz to remove subthreshold fluctuations, resulting in a trace containing both noise and potential spikes . The baseline noise was estimated as twice the standard deviation of the downwardly rectified trace of over a local time window of ±1 s:
| (1) |
where is the downwardly rectified trace, and is locally averaged over a moving window of ±0.2 s. Here by calculating the noise from only the downwardly rectified trace, we reduced bias in the noise estimation due to spike signals.
To find spike locations, we similarly generated an upwardly rectified trace containing all potential spikes: . Since individual action potentials are characterized by sharp rises in fluorescence intensity, we calculated the temporal changes of upwardly/downwardly rectified traces as . Spike locations were determined from the time points that jointly satisfy:
| (2) |
| (3) |
| (4) |
where is the spike amplitude, calculated as the maximum signal rise within 3 ms before the spike time:
| (5) |
With the detected spike locations, we then produced spike-removed raw fluorescence traces by replacing the intensities around the spike locations (1 ms before and 2 ms after the spike) with average the fluorescence intensities within a local ±5 ms time window from the raw trace. Baseline fluorescence was estimated by lowpass filtering at 1 Hz, and subthreshold Vm traces were estimated by bandpass filtering between 1 – 50 Hz. Throughout the manuscript traces were calculated as , SNR traces were calculated as , spike and SNR were estimated as and .
To estimate photobleaching, we fitted the fluorescence baseline trace to an exponential function . The amount of photobleaching over a duration was then calculated as .
Estimation of spike detection fidelity
We calculated the theoretical shot-noise-limited spike detection fidelity by adapting the framework developed in Ref.6 to the case of voltage imaging with a scanning microscope. This is detailed in Supplemental Text 4. Briefly, at each spike location , we calculated the theoretical spike amplitude from the measured spike according to the relationship:
| (6) |
under the assumption of a fluorescence signal model of , where is the baseline fluorescence, is the spike amplitude, is the spike onset time, is the sampling rate, is the decay time of the fluorescent indicator (here assumed to be ms for Voltron2). Spike detection fidelity is then calculated as
| (7) |
Estimation of optical crosstalk
To calculate as a function of distance from the cell membrane (Supplementary Fig. 6), we first gradually expanded the ROI of each neuron by performing morphological dilation (Matlab function imdilate) with a 7-pixel radius disk structural element, allowing us to obtain 7-pixel wide (3.16 μm) donut-shaped ROIs surrounding the same neuron with increasing distances from the cell membrane. At each spike time point was determined according to Eq. 5 within the central ROI, whereas was determined from surrounding donut ROIs at the same time points.
To analyze Vm-Vm correlations, we calculated Pearson cross-correlation coefficients (Matlab function corrcoef) for the extracted subthreshold traces from pairs of neurons. Their separation distances were calculated as the distance between centroids of respective ROIs.
Estimation of image contrast
We estimated the image contrast for each neuron as , where is the average intensity within the neuron ROI, and is the average intensity from a donut ROI surrounding the neuron. The donut ROI was obtained by taking the differences between the original ROI and a morphologically dilated ROI. To account for the anisotropic background distributions resulting from the use of a confocal slit, the morphological dilation was performed using an elliptical structural element with 5 μm vertical axis, and 2 μm horizontal axis.
Frequency-resolved analysis of subthreshold traces
To calculate Vm power at each frequency step , we applied a 2nd-order Butterworth filter with a lower and higher cutoff frequency of 0.8 and 1.2 to the spike-removed fluorescence trace . The analytical signal was then derived by Hilbert transformation to obtain phase and power.
To select of time periods of high/low Vm power in the network, we first averaged the Vm power across simultaneously recorded neurons to obtain a population-averaged Vm power trace. This was done based on the observation that the Vm delta oscillations were highly correlated across neurons. Normalized population Vm power in the delta frequency range was defined here to be between 2 – 5 Hz. Periods with Vm power below and above 2 standard deviations from the distribution were classified as low and high Vm power periods respectively.
Computation of spike-Vm phase locking
To quantify how consistent spikes occurred relative to the oscillation phase for each neuron, we first calculated the phase-locking value53 (PLV) defined as:
| (8) |
where is the phase of the n-th spike at frequency obtained by Hibert transformation, , and is the total number of spikes. To further account for any potential differences in the number of spikes between groups of neurons, we adopted the unbiased phase locking value from Ref.54:
| (9) |
Statistics and Reproducibility
All statistical analysis was performed using Matlab 2021b. For comparison of spike amplitude, spike detection fidelity, spike SNR and spike in Fig. 2, Supplementary Fig. 7, only neurons with measured spike rates of at least 1 Hz for at least one of the investigated imaging conditions (one of the slit widths or with/without targeted illumination) were included to minimize the effects of false-positive spikes. For comparison of Vm-Vm correlation, , and photobleaching, all neurons within the FOV were included. The Wilcoxon signed-rank test was used for paired data (Matlab function signrank), and Wilcoxon rank sum test was used for unpaired data (Matlab function ranksum). The following applied for all box plots in the manuscript: box, 25th (Q1, bottom line) to 75th (Q3, top line) percentiles; whiskers, to , where the interquantile range ; middle line, median (m); notch, from to ; dots, measurement points or outliers according to the figure caption.
SomArchon imaging near superficial layers (Fig. 1, Extended Data Fig. 6, Extended Data Fig. 7, Extended Data Fig. 8, Supplementary Fig. 16) was repeated over 19 FOVs from 6 mice. Voltron2 imaging near superficial layers (Fig. 1, Fig. 3, Extended Data Fig. 5, Supplementary Fig. 12, Supplementary Fig. 13) was repeated over 10 FOVs from 4 mice. Deep tissue imaging of somArchon (Supplementary Fig. 18) was repeated across 6 FOVs from 3 mice, and of Voltron2 (Fig. 4, Extended Data Fig. 9) was repeated across 11 FOVs from 3 mice. Voltron2 imaging via an implanted microprism (Fig. 5, Extended Data Fig. 10, Supplementary Fig. 19) was repeated over 10 FOVs from 2 mice. SomArchon imaging through an imaging cannula (Supplementary Fig. 14) was repeated across 4 FOVs from 2 mice. High-speed imaging was repeated once for Extended Data Fig. 3, Extended Data Fig. 4(a–e), and 2 times for Extended Data Fig. 4(f–j). Experiments were repeated once for Extended Data Fig. 2, Supplementary Fig. 10, Supplementary Fig. 11, Supplementary Fig. 17.
Extended Data
Extended Data Fig. 1. Principle and schematic of TICO microscope.
(a-c) Design principle of TICO microscope: (a) conventional strategy for incorporation a DMD into a confocal microscope; (b) bypassing DMD in the detection path to avoid fluorescence loss; (c) inserting a wedge prism in front of the DMD corrects for both image plane tilt and 1D magnification change caused by the DMD, restoring confocality between excitation and detection beams. (d) Detailed schematic of TICO microscope. DM, dichromatic mirror. Em, emission filter. Ex, excitation filter. PBS, polarizing beam splitter. λ/2, half-wave plate. λ/4, quarter-wave plate. Galvo, galvanometric scanner. DMD, digital micromirror device. Obj, objective.
Extended Data Fig. 2. Optical performance characterization of TICO microscope.
(a) Fluorescence image of a single layer of 1 μm fluorescent beads acquired by projecting a 7.9 μm checkerboard pattern on the DMD. Note that over the full FOV of 1.16 × 0.325 mm the top left and bottom right corner are clipped due to the smaller DMD chip size. The FOV without clipping is 880 × 325 μm, indicated by the red rectangle. Scale bar, 50 μm. (b) Confocal image of 100 nm fluorescent beads over the FOV. Slit size was set to 14 μm. Scale bar, 50 μm. (c) FWHM values of PSFs across different lateral positions across the FOV. Scale bar, 50 μm. For each group from left to right, n = 92, 106, 123, 121, 124, 82 beads from 1 FOV. Box plots same as Fig. 2(e). (d) Example PSFs from the red rectangular regions shown in (b). Scale bar, 5 μm. (e) Optical sectioning profiles measured with different slit widths 2vd. Data obtained by axially translating a single layer of 1 μm fluorescent beads and measuring the integrated intensity as a function of defocus without targeted illumination. a.u., arbitrary unit. (f) Thickness of optical sections measured at a threshold of 50% or 90% of the maximum intensity.
Extended Data Fig. 3. High-speed voltage imaging at 1 kHz frame rate.
(a) Confocal image of Voltron2 fluorescence over a FOV of 880 × 325 μm. Scale bar, 50 μm. (b) Averaged Voltron2 fluorescence image with 42 targeted neurons. Scale bar, 50 μm. (c) Fluorescence traces of spiking neurons over a 30 s recording. (d,e) Zoomed-in fluorescence traces over the rectangular labeled regions in (c).
Extended Data Fig. 4. High-speed voltage imaging at 2 kHz and 4 kHz frame rates.
(a) Confocal image of Voltron2 fluorescence. Scale bar, 50 μm. (b) Averaged Voltron2 fluorescence image with 14 neurons targeted within the FOV. Scale bar, 50 μm. (c) Voltron fluorescence traces of 5 active neurons over a 10 s recording. Recording speed 2 kHz. (d,e) Zoomed-in fluorescence traces over the rectangular labeled regions in (c). (f) Confocal image of GFP fluorescence. Scale bar, 20 μm. (g) Averaged somArchon fluorescence image with 4 neurons targeted within the FOV. Scale bar, 20 μm. (h) SomArchon fluorescence traces of 2 active neurons over a 10 s recording. Recording speed 4 kHz. (i,j) Zoomed-in fluorescence traces over the rectangular labeled regions in (h).
Extended Data Fig. 5. Large-scale imaging of Voltron2 fluorescence from 57 cells invivo.
(a) Averaged Voltron2 fluorescence image from TICO microscope with 57 cells targeted. Scale bar, 50 μm. (b) Complete 20 min recording of Voltron2 fluorescence from 57 cells. (c) Raw fluorescence traces from 2 selected cells.
Extended Data Fig. 6. Large-scale imaging of somArchon fluorescence from 37 cells near the visual cortex.
(a) Confocal image of GFP fluorescence. Yellow square indicates actual somArchon imaging FOV shown in (b). Scale bar, 50 μm. (b) SomArchon fluorescence image with 37 cells targeted. Scale bar, 50 μm. (c) SomArchon fluorescence traces of 37 cells over a continuous 30 s recording. Recording speed 775 Hz, imaging depth 100 μm. (d,e) Zoomed-in fluorescence traces of active neurons during 1 s and 25 s of the recording.
Extended Data Fig. 7. Observation of highly synchronized 3 – 5 Hz membrane oscillations in L1 interneurons.
(a) Confocal image of GFP fluorescence over the imaging FOV. Scale bar, 50 μm. (b) SomArchon fluorescence traces for all the neurons labeled in (a). Scale bar, 50 μm. (c,d) Zoomed-in fluorescence traces (top panel) of two selective neurons and their corresponding power spectra (bottom panel).
Extended Data Fig. 8. Analysis of voltage traces recorded from the animal in Extended Data Fig. 7, Supplementary Fig. 16.
(a) Frequency-resolved Vm power averaged from time periods with high delta population Vm power (> 2 standard deviation, S.D.; red trace) and low Vm power (< 2 S.D.; blue trace). Within 2 – 5 Hz frequency range (black box), most neurons showed significant Vm delta power modulation (paired student t-test, ***p = 3.27e−12, n = 99 neurons with average spike rate ≥ 1 Hz, 8 FOVs from 1 mouse). Solid line, mean; shaded area, ± 1 S.D. (b) Firing rate modulation of neurons from periods of high Vm delta power relative to periods of low Vm delta power. Paired student t-test, **p = 0.009, n = 99 neurons with average spike rate ≥ 1 Hz, 8 FOVs from 1 mouse. Box plots same as Fig. 2(e). (c) Frequency-resolved spike-Vm phase locking for all neurons. Solid line, mean; shaded area, ± 1 S.D. (d) Frequency-resolved spike-Vm phase locking between neuron pairs. Red trace, neuron pairs with separation distances between 50 – 150 μm; blue trace, neuron pairs with separation distances > 350 μm. Solid line, mean; shaded area, ± 1 S.D. (e-g) Polar plots of spike phase distribution relative to the 3–5 Hz Vm oscillations within individual neurons (e), and between neuron pairs across separation distances in the range 50 – 150 μm (f) and > 350 μm (g).
Extended Data Fig. 9. Additional datasets for in vivo imaging of Voltron2 fluorescence at depths greater than 200 μm.
Imaging depths from (a) to (d) are 220, 270, 300, and 300 μm. Left column, averaged Voltron2 fluorescence image. Scale bars are 50 μm. Middle column, Voltron2 fluorescence traces from corresponding labeled neurons over 60 s recordings. Right column, zoomed-in fluorescence traces of active neurons during 2 s clips.
Extended Data Fig. 10. Side-on voltage imaging across multiple cortical layers with an implanted microprism.
Voltron2 fluorescence traces of all 25 neurons across layer 1 to 5 over the complete 45 s recording.
Supplementary Material
Acknowledgements
The authors thank members of the Han lab and Economo lab for assistance in imaging experiments. This work was supported by NIH grants R34NS127098 (S.X. and J.M.), R01MH122971 (K.K., E.L., R.M., C.R., E.B., D.S., and X.H.), RF1MH126882 (W.J.C. and M.N.E.), and F32MH129149 (M.V.M), and NSF grant 2002971-DIOS (X.H.). The funders had no role in study design, data collection and analysis, decision to publish or preparation of the manuscript.
Footnotes
Code Availability
All relevant code for data processing is available at https://doi.org/10.5281/zenodo.10682544.
Competing Interests Statement
The authors declare no competing interests.
Data Availability
Data underlying the results presented in this study is available at https://doi.org/10.5281/zenodo.10682544.
References
- 1.Kim TH & Schnitzer MJ Fluorescence imaging of large-scale neural ensemble dynamics. Cell 185, 9–41 (2022). [DOI] [PMC free article] [PubMed] [Google Scholar]
- 2.Lin MZ & Schnitzer MJ Genetically encoded indicators of neuronal activity. Nat. Neurosci 19, 1142–1153 (2016). [DOI] [PMC free article] [PubMed] [Google Scholar]
- 3.Sabatini BL & Tian L. Imaging neurotransmitter and neuromodulator dynamics in vivo with genetically encoded indicators. Neuron 108, 17–32 (2020). [DOI] [PubMed] [Google Scholar]
- 4.Huang L. et al. Relationship between simultaneously recorded spiking activity and fluorescence signal in GCaMP6 transgenic mice. eLife 10, e51675 (2021). [DOI] [PMC free article] [PubMed] [Google Scholar]
- 5.Knöpfel T. & Song C. Optical voltage imaging in neurons: moving from technology development to practical tool. Nat. Rev. Neurosci 20, 719–727 (2019). [DOI] [PubMed] [Google Scholar]
- 6.Gong Y. et al. High-speed recording of neural spikes in awake mice and flies with a fluorescent voltage sensor. Science 350, 1361–1366 (2015). [DOI] [PMC free article] [PubMed] [Google Scholar]
- 7.Piatkevich KD et al. A robotic multidimensional directed evolution approach applied to fluorescent voltage reporters. Nat. Chem. Biol 14, 352–360 (2018). [DOI] [PMC free article] [PubMed] [Google Scholar]
- 8.Piatkevich KD et al. Population imaging of neural activity in awake behaving mice. Nature 574, 413–417 (2019). [DOI] [PMC free article] [PubMed] [Google Scholar]
- 9.Adam Y. et al. Voltage imaging and optogenetics reveal behaviour-dependent changes in hippocampal dynamics. Nature 569, 413–417 (2019). [DOI] [PMC free article] [PubMed] [Google Scholar]
- 10.Villette V. et al. Ultrafast two-photon imaging of a high-gain voltage indicator in awake behaving mice. Cell 179, 1590–1608 (2019). [DOI] [PMC free article] [PubMed] [Google Scholar]
- 11.Kannan M. et al. Dual-polarity voltage imaging of the concurrent dynamics of multiple neuron types. Science 378, eabm8797 (2022). [DOI] [PMC free article] [PubMed] [Google Scholar]
- 12.Tian H. et al. Video-based pooled screening yields improved far-red genetically encoded voltage indicators. Nat. Methods 1–13 (2023). [DOI] [PMC free article] [PubMed] [Google Scholar]
- 13.Abdelfattah AS et al. Sensitivity optimization of a rhodopsin-based fluorescent voltage indicator. Neuron 111, 1547–1563.e9 (2023). [DOI] [PMC free article] [PubMed] [Google Scholar]
- 14.Liu Z. et al. Sustained deep-tissue voltage recording using a fast indicator evolved for two-photon microscopy. Cell 185, 3408–3425 (2022). [DOI] [PMC free article] [PubMed] [Google Scholar]
- 15.Lim ST, Antonucci DE, Scannevin RH & Trimmer JS A novel targeting signal for proximal clustering of the Kv2.1 K+ channel in hippocampal neurons. Neuron 25, 385–397 (2000). [DOI] [PubMed] [Google Scholar]
- 16.Quicke P. et al. Single-neuron level one-photon voltage imaging with sparsely targeted genetically encoded voltage indicators. Front. Cell. Neurosci 13, 39 (2019). [DOI] [PMC free article] [PubMed] [Google Scholar]
- 17.Fan LZ et al. All-optical electrophysiology reveals the role of lateral inhibition in sensory processing in cortical layer 1. Cell 180, 521–535 (2020). [DOI] [PMC free article] [PubMed] [Google Scholar]
- 18.Xiao S. et al. Large-scale voltage imaging in behaving mice using targeted illumination. iScience 24, 103263 (2021). [DOI] [PMC free article] [PubMed] [Google Scholar]
- 19.Weber TD, Moya MV, Kilic K, Mertz J. & Economo MN High-speed multiplane confocal microscopy for voltage imaging in densely labeled neuronal populations. Nat. Neurosci 26, 1642–1650 (2023). [DOI] [PMC free article] [PubMed] [Google Scholar]
- 20.Li B. et al. Two-photon voltage imaging of spontaneous activity from multiple neurons reveals network activity in brain tissue. iScience 23, 101363 (2020). [DOI] [PMC free article] [PubMed] [Google Scholar]
- 21.Wu J. et al. Kilohertz two-photon fluorescence microscopy imaging of neural activity in vivo. Nat. Methods 17, 287–290 (2020). [DOI] [PMC free article] [PubMed] [Google Scholar]
- 22.Platisa J. et al. High-speed low-light in vivo two-photon voltage imaging of large neuronal populations. Nat. Methods 1–9 (2023). [DOI] [PMC free article] [PubMed] [Google Scholar]
- 23.Quirin S, Jackson J, Peterka DS & Yuste R. Simultaneous imaging of neural activity in three dimensions. Front. neural circuits 8, 29 (2014). [DOI] [PMC free article] [PubMed] [Google Scholar]
- 24.Ducros M, Houssen YG, Bradley J, de Sars V. & Charpak S. Encoded multisite two-photon microscopy. Proc. Natl. Acad. Sci 110, 13138–13143 (2013). [DOI] [PMC free article] [PubMed] [Google Scholar]
- 25.Pawley J. Handbook of biological confocal microscopy, vol. 236 (Springer Science & Business Media, 2006). [Google Scholar]
- 26.Saleh BE & Teich MC Fundamentals of photonics (John Wiley & sons, 2019). [Google Scholar]
- 27.Geng Q, Gu C, Cheng J. & Chen S.-c. Digital micromirror device-based two-photon microscopy for three-dimensional and random-access imaging. Optica 4, 674–677 (2017). [Google Scholar]
- 28.Hoffmann M, Papadopoulos IN & Judkewitz B. Kilohertz binary phase modulator for pulsed laser sources using a digital micromirror device. Opt. Lett 43, 22–25 (2018). [DOI] [PubMed] [Google Scholar]
- 29.Polishchuk G. & Sokol’ski˘ı M. Correction of the image tilt in optical systems. J. Opt. Technol 75, 432–436 (2008). [Google Scholar]
- 30.Wilt BA, Fitzgerald JE & Schnitzer MJ Photon shot noise limits on optical detection of neuronal spikes and estimation of spike timing. Biophys. J 104, 51–62 (2013). [DOI] [PMC free article] [PubMed] [Google Scholar]
- 31.Pnevmatikakis EA et al. Simultaneous denoising, deconvolution, and demixing of calcium imaging data. Neuron 89, 285–299 (2016). [DOI] [PMC free article] [PubMed] [Google Scholar]
- 32.Giovannucci A. et al. Caiman an open source tool for scalable calcium imaging data analysis. elife 8, e38173 (2019). [DOI] [PMC free article] [PubMed] [Google Scholar]
- 33.Cai C. et al. Volpy: Automated and scalable analysis pipelines for voltage imaging datasets. PLoS computational biology 17, e1008806 (2021). [DOI] [PMC free article] [PubMed] [Google Scholar]
- 34.Einstein MC, Polack P-O, Tran DT & Golshani P. Visually evoked 3–5 Hz membrane potential oscillations reduce the responsiveness of visual cortex neurons in awake behaving mice. J. Neurosci 37, 5084–5098 (2017). [DOI] [PMC free article] [PubMed] [Google Scholar]
- 35.Nestvogel DB & McCormick DA Visual thalamocortical mechanisms of waking state-dependent activity and alpha oscillations. Neuron 110, 120–138 (2022). [DOI] [PMC free article] [PubMed] [Google Scholar]
- 36.Senzai Y, Fernandez-Ruiz A. & Buzsáki G. Layer-specific physiological features and interlaminar interactions in the primary visual cortex of the mouse. Neuron 101, 500–513 (2019). [DOI] [PMC free article] [PubMed] [Google Scholar]
- 37.Cruikshank SJ et al. Thalamic control of layer 1 circuits in prefrontal cortex. J. Neurosci 32, 17813–17823 (2012). [DOI] [PMC free article] [PubMed] [Google Scholar]
- 38.Rubio-Garrido P, Pérez-de Manzo F, Porrero C, Galazo MJ & Clascá F. Thalamic input to distal apical dendrites in neocortical layer 1 is massive and highly convergent. Cereb. Cortex 19, 2380–2395 (2009). [DOI] [PubMed] [Google Scholar]
- 39.Abdelfattah AS et al. Bright and photostable chemigenetic indicators for extended in vivo voltage imaging. Science 365, 699–704 (2019). [DOI] [PubMed] [Google Scholar]
- 40.Takasaki K, Abbasi-Asl R. & Waters J. Superficial bound of the depth limit of two-photon imaging in mouse brain. eNeuro 7 (2020). [DOI] [PMC free article] [PubMed] [Google Scholar]
- 41.Mohammed AI et al. An integrative approach for analyzing hundreds of neurons in task performing mice using wide-field calcium imaging. Sci. Reports 6, 1–16 (2016). [DOI] [PMC free article] [PubMed] [Google Scholar]
- 42.Jung JC, Mehta AD, Aksay E, Stepnoski R. & Schnitzer MJ In vivo mammalian brain imaging using one-and two-photon fluorescence microendoscopy. J. Neurophysiol 92, 3121–3133 (2004). [DOI] [PMC free article] [PubMed] [Google Scholar]
- 43.Andermann ML et al. Chronic cellular imaging of entire cortical columns in awake mice using microprisms. Neuron 80, 900–913 (2013). [DOI] [PMC free article] [PubMed] [Google Scholar]
- 44.Larkum ME, Petro LS, Sachdev RN & Muckli L. A perspective on cortical layering and layer-spanning neuronal elements. Front. Neuroanat 56 (2018). [DOI] [PMC free article] [PubMed] [Google Scholar]
- 45.Zhang Y. et al. Fast and sensitive GCaMP calcium indicators for imaging neural populations. Nature 1–8 (2023). [DOI] [PMC free article] [PubMed] [Google Scholar]
- 46.Marvin JS et al. Stability, affinity, and chromatic variants of the glutamate sensor iGluSnFR. Nat. Methods 15, 936–939 (2018). [DOI] [PMC free article] [PubMed] [Google Scholar]
- 47.Shain WJ, Vickers NA, Goldberg BB, Bifano T. & Mertz J. Extended depth-of-field microscopy with a high-speed deformable mirror. Opt. Lett 42, 995–998 (2017). [DOI] [PubMed] [Google Scholar]
- 48.Xiao S, Tseng H. a., Gritton H, Han X. & Mertz J. Video-rate volumetric neuronal imaging using 3D targeted illumination. Sci. Reports 8, 7921 (2018). [DOI] [PMC free article] [PubMed] [Google Scholar]
- 49.Tony Hyun Kim Yanping Zhang, Lecoq Jérôme, Juergen C Jung Jane Li, Zeng Hongkui, Cristopher M Niell, and Mark J Schnitzer. Long-term optical access to an estimated one million neurons in the live mouse cortex. Cell Reports, 17(12):3385–3394, 2016. [DOI] [PMC free article] [PubMed] [Google Scholar]
- 50.Kılıç Kıvılcım, Desjardins Michèle, Tang Jianbo, Thunemann Martin, Sunil Smrithi, Erdener Şefik Evren, Postnov Dmitry D, Boas David A, and Devor Anna. Chronic cranial windows for long term multimodal neurovascular imaging in mice. Frontiers in Physiology, 11:612678, 2021. [DOI] [PMC free article] [PubMed] [Google Scholar]
- 51.Padfield Dirk. Masked object registration in the fourier domain. IEEE Transactions on Image Processing, 21(5):2706–2718, 2011. [DOI] [PubMed] [Google Scholar]
- 52.Heintzmann Rainer, Relich Peter K, Nieuwenhuizen Robert PJ, Lidke Keith A, and Rieger Bernd. Calibrating photon counts from a single image. arXiv preprint arXiv:1611.05654, 2016. [Google Scholar]
- 53.Lachaux Jean-Philippe, Rodriguez Eugenio, Martinerie Jacques, and Francisco J Varela. Measuring phase synchrony in brain signals. Human Brain Mapping, 8(4):194–208, 1999. [DOI] [PMC free article] [PubMed] [Google Scholar]
- 54.Aydore Sergul, Pantazis Dimitrios, and Leahy Richard M. A note on the phase locking value and its properties. NeuroImage, 74:231–244, 2013. [DOI] [PMC free article] [PubMed] [Google Scholar]
Associated Data
This section collects any data citations, data availability statements, or supplementary materials included in this article.
Supplementary Materials
Data Availability Statement
Data underlying the results presented in this study is available at https://doi.org/10.5281/zenodo.10682544.


