

Summary
Background
Hearing loss has been identified as an independent risk factor for negative health outcomes and mortality. However, whether rehabilitation with hearing aid use is associated with lower mortality is currently unknown. This study aimed to examine the associations of hearing loss, hearing aid use, and mortality in the USA.
Methods
In this cross-sectional, follow-up study, we assessed 9885 adults (age 20 years and older) who participated in the National Health and Nutrition Examination Survey between 1999 and 2012 and completed audiometry and hearing aid use questionnaires (1863 adults with hearing loss). Main measures included hearing loss (speech-frequency pure-tone average) and hearing aid use (never users, non-regular users, and regular users). Mortality status of the cohort was linked to the National Death Index up to Dec 31, 2019. Cox proportional regression models were used to examine the association between hearing loss, hearing aid use, and mortality while adjusting for demographics and medical history.
Findings
The cohort consisted of 9885 participants, of which 5037 (51·0%) were female and 4848 (49·0%) were male with a mean age of 48·6 years (SD 18·1) at baseline. The weighted prevalence of audiometry-measured hearing loss was 14·7% (95% CI 13·3–16·3%) and the all-cause mortality rate was 13·2% (12·1–14·4) at a median 10·4 years of follow-up (range 0·1–20·8). The rate of regular hearing aid use among adults with hearing loss was 12·7% (95% CI 10·6–15·1). Hearing loss was an independent risk factor associated with higher mortality (adjusted hazard ratio [HR] 1·40 [95% CI 1·21–1·62]). Among individuals with hearing loss, the adjusted mortality risk was lower among regular hearing aid users in comparison with never users (adjusted HR 0·76 [0·60–0·95]) accounting for demographics, hearing levels, and medical history. There was no difference in adjusted mortality between non-regular hearing aid users and never users (adjusted HR 0·93 [0·70–1·24]).
Interpretation
Regular hearing aid use was associated with lower risks of mortality than in never users in US adults with hearing loss when accounting for age, hearing loss, and other potential confounders. Future research is needed to investigate the potential protective role of hearing aid use against mortality for adults with hearing loss.
Funding
None
Introduction
Hearing loss is highly prevalent, affecting an estimated 1·6 billion people globally, and its prevalence is projected to increase to 2·5 billion by 2050.1 The burden of hearing loss is substantial as it impedes interpersonal communication in both social settings and the workplace. Previous studies have identified hearing loss as a major risk factor for adverse health outcomes including reduced quality of life, depression, dementia, and mortality.2-6 Previous systematic reviews and meta-analyses demonstrated that hearing loss is significantly associated with excess all-cause mortality even after adjusting for demographics and comorbidities, and there is a dose–response relationship in which the risks in mortality doubled per 30 dB increase in hearing loss.4,5 However, whether treatment of hearing loss with hearing aid use is associated with lower risks of mortality is currently unknown.
Hearing aids are a first-line intervention for most individuals with hearing loss and their use has been shown to improve perceived disability from hearing loss and quality of life.6 A few previous epidemiological studies have included hearing aid use as a covariate in exploring the association between hearing loss and mortality.7-11 Among these, two studies have reported secondary results with regard to hearing aid use while accounting for audiometry-measured hearing loss:7,8 one study, based on US community-dwelling adults aged 70 years and older, reported no significant association between hearing aid use and mortality,8 while another study, based on Icelandic adults aged 67 years and older, reported an association between hearing aid use and lower risks of mortality within a subgroup of a cohort with hearing and visual impairments.7 These studies reported effect measures of hearing aid use as secondary outcomes within the models designed for the primary purpose of examining the association between hearing loss and mortality, limiting the interpretation of the effect measures. Furthermore, these studies included older adults only with shorter follow-up durations, providing limited understanding on the long-term role of hearing aid use. One previous epidemiological study primarily investigated the association between hearing aid use and adverse health outcomes including mortality.12 That study, which included a small sample of hearing aid users (n=69), found no significant association between hearing aid use and mortality.
This study aims to examine the associations between hearing loss, hearing aid use, and mortality, accounting for demographics and medical history using a nationally representative sample of US adults.
Methods
Study design and participants
Our cross-sectional study is based on a cohort of adults who participated in the National Health and Nutrition Examination Survey (NHANES) between 1999 and 2012, with follow-up data on mortality available up to and throughout 2019.
NHANES is a collection of ongoing studies collected by the US Centers for Disease Control and Prevention designed to assess the nutritional and health status of the non-institutionalised, non-military population in the USA. Each cross-sectional study cycle in NHANES uses a stratified, multistage probability sampling design with selective oversampling of individuals with a low income and those of racial minority backgrounds. Sampling weights allow for analyses to account for the complex survey design, yielding results that are generalisable to the US population.13 Hearing aid use was assessed once at the time of NHANES participation and categorised into regular and non-regular use based on the reported usage frequency. Regular hearing aid use was defined as a primary exposure to investigate the role of consistent hearing aid usage on mortality, excluding those who tried hearing aids but did not use them regularly.
Our analytic cohort comprised participants aged 20 years or older in the NHANES in 1999–2012 and who had complete data on audiometry-measured hearing, hearing aid use, mortality, and included covariates. NHANES 2007–08 was excluded as audiometry data was collected among adolescents only. The contribution from each NHANES cycle is summarised in the appendix (p 1).
We have conducted a review of our manuscript according to the STROBE checklist, ensuring compliance with its requirements for reporting our observational study. The study underwent review by the University of Southern California Institutional Review Board and was approved as being exempt from review (UP-20–01447). This study is based on data from a de-identified publicly available database.
Procedures
Audiometry was performed by trained examiners based on the established NHANES protocols.13 Briefly, an examiner determined the air conduction hearing threshold for each ear without a hearing aid in a sound-isolated room of the mobile examination centre. Testing was conducted using the automated testing mode of the audiometer Interacoustics Model AD226 (Assens, Denmark). Audiometric equipment and sound booths (of the same brands and models) were used during the study period. Daily equipment calibration and monitoring of ambient noise levels using a sound level meter were performed as part of the quality assurance protocols. Speech-frequency pure-tone average was calculated for each ear based on thresholds at 0·5 kHz, 1 kHz, 2 kHz, and 4 kHz. Audiometry-measured hearing loss was defined as speech-frequency pure-tone average at 25 dB HL (hearing level) or greater in the better hearing ear, as defined by WHO.14 Hearing loss was further categorised into mild, moderate, and severe to profound hearing loss based on the WHO grading (mild, 25 to <40 dB HL; moderate, 40 to <60 dB HL; severe to profound, ≥60 dB HL).14
Hearing aid use was categorised into three groups (never, regular, and non-regular hearing aid users) based on interview data. Participants who answered “no” to a question “Have you ever worn a hearing aid?” were categorised as never hearing aid users. Regular hearing aid use was defined on the basis of questions on frequency of hearing aid use in the past 12 months, which varied by cycle. Participants were considered regular hearing aid users when reporting: (1) at least once a week, once a day, or almost always (vs at least once a month or less frequently than once a month; NHANES 1999–2004); (2) wearing a hearing aid for at least 5 h per week (NHANES 2005–06, 2009–10); or (3) at least half the time, usually, or always (vs seldom or never; NHANES 2011–12). Participants who reported ever hearing aid use but not meeting criteria for regular hearing aid users were considered as non-regular hearing aid users. Questions on cochlear implant use were asked only in NHANES 2011–12. Two participants who reported cochlear implant use were excluded from the study cohort.
Mortality status was determined by probabilistic matching between NHANES data and death certificates up to Dec 31, 2019.15 The National Center for Health Statistics has linked data collected from the NHANES surveys with death certificate records from the National Death Index.15 Follow-up time was assigned using person-months from the date of interview to the date of death or censoring on Dec 31, 2019.
Information on demographics and medical history were obtained from interview data. Sex was categorised into male or female and marital status was categorised into married or living with partner, or widowed, divorced, separated, or never married. Self-reported race and ethnicity were grouped as White, Black, Hispanic, or other participants. The poverty-to-income ratio was divided into four categories and level of education was divided into three categories. Insurance was categorised into no insurance, private insurance, or Medicare or Medicaid. Medical history variables included diabetes, hypertension, stroke, cardiovascular disease, smoking status (never, former, or current), and BMI (normal, 18·5–24·9 kg/m2; underweight, <18·5 kg/m2; overweight, 25–29·9 kg/m2; and obese, ≥30 kg/m2). Covariates were determined based on previous literature.8,16-19 They were tested for collinearity using variance inflation factor and we did not find any evidence of collinearity.
Statistical analysis
Study data were analysed in August, 2023. We summarised categorical data using counts and percentages, and continuous data using mean and SD as appropriate. Baseline characteristics of the study participants were compared using the two-tailed t test and Pearson χ2 test. Kaplan-Meier analysis was employed to estimate the survival probabilities and generate survival curves for our study cohort. Survival probabilities were estimated as a function of time from when participants completed audiometric assessment and questionnaires and survival curves were generated by severity of hearing loss. The association between hearing loss and all-cause mortality was examined using Cox proportional hazards regression models considering hearing loss as a binary and categorical variable. Results were presented as hazard ratios (HRs) and their corresponding 95% CIs. Sample weights were used in all Cox proportional hazard regression models to account for the complex sampling design based on the NHANES analytic guidelines.20 The association between hearing aid use and all-cause mortality was examined using Cox proportional hazards regression models in a subgroup of the cohort with audiometry-measured hearing loss. Multivariable models were sequentially adjusted for age, hearing loss, demographics, and medical history. In models examining the association between hearing aid use and mortality, hearing loss was considered a continuous variable along with age. Sex, race, education, poverty-to-income ratio, marital status, insurance, smoking, BMI, diabetes, hypertension, cardiovascular disease, and stroke were considered categorical variables. Schoenfeld’s residuals were used to verify the proportional hazard assumptions for all independent variables. A sensitivity analysis was performed by combining non-regular and regular hearing aid users into a single group termed ever hearing aid users, and their mortality risks were compared with those who reported never use. An additional sensitivity analysis was done by restricting the study cohort to NHANES 2005–12, as this period had relatively consistent terminology for defining regular hearing aid use and was considered more recent, with a lower likelihood of changes in hearing aid use status after NHANES study participation. All analyses were done with STATA (version 16.1).
Role of the funding source
There was no funding source for this study.
Results
The study cohort consisted of 9885 adults who participated in the 1999–2012 NHANES survey (mean age 48·6 years [SD 18·1]). Of the 9885 participants, 5037 (51·0%) were female and 4848 (49·0%) were male, and 1863 participants were found to have audiometry-measured hearing loss and complete data at the time of NHANES participation (table 1). There was a 14·8% loss of data from the original cohort due to missing information on covariates (n=1723); among the 2026 original participants who had audiometry-measured hearing loss, 163 (8·0%) had missing data. There were no differences in missingness by hearing aid use. Incorporating the sampling weights, the estimated prevalence of audiometry-measured hearing loss in US adults aged 20 years and older was 14·7% (95% CI 13·3–16·3). Among adults with hearing loss, the rate of regular hearing aid use was 12·7% (95% CI 10·6–15·1) and the rate of non-regular hearing aid use was 6·6% (5·4–8·0). The all-cause mortality rate at a median of 10·4 years of follow-up (range 0·1–20·8; mean 12·2 years [SD 5·3]) was 13·2% (95% CI 12·1–14·4).
Table 1:
Baseline characteristics
| Overall (n=9885) |
Participants with hearing loss* (n=1863) |
Hearing aid use† | ||||
|---|---|---|---|---|---|---|
| Never users (n=1483) |
Non-regular users (n=143) |
Regular users (n=237) |
p value | |||
| Age, years | 48·6 (18·1) | 69·4 (12·0) | 68·4 (12·1) | 72·0 (11·2) | 74·4 (9·7) | <0·0001 |
| Sex | ||||||
| Male | 4848 (49·0%) | 1118 (60·0%) | 864 (58·3%) | 98 (68·5%) | 156 (65·8%) | 0·0080 |
| Female | 5037 (51·0%) | 745 (40·0%) | 619 (41·7%) | 45 (31·5%) | 81 (34·2%) | ·· |
| Race or ethnicity | ||||||
| White | 4670 (47·2%) | 1212 (65·1%) | 914 (61·6%) | 96 (67·1%) | 202 (85·2%) | <0·0001 |
| Black | 2161 (21·9%) | 236 (12·7%) | 204 (13·8%) | 15 (10·5%) | 17 (7·2%) | ·· |
| Hispanic | 2224 (22·5%) | 332 (17·8%) | 290 (19·6%) | 26 (18·2%) | 16 (6·8%) | ·· |
| Other | 830 (8·4%) | 83 (4·5%) | 75 (5·0%) | 6 (4·2%) | 2 (0·8%) | ·· |
| Education | ||||||
| Less than high school | 2594 (26·2%) | 725 (38·9%) | 598 (40·3%) | 58 (40·6%) | 69 (29·1%) | 0·0010 |
| High school graduate | 2231 (22·6%) | 469 (25·2%) | 383 (25·8%) | 26 (18·2%) | 60 (25·3%) | ·· |
| Some college or more | 5060 (51·2%) | 669 (35·9%) | 502 (33·9%) | 59 (43·3%) | 108 (45·6%) | ·· |
| Poverty-to-income ratio | ||||||
| <1 | 1783 (18·0%) | 279 (15·0%) | 242 (16·3%) | 18 (12·6%) | 19 (8·0%) | 0·010 |
| 1 to <2 | 2356 (23·8%) | 572 (30·7%) | 458 (30·9%) | 49 (34·3%) | 65 (27·4%) | ·· |
| 2 to <3 | 1407 (14·2%) | 312 (16·7%) | 247 (16·7%) | 24 (16·8%) | 41 (17·3%) | ·· |
| ≥3 | 3625 (36·7%) | 539 (28·9%) | 410 (27·6%) | 38 (26·6%) | 91 (38·4%) | ·· |
| Refused or unsure | 714 (7·2%) | 161 (8·6%) | 126 (8·5%) | 14 (9·8%) | 21 (8·9%) | ·· |
| Marital status | ||||||
| Married or living with partner | 6006 (60·8%) | 1123 (60·3%) | 897 (60·5%) | 85 (59·4%) | 141 (59·5%) | 0·94 |
| Divorced, widowed, separated, or never married | 3879 (39·2%) | 740 (39·7%) | 586 (39·5%) | 58 (40·6%) | 96 (40·5%) | ·· |
| Health insurance | ||||||
| No | 2205 (22·3%) | 194 (10·4%) | 183 (12·3%) | 8 (5·6%) | 3 (1·3%) | <0·0001 |
| Private | 4796 (48·5%) | 370 (19·9%) | 311 (21·0%) | 21 (14·7%) | 38 (16·0%) | ·· |
| Medicare or Medicaid | 2884 (29·2%) | 1299 (69·7%) | 989 (66·7%) | 114 (79·7%) | 196 (82·7%) | ·· |
| Smoking | ||||||
| Never | 5250 (53·1%) | 787 (42·2%) | 637 (43·0%) | 55 (38·5%) | 95 (40·1%) | <0·0001 |
| Former | 2543 (25·7%) | 780 (41·9%) | 586 (39·5%) | 68 (47·6%) | 126 (53·2%) | ·· |
| Current | 2092 (21·2%) | 296 (15·9%) | 260 (17·5%) | 20 (14·0%) | 16 (6·8%) | ·· |
| BMI | ||||||
| Normal | 2968 (30·0%) | 515 (27·6%) | 414 (27·9%) | 34 (23·8%) | 67 (28·3%) | 0·71 |
| Underweight | 166 (1·7%) | 20 (1·1%) | 16 (1·1%) | 1 (0·7%) | 3 (1·3%) | ·· |
| Overweight | 3343 (33·8%) | 701 (37·6%) | 546 (36·8%) | 58 (40·6%) | 97 (40·9%) | ·· |
| Obese | 3408 (34·5%) | 627 (33·7%) | 507 (34·2%) | 50 (35·0%) | 70 (29·5%) | ·· |
| Diabetes | 1074 (10·9%) | 385 (20·7%) | 317 (21·4%) | 26 (18·2%) | 42 (17·7%) | 0·33 |
| Hypertension | 3034 (30·7%) | 992 (53·3%) | 780 (52·6%) | 81 (56·6%) | 131 (55·3%) | 0·52 |
| Cardiovascular disease | 822 (8·3%) | 399 (21·4%) | 302 (20·4%) | 39 (27·3%) | 58 (24·5%) | 0·074 |
| Stroke | 322 (3·3%) | 160 (8·6%) | 122 (8·2%) | 14 (9·8%) | 24 (10·1%) | 0·54 |
Data are n (%) or mean (SD), unless otherwise specified. *Hearing loss defined on the basis of audiometry-measured speech-frequency pure-tone average at 0·5 kHz, 1 kHz, 2 kHz, and 4 kHz (≥25 dB HL). †Hearing aid use among individuals who have audiometry-measured hearing loss (n=1863). p values represent differences in demographics or medical comorbidities by hearing aid use category among participants with hearing loss (never vs non-regular vs regular hearing aid users). They were calculated for each characteristic based on χ2 tests. One p value is available for each characteristic (ie, one for sex, one for race, one for education, etc).
Kaplan-Meier survival estimates by severity of hearing loss are presented in the figure. Overall, poorer hearing was associated with higher risks of mortality (figure). The age-adjusted risk of mortality was significantly higher among adults with any hearing loss (HR 1·68 [95% CI 1·47–1·92]; table 2). The adjusted risks of mortality continued to be significantly higher among adults with hearing loss in multivariable Cox proportional hazard regression models accounting for demographics (HR 1·40 [1·22–1·61]) and for demographics and medical history (HR 1·40 [1·21–1·62]; table 2). There was a dose–response relationship, with moderate or worse hearing loss generally being associated with higher risks of mortality than mild hearing loss.
Figure: Kaplan-Meier survival estimates by severity of hearing loss.
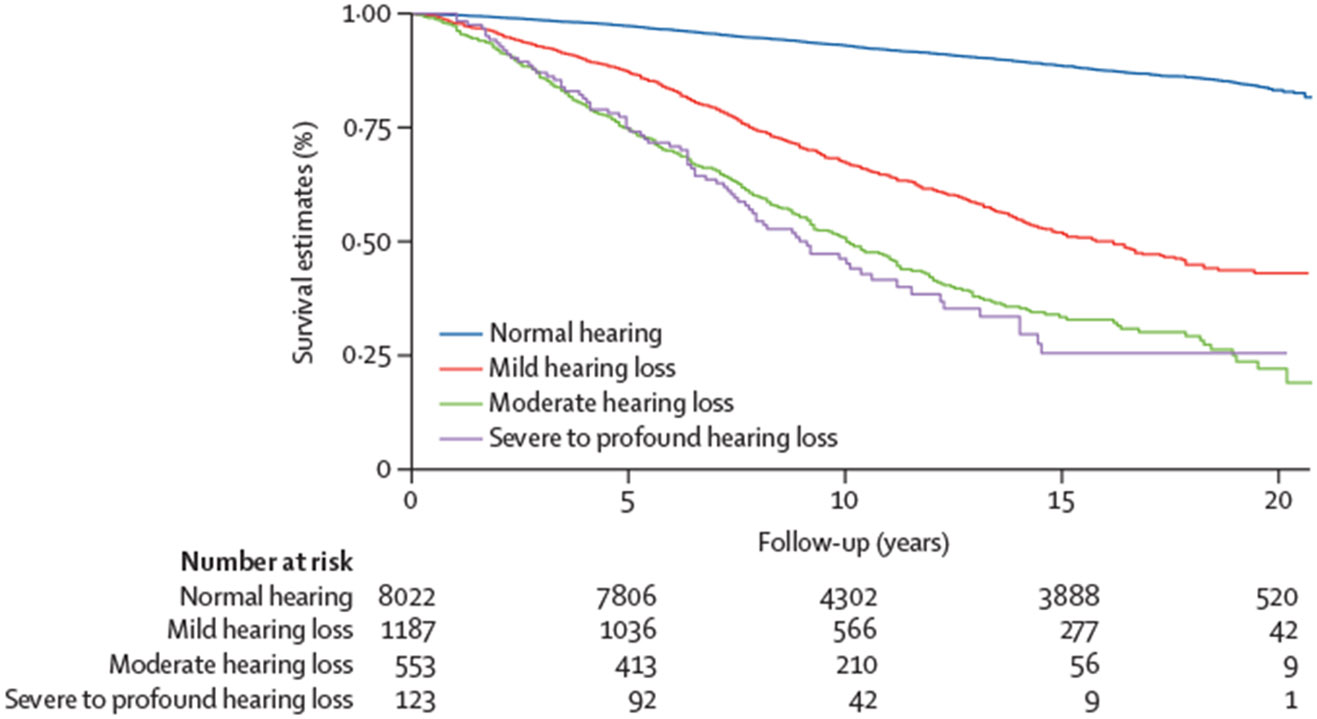
Estimates categorised according to speech-frequency pure-tone average in better hearing ear (normal: <25 dB HL; mild: 25 to <40 dB HL; moderate: 40 to <60 dB HL; and severe to profound: ≥60 dB HL).
Table 2:
Cox proportional hazard regression analysis examining the association between hearing loss and mortality
| Unadjusted | Multivariable models | |||||||
|---|---|---|---|---|---|---|---|---|
| HR (95% CI) | p value | Model 1* HR (95% CI) |
p value | Model 2† HR (95% CI) |
p value | Model 3‡ HR (95% CI) |
p value | |
| Hearing loss | ||||||||
| Normal hearing | 1 (ref) | ·· | 1 (ref) | ·· | 1 (ref) | ·· | 1 (ref) | ·· |
| Any hearing loss | 6·80 (6·09–7·63) | <0·0001 | 1·68 (1·47–1·92) | <0·0001 | 1·40 (1·22–1·61) | <0·0001 | 1·40 (1·21–1·62) | <0·0001 |
| Mild hearing loss | 5·30 (4·60–6·10) | <0·0001 | 1·55 (1·35–1·79) | <0·0001 | 1·34 (1·15–1·56) | <0·0001 | 1·31 (1·12–1·52) | 0·0010 |
| Moderate hearing loss | 11·50 (10·00–13·10) | <0·0001 | 1·97 (1·67–2·33) | <0·0001 | 1·58 (1·32–1·88) | <0·0001 | 1·66 (1·39–2·00) | <0·0001 |
| Severe to profound hearing loss | 12·20 (9·00–16·40) | <0·0001 | 2·17 (1·60–2·93) | <0·0001 | 1·51 (1·11–2·04) | 0·0090 | 1·61 (1·20–2·16) | 0·0020 |
| Age (per year) | ·· | ·· | 1·08 (1·07–1·09) | <0·001 | 1·08 (1·07–1·08) | <0·0001 | 1·07 (1·06–1·08) | <0·0001 |
| Sex | ||||||||
| Male | ·· | ·· | ·· | ·· | 1 (ref) | ·· | 1 (ref) | ·· |
| Female | ·· | ·· | ·· | ·· | 0·63 (0·55–0·71) | <0·0001 | 0·67 (0·59–0·77) | <0·0001 |
| Race or ethnicity | ||||||||
| White | ·· | ·· | ·· | ·· | 1 (ref) | ·· | 1 (ref) | ·· |
| Black | ·· | ·· | ·· | ·· | 1·11 (0·95–1·31) | 0·19 | 1·01 (0·85–1·18) | 0·94 |
| Hispanic | ·· | ·· | ·· | ·· | 0·60 (0·46–0·79) | <0·0001 | 0·66 (0·52–0·85) | 0·0010 |
| Other | ·· | ·· | ·· | ·· | 0·83 (0·62–1·10) | 0·19 | 0·74 (0·54–0·99) | 0·048 |
| Education | ||||||||
| Less than high school | ·· | ·· | ·· | ·· | 1 (ref) | ·· | 1 (ref) | ·· |
| High school graduate | ·· | ·· | ·· | ·· | 0·85 (0·73–0·99) | 0·048 | 0·88 (0·75–1·03) | 0·11 |
| Some college or more | ·· | ·· | ·· | ·· | 0·75 (0·63–0·90) | 0·0020 | 0·83 (0·71–0·97) | 0·020 |
| Poverty-to-income ratio | ||||||||
| <1 | ·· | ·· | ·· | ·· | 1 (ref) | ·· | 1 (ref) | ·· |
| 1 to <2 | ·· | ·· | ·· | ·· | 0·77 (0·64–0·91) | 0·030 | 0·84 (0·71–0·99) | 0·041 |
| 2 to <3 | ·· | ·· | ·· | ·· | 0·80 (0·66–0·96) | 0·015 | 0·87 (0·73–1·04) | 0·13 |
| ≥3 | ·· | ·· | ·· | ·· | 0·63 (0·53–0·74) | <0·0001 | 0·71 (0·60–0·85) | <0·0001 |
| Refused or unsure | ·· | ·· | ·· | ·· | 0·81 (0·61–1·08) | 0·16 | 0·93 (0·70–1·23) | 0·59 |
| Marital status | ||||||||
| Married or living with partner | ·· | ·· | ·· | ·· | 1 (ref) | ·· | 1 (ref) | ·· |
| Divorced, widowed, separated, or never married | ·· | ·· | ·· | ·· | 1·51 (1·32–1·72) | <0·0001 | 1·49 (1·30–1·71) | <0·0001 |
| Health insurance | ||||||||
| No | ·· | ·· | ·· | ·· | 1 (ref) | ·· | 1 (ref) | ·· |
| Private | ·· | ·· | ·· | ·· | 0·69 (0·54–0·88) | 0·0030 | 0·75 (0·58–0·96) | 0·023 |
| Medicare or Medicaid | ·· | ·· | ·· | ·· | 1·20 (0·92–1·55) | 0·17 | 1·14 (0·87–1·50) | 0·32 |
| Smoking | ||||||||
| Never | ·· | ·· | ·· | ·· | ·· | ·· | 1 (ref) | ·· |
| Former | ·· | ·· | ·· | ·· | ·· | ·· | 1·21 (1·04–1·40) | 0·015 |
| Current | ·· | ·· | ·· | ·· | ·· | ·· | 2·06 (1·79–2·37) | <0·0001 |
| BMI | ||||||||
| Normal | ·· | ·· | ·· | ·· | ·· | ·· | 1 (ref) | ·· |
| Underweight | ·· | ·· | ·· | ·· | ·· | ·· | 1·86 (1·14–3·05) | 0·014 |
| Overweight | ·· | ·· | ·· | ·· | ·· | ·· | 0·83 (0·72–0·95) | 0·0070 |
| Obese | ·· | ·· | ·· | ·· | ·· | ·· | 0·95 (0·83–1·09) | 0·45 |
| Diabetes | ·· | ·· | ·· | ·· | ·· | ·· | 1·59 (1·38–1·84) | <0·0001 |
| Hypertension | ·· | ·· | ·· | ·· | ·· | ·· | 1·25 (1·11–1·40) | <0·0001 |
| Cardiovascular disease | ·· | ·· | ·· | ·· | ·· | ·· | 1·47 (1·31–1·66) | <0·0001 |
| Stroke | ·· | ·· | ·· | ·· | ·· | ·· | 1·60 (1·30–1·97) | <0·0001 |
HR=hazard ratio. *Model 1 adjusted for age. †Model 2 adjusted for age, sex, race or ethnicity, education, poverty-to-income ratio, marital status, and health insurance. ‡Model 3 adjusted for age, sex, race or ethnicity, education, poverty-to-income ratio, marital status, health insurance, smoking, BMI, diabetes, hypertension, cardiovascular disease, and stroke.
The association between hearing aid use and risk of mortality was examined among adults with audiometry-measured hearing loss (table 3). The risk of mortality was lower among adults who reported regular hearing aid use than never hearing aid users when adjusting for age and severity of hearing loss (HR 0·66 [95% CI 0·52–0·84]; table 3). In a multivariable model adjusting for age, levels of hearing loss, and demographics, the risk of mortality remained significantly lower among adults who reported regular hearing aid use than never hearing aid users (HR 0·70 [0·55–0·89; table 3). In an additional multivariable model adjusting for age, levels of hearing loss, demographics, and medical history, the risk of mortality was lower for regular hearing aid users than never users (HR 0·76 [0·60–0·95]; table 3). When comparing non-regular hearing aid users to never users, there were no significant differences in mortality risks between the non-regular hearing aid users and never users across all multivariable models (table 3).
Table 3:
Cox proportional hazard regression analysis examining the association between hearing aid use and mortality among adults with audiometry-measured hearing loss
| Unadjusted | Multivariable models | |||||||
|---|---|---|---|---|---|---|---|---|
| HR (95% CI) | p value | Model 1* HR (95% CI) |
p value | Model 2† HR (95% CI) |
p value | Model 3‡ HR (95% CI) |
p value | |
| Hearing aid use | ||||||||
| Never users | 1 (ref) | ·· | 1 (ref) | ·· | 1 (ref) | ·· | 1 (ref) | ·· |
| Non-regular users | 1·41 (1·06–1·87) | 0·018 | 0·88 (0·66–1·17) | 0·39 | 0·89 (0·67–1·19) | 0·44 | 0·93 (0·70–1·24) | 0·66 |
| Regular users | 1·34 (1·06–1·69) | 0·013 | 0·66 (0·52–0·84) | 0·0010 | 0·70 (0·55–0·89) | 0·0040 | 0·76 (0·60–0·95) | 0·021 |
| Age (per year) | ·· | ·· | 1·08 (1·07–1·09) | <0·0001 | 1·07 (1·06–1·08) | <0·0001 | 1·08 (1·06–1·09) | <0·0001 |
| Hearing loss (per dB HL)§ | ·· | ·· | 1·02 (1·01–1·03) | <0·0001 | 1·01 (1·00–1·02) | 0·0070 | 1·01 (1·00–1·02) | 0·0090 |
| Sex | ||||||||
| Male | ·· | ·· | ·· | ·· | 1 (ref) | ·· | 1 (ref) | ·· |
| Female | ·· | ·· | ·· | ·· | 0·65 (0·53–0·79) | <0·0001 | 0·69 (0·57–0·85) | 0·0010 |
| Race or ethnicity | ||||||||
| White | ·· | ·· | ·· | ·· | 1 (ref) | ·· | 1 (ref) | ·· |
| Black | ·· | ·· | ·· | ·· | 0·90 (0·67–1·20) | 0·45 | 0·75 (0·55–1·02) | 0·068 |
| Hispanic | ·· | ·· | ·· | ·· | 0·70 (0·52–0·95) | 0·022 | 0·71 (0·52–0·96) | 0·033 |
| Other | ·· | ·· | ·· | ·· | 0·72 (0·52–1·00) | 0·028 | 0·68 (0·49–0·93) | 0·015 |
| Education | ||||||||
| Less than high school | ·· | ·· | ·· | ·· | 1 (ref) | ·· | 1 (ref) | ·· |
| High school graduate | ·· | ·· | ·· | ·· | 0·95 (0·78–1·16) | 0·63 | 0·95 (0·77–1·17) | 0·64 |
| Some college or more | ·· | ·· | ·· | ·· | 0·87 (0·71–1·08) | 0·20 | 0·90 (0·73–1·10) | 0·33 |
| Poverty-to-income ratio | ||||||||
| <1 | ·· | ·· | ·· | ·· | 1 (ref) | ·· | 1 (ref) | ·· |
| 1 to <2 | ·· | ·· | ·· | ·· | 0·75 (0·68–1·05) | 0·13 | 0·86 (0·69–1·08) | 0·20 |
| 2 to <3 | ·· | ·· | ·· | ·· | 0·91 (0·70–1·19) | 0·51 | 0·94 (0·73–1·23) | 0·66 |
| ≥3 | ·· | ·· | ·· | ·· | 0·66 (0·51–0·85) | 0·0020 | 0·69 (0·54–0·89) | 0·0040 |
| Refused or unsure | ·· | ·· | ·· | ·· | 0·98 (0·67–1·42) | 0·90 | 0·96 (0·65–1·41) | 0·87 |
| Marital status | ||||||||
| Married or living with partner | ·· | ·· | ·· | ·· | 1 (ref) | ·· | 1 (ref) | ·· |
| Divorced, widowed, separated, never married | ·· | ·· | ·· | ·· | 1·58 (1·33–1·89) | <0·0001 | 1·56 (1·30–1·87) | <0·0001 |
| Health insurance | ||||||||
| No | ·· | ·· | ·· | ·· | 1 (ref) | ·· | 1 (ref) | ·· |
| Private | ·· | ·· | ·· | ·· | 0·65 (0·43–0·98) | 0·039 | 0·69 (0·46–1·04) | 0·075 |
| Medicare or Medicaid | ·· | ·· | ·· | ·· | 0·98 (0·66–1·45) | 0·91 | 0·91 (0·61–1·35) | 0·64 |
| Smoking | ||||||||
| Never | ·· | ·· | ·· | ·· | ·· | ·· | 1 (ref) | ·· |
| Former | ·· | ·· | ·· | ·· | ·· | ·· | 1·15 (0·97–1·37) | 0·10 |
| Current | ·· | ·· | ·· | ·· | ·· | ·· | 1·73 (1·31–2·28) | <0·0001 |
| BMI | ||||||||
| Normal | ·· | ·· | ·· | ·· | ·· | ·· | 1 (ref) | ·· |
| Underweight | ·· | ·· | ·· | ·· | ·· | ·· | 4·01 (2·11–7·97) | <0·0001 |
| Overweight | ·· | ·· | ·· | ·· | ·· | ·· | 0·79 (0·66–0·93) | 0·0060 |
| Obese | ·· | ·· | ·· | ·· | ·· | ·· | 0·91 (0·76–1·08) | 0·24 |
| Diabetes | ·· | ·· | ·· | ·· | ·· | ·· | 1·68 (1·38–2·04) | <0·0001 |
| Hypertension | ·· | ·· | ·· | ·· | ·· | ·· | 1·13 (0·96–1·32) | 0·13 |
| Cardiovascular disease | ·· | ·· | ·· | ·· | ·· | ·· | 1·43 (1·23–1·68) | <0·0001 |
| Stroke | ·· | ·· | ·· | ·· | ·· | ·· | 1·37 (0·33–2·09) | <0·0001 |
HR=hazard ratio. *Model 1 adjusted for age and hearing loss. †Model 2 adjusted for age, hearing loss, sex, race or ethnicity, education, poverty-to-income ratio, marital status, and health insurance. ‡Model 3 adjusted for age, hearing loss, sex, race or ethnicity, education, poverty-to-income ratio, marital status, health insurance, smoking, BMI, diabetes, hypertension, cardiovascular disease, and stroke. §Hearing loss was defined according to audiometry-measured speech-frequency pure-tone average in better hearing ear (continuous variable, in dB HL).
Sensitivity analyses were done considering hearing aid use in two alternative ways. The first sensitivity analysis compared ever hearing aid users (including both regular and non-regular users) to never users. In this analysis, ever hearing aid users were shown to have lower risk of mortality than never users when accounting for age, hearing loss, and demographics (HR 0·77 [95% CI 0·62–0·97]; appendix p 2). However, there was no significant association between hearing aid use and mortality when additionally accounting for medical history (HR 0·83 [0·67–1·03]; appendix p 2). The second sensitivity analysis restricted the cohort to participants from NHANES 2005–12. In this analysis, regular hearing aid use was associated with lower risks of mortality in all three models (HR 0·59 [0·46–0·76]; HR 0·61 [0·47–0·78]; HR 0·64 [0·51–0·81]; appendix p 3).
Discussion
In this study based on a nationally representative sample of US adults, audiometry-measured hearing loss was associated with an increased risk of all-cause mortality. A dose–response relationship was observed, with more severe levels of hearing loss being associated with higher risks of mortality. Among individuals with hearing loss, the risk of mortality was lower among regular hearing aid users than never users in multivariable models accounting for levels of hearing loss, demographics, and medical history.
The results from the present study are consistent with findings from previous epidemiological studies, which have found significant associations between hearing loss and mortality, as well as a dose–response relationship.4,5 By contrast, studies examining the association between hearing aid use and mortality reported inconsistent results probably related to heterogeneity in the duration of follow-up, measures of hearing loss (self-reported vs audiometry-based), and low numbers of hearing aid users.7,8,11,12 Adjustment for audiometry-measured hearing is important in this analysis as individuals with worse levels of hearing (who are more likely to be older, have medical comorbidities, and have higher mortality risks)4,21 are more likely to adopt hearing aids. One study based on a cohort of older adults in Iceland adjusting for audiometry-measured hearing reported a significant association between hearing aid use and lower risks of all-cause mortality at 5 years of follow-up, consistent with findings from this study.7 Our study, which included longer follow-up results, provides mortality data over an extended period and identifies a potential long-term benefit of hearing aid use.
Notably, baseline differences were present between the two groups, with regular hearing aid users generally having a higher socioeconomic status and fewer medical comorbidities, as shown in previous literature.22,23 Additionally, regular hearing aid use might be an indicator that an individual is more health conscious and more likely to follow up with medical appointments. In our cohort, the results remained significant after adjusting for relevant factors including demographics, income, education, insurance, and other medical comorbidities. Although we are unable to account for residual confounding effects, these findings warrant future research to explore the potential protective effect of hearing aids against mortality when used regularly among adults with hearing loss. In this study, insurance status was included as a covariate representing one aspect of access to health care. However, this study could not account for other dimensions of access to health care (eg, acceptability, availability, and accommodation)24 due to unavailable data. Notably, regular hearing aid users are more likely to have better access to health care across all dimensions, which are positively correlated with mortality status. Additionally, potential mediators such as levels of loneliness, social interaction, and social engagement were not available in these data. Previous studies have shown associations between hearing loss and loneliness, as well as between loneliness and mortality.25,26 Hearing aid use has been found to have a positive effect on reducing feelings of loneliness, social isolation, and depression, which could have contributed to the lowered mortality risk.27,28 An alternative perspective could suggest loneliness and social engagement as confounders, as individuals who decide to use hearing aids might have lower levels of loneliness and higher levels of social engagement at baseline, which could confound the results.29 Even in this case, we expect the positive effects of hearing aid use on mental health measures to persist in adults with higher baseline levels of social interaction.
Multiple mechanisms have been proposed to explain the association between hearing loss and mortality.5,19 The first possible mechanism involves common pathology that affects both hearing and comorbidities leading to death, such as cardiovascular disease, diabetes, and dementia. If the association is fully attributed to this mechanism, hearing aid use would not modify the risk of mortality. The second possible mechanism operates via the effect of hearing loss on frailty, an ageing-related syndrome of physiological decline, characterised by marked vulnerability to adverse health outcomes and a strong independent predictor of mortality.30 Auditory deprivation resulting from hearing loss, with diminished input itself, might negatively affect brain structure.31 Furthermore, the association between hearing loss and frailty is mediated by deterioration in mental, physical, and cognitive functioning (eg, social isolation, anxiety, depression, decreased physical activity, and cognitive impairment).32 The effects of hearing loss on poor patient–clinician communication have also been suggested to be a contributing factor to increased risks of hospital admission and health-care costs among older adults with untreated hearing loss.33 For individuals with hearing loss who would benefit from hearing aids, their use in medical settings might enhance effective patient–clinician communication and further contribute to improved health outcomes.
Collectively, these results suggest the need to investigate the effect of hearing aid use in downstream health outcomes and mortality in longitudinal and randomised controlled studies. Longitudinal studies with an enhanced design incorporating comprehensive information on hearing loss, hearing aid use and potential confounders, and mediators are necessary. Although conducting a randomised controlled trial of hearing aid use on mortality is probably not feasible, future trials that examine the effect of hearing aid use on intermediate health outcomes across social, mental, physical, and cognitive domains would enhance our understanding of the relationship between hearing aid use and mortality. For example, the ACHIEVE study, a randomised controlled trial involving older adults with untreated hearing loss, investigated the effects of hearing aid use on changes in cognitive functioning.34 Recently published 3-year follow-up results have shown a 48% reduction in cognitive decline associated with hearing aid use in a subgroup of older adults at an increased risk for cognitive decline.34
The prevalence of regular hearing aid use among adults with hearing loss was low at 12·7% in our study, consistent with findings from the previous literature ranging from 7% to 37%.22,35 Many factors account for the low rates of hearing aid use including cost, complexity of the hearing health-care system, lack of awareness of treatment options and consequences of long-standing hearing loss, and stigma associated with hearing loss and hearing aid use.18 Previous studies have demonstrated disparities in hearing aid use especially among racial or ethnic minorities and individuals with low socioeconomic status.17,36 There should be additional efforts to improve accessibility and affordability of hearing aids and to address disparities in hearing health care as evidence of the potential protective role of hearing aid use against adverse health outcomes emerges.
We identified various limitations in this study. First, despite adjusting for multiple major confounders, residual confounding effects from other factors that were not included in the study cannot be excluded. Our results accounted for all available potential confounders including demographics and medical comorbidities. However, potential confounders and mediators that have implications in understanding the mechanism behind the associations between hearing loss or hearing aid use and mortality, such as depression, social engagement, and cognition were not available in this study. Second, detailed information on hearing loss (eg, type, duration, cause of hearing loss, and speech understanding) and hearing aid use (eg, change in hearing aid use status, duration of hearing aid use, hearing aid type, level of amplification, objective data on hearing aid use such as daily logs, and perceived benefits) was unavailable in this study. Regular hearing aid use was defined on the basis of three different questions on frequency of hearing aid use which changed over the NHANES cycles. The results might vary by different definitions that have been adapted for regular hearing aid use. We conducted sensitivity analyses using different definitions of hearing aid use. Finally, this is a mortality follow-up study based on cohorts from NHANES, which is a cross-sectional study. As such, changes in measures including hearing aid use status after NHANES participation were not available. If a substantial number of participants who reported never using hearing aids have since adopted regular use after participating in the study, the association between regular hearing aid use and mortality in this study might have been underestimated.
Hearing loss has been identified as a potentially modifiable risk factor for adverse health outcomes and mortality. This study, based on a nationally representative sample of US adults, demonstrated that regular hearing aid use was significantly associated with a lower risk of mortality. The replication of our study’s findings in future research with more enhanced study designs is imperative. This should encompass randomised controlled trials investigating the effect of hearing aid use on a spectrum of health outcomes linked to mortality, alongside large-scale longitudinal studies that incorporate comprehensive data on hearing aid use and pertinent confounding and mediating variables.
Supplementary Material
Research in context.
Evidence before this study
We searched PubMed from database inception to June 1, 2023, for articles on the association between hearing aid use and mortality using the search terms (“hearing aid”) AND (“mortality” OR “death”) AND (“adults” OR “aged”) AND (“cohort studies” OR “longitudinal studies” OR “prospective studies”) with no date or language restrictions. The search retrieved 54 results and we also reviewed the cited references of retrieved publications. An additional search was done in PubMed on June 1, 2023, to identify articles on the association between hearing loss and mortality using the search terms (“hearing loss” OR “hearing impairment”) AND (“mortality” OR “death”) AND (“adults” OR “aged”) AND (“cohort studies” OR “longitudinal studies” OR “prospective studies”) which retrieved 508 results. Previous work including two systematic reviews and one meta-analysis showed significant association between hearing loss and mortality and its dose–response relationship. However, much of the previous work investigated the association between hearing loss and mortality without adjusting for hearing aid use. Among five studies that have included hearing aid use as a covariate, two studies have reported secondary effect measures of hearing aid use while accounting for audiometry-measured hearing loss. Of these two, one study based on older adults in Iceland (aged 67 years and older, 934 hearing aid users) demonstrated a significantly lower risk of mortality among hearing aid users than in non-users in a subgroup of older adults with impairments in both hearing and vision. Another study based on US community-dwelling older adults (aged 70 years and older, 250 hearing aid users) demonstrated no significant association between hearing aid use and mortality. Only one study has primarily investigated the association between hearing aid use and long-term health outcomes including mortality. This study, which was based on a population-based study including US community-dwelling adults and a small number of hearing aid users (aged 48 years and older, 69 hearing aid users), found no association between hearing aid use and mortality. In our literature review, no previous studies have examined the association between hearing aid use and mortality using a nationally representative sample of US adults.
Added value of this study
This study included a national sample of US adults who participated in the cross-sectional study of the National Health and Nutritional Examination Survey between 1999 and 2012. In multivariable models that accounted for potential confounders, we found that adjusted all-cause mortality risk was lower among regular hearing aid users than among those who never used hearing aids. To our knowledge, this study represents the most comprehensive analysis to date regarding the association between hearing aid use and mortality. Our study findings provide a long-term assessment of the association between hearing aid use and mortality, based on robust data that can be generalisable to the US population.
Implications of all the available evidence
The current study shows the potential protective role of hearing aid use against mortality for adults with hearing loss. Baseline differences exist between hearing aid users and never users, in addition to unmeasured mediators that might have contributed to the observed mortality differences. Taken together, existing evidence supports larger-scale longitudinal studies and randomised controlled trials that incorporate comprehensive hearing and hearing aid use data to elucidate the effect of hearing health on healthy longevity. Clinicians should continue to promote regular hearing aid use among adults with hearing loss when indicated.
Footnotes
Declaration of interests
JSC received a grant from the Lions Hearing Foundation. MEA reports serving on a medical advisory council to Advanced Bionics. FRL reports being a consultant to Frequency Therapeutics and Apple and the Director of a public health research centre funded in part by a philanthropic donation from Cochlear to the Johns Hopkins Bloomberg School of Public Health.
Contributor Information
Janet S Choi, Caruso Department of Otolaryngology-Head & Neck Surgery, University of Southern California, Los Angeles, CA, USA.
Meredith E Adams, Department of Otolaryngology-Head & Neck Surgery, University of Minnesota, Minneapolis, MN, USA.
Eileen M Crimmins, Davis School of Gerontology, University of Southern California, Los Angeles, CA, USA.
Frank R Lin, Department of Otolaryngology-Head & Neck Surgery, Johns Hopkins University School of Medicine, Baltimore, MD, USA.
Jennifer A Ailshire, Davis School of Gerontology, University of Southern California, Los Angeles, CA, USA.
Data sharing
The data and codebooks for the NHANES and the corresponding mortality follow-up are publicly available on the study’s website. NHANES data are available at the following link: https://wwwn.cdc.gov/nchs/nhanes/. Mortality data are accessible through the following link: https://www.cdc.gov/nchs/data-linkage/mortality-public.htm.
References
- 1.GBD 2016 Dementia Collaborators. Global, regional, and national burden of Alzheimer’s disease and other dementias, 1990-2016: a systematic analysis for the Global Burden of Disease Study 2016. Lancet Neurol 2019; 18: 88–106. [DOI] [PMC free article] [PubMed] [Google Scholar]
- 2.Lawrence BJ, Jayakody DMP, Bennett RJ, Eikelboom RH, Gasson N, Friedland PL. Hearing loss and depression in older adults: a systematic review and meta-analysis. Gerontologist 2020; 60: e137–54. [DOI] [PubMed] [Google Scholar]
- 3.Loughrey DG, Kelly ME, Kelley GA, Brennan S, Lawlor BA. Association of age-related hearing loss with cognitive function, cognitive impairment, and dementia: a systematic review and meta-analysis. JAMA Otolaryngol Head Neck Surg 2018; 144: 115–26. [DOI] [PMC free article] [PubMed] [Google Scholar]
- 4.Hsu AK, McKee M, Williams S, et al. Associations among hearing loss, hospitalization, readmission and mortality in older adults: a systematic review. Geriatr Nurs 2019; 40: 367–79. [DOI] [PubMed] [Google Scholar]
- 5.Tan BKJ, Ng FYC, Song HJJMD, Tan NKW, Ng LS, Loh WS. Associations of hearing loss and dual sensory loss with mortality: a systematic review, meta-analysis, and meta-regression of 26 observational studies with 1 213 756 participants. JAMA Otolaryngol Head Neck Surg 2022; 148: 220–34. [DOI] [PMC free article] [PubMed] [Google Scholar]
- 6.Borre ED, Kaalund K, Frisco N, et al. The impact of hearing loss and its treatment on health-related quality of life utility: a systematic review with meta-analysis. J Gen Intern Med 2023; 38: 456–79. [DOI] [PMC free article] [PubMed] [Google Scholar]
- 7.Fisher D, Li CM, Chiu MS, et al. Impairments in hearing and vision impact on mortality in older people: the AGES-Reykjavik Study. Age Ageing 2014; 43: 69–76. [DOI] [PMC free article] [PubMed] [Google Scholar]
- 8.Genther DJ, Betz J, Pratt S, et al. Association of hearing impairment and mortality in older adults. J Gerontol A Biol Sci Med Sci 2015; 70: 85–90. [DOI] [PMC free article] [PubMed] [Google Scholar]
- 9.Yamada M, Nishiwaki Y, Michikawa T, Takebayashi T. Impact of hearing difficulty on dependence in activities of daily living (ADL) and mortality: a 3-year cohort study of community-dwelling Japanese older adults. Arch Gerontol Geriatr 2011; 52: 245–9. [DOI] [PubMed] [Google Scholar]
- 10.Amieva H, Ouvrard C, Meillon C, Rullier L, Dartigues JF. Death, depression, disability, and dementia associated with self-reported hearing problems: a 25-year study. J Gerontol A Biol Sci Med Sci 2018; 73: 1383–89. [DOI] [PubMed] [Google Scholar]
- 11.Liljas AE, Wannamethee SG, Whincup PH, et al. Hearing impairment and incident disability and all-cause mortality in older British community-dwelling men. Age Ageing 2016; 45: 662–67. [DOI] [PMC free article] [PubMed] [Google Scholar]
- 12.Dawes P, Cruickshanks KJ, Fischer ME, Klein BE, Klein R, Nondahl DM. Hearing-aid use and long-term health outcomes: Hearing handicap, mental health, social engagement, cognitive function, physical health, and mortality. Int J Audiol 2015; 54: 838–4. [DOI] [PMC free article] [PubMed] [Google Scholar]
- 13.Centers for Disease Control and Prevention. National Health and Nutrition Examination Survey (NHANES) audiometry procedures manual. 2011. https://wwwn.cdc.gov/nchs/data/nhanes/2011-2012/manuals/Audiometry_Procedures_Manual.pdf (accessed Dec 1, 2022).
- 14.WHO. Report of the informal working group on prevention of deafness and hearing impairment programme planning. Geneva, 18–21 June 1991. 1991. https://iris.who.int/bitstream/handle/10665/58839/WHO_pDH_91.1.pd?sequence=1 (accessed Dec 1, 2022). [Google Scholar]
- 15.Centers for Disease Control and Prevention. National Center for Health Statistics Data Linkage. 2019 public-use linked mortality files. 2022. https://www.cdc.gov/nchs/data-linkage/mortality-public.htm (accessed Dec 1, 2022).
- 16.Choi JS, Betz J, Deal J, et al. A comparison of self-report and audiometric measures of hearing and their associations with functional outcomes in older adults. J Aging Health 2016; 28: 890–910. [DOI] [PMC free article] [PubMed] [Google Scholar]
- 17.McKee MM, Choi H, Wilson S, DeJonckheere MJ, Zazove P, Levy H. Determinants of hearing aid use among older Americans with hearing loss. Gerontologist 2019; 59: 1171–81. [DOI] [PMC free article] [PubMed] [Google Scholar]
- 18.Ng JH, Loke AY. Determinants of hearing-aid adoption and use among the elderly: a systematic review. Int J Audiol 2015; 54: 291–300. [DOI] [PubMed] [Google Scholar]
- 19.Trott M, Smith L, Xiao T, et al. Hearing impairment and diverse health outcomes: an umbrella review of meta-analyses of observational studies. Wien Klin Wochenschr 2021; 133: 1028–41. [DOI] [PubMed] [Google Scholar]
- 20.Centers for Disease Control and Prevention. National Health and Nutrition Examination Survey methods and analytic guidelines. 2022. https://wwwn.cdc.gov/nchs/nhanes/analyticguidelines.aspx (accessed Dec 1, 2022).
- 21.Deal JA, Reed NS, Kravetz AD, et al. Incident hearing loss and comorbidity: a longitudinal administrative claims study. JAMA Otolaryngol Head Neck Surg 2019; 145: 36–43. [DOI] [PMC free article] [PubMed] [Google Scholar]
- 22.Bainbridge KE, Ramachandran V. Hearing aid use among older US adults; the National Health and Nutrition Examination Survey, 2005–2006 and 2009–2010. Ear Hear 2014; 35: 289–94. [DOI] [PMC free article] [PubMed] [Google Scholar]
- 23.Laplante-Lévesque A, Hickson L, Worrall L. What makes adults with hearing impairment take up hearing AIDS or communication programs and achieve successful outcomes? Ear Hear 2012; 33: 79–93. [DOI] [PubMed] [Google Scholar]
- 24.McLaughlin CG, Wyszewianski L. Access to care: remembering old lessons. Health Serv Res 2002; 37: 1441–43. [DOI] [PMC free article] [PubMed] [Google Scholar]
- 25.Rico-Uribe LA, Caballero FF, Martín-María N, Cabello M, Ayuso-Mateos JL, Miret M. Association of loneliness with all-cause mortality: a meta-analysis. PLoS One 2018; 13: e0190033. [DOI] [PMC free article] [PubMed] [Google Scholar]
- 26.Shukla A, Harper M, Pedersen E, et al. Hearing loss, loneliness, and social isolation: a systematic review. Otolaryngol Head Neck Surg 2020; 162: 622–33. [DOI] [PMC free article] [PubMed] [Google Scholar]
- 27.Weinstein BE, Sirow LW, Moser S. Relating hearing aid use to social and emotional loneliness in older adults. Am J Audiol 2016; 25: 54–61. [DOI] [PubMed] [Google Scholar]
- 28.Choi JS, Betz J, Li L, et al. Association of using hearing aids or cochlear implants with changes in depressive symptoms in older adults. JAMA Otolaryngol Head Neck Surg 2016; 142: 652–57. [DOI] [PMC free article] [PubMed] [Google Scholar]
- 29.Dawes P, Emsley R, Cruickshanks KJ, et al. Hearing loss and cognition: the role of hearing aids, social isolation and depression. PLoS One 2015; 10: e0119616. [DOI] [PMC free article] [PubMed] [Google Scholar]
- 30.Tian R, Almeida OP, Jayakody DMP, Ford AH. Association between hearing loss and frailty: a systematic review and meta-analysis. BMC Geriatr 2021; 21: 333. [DOI] [PMC free article] [PubMed] [Google Scholar]
- 31.Griffiths TD, Lad M, Kumar S, et al. How can hearing loss cause dementia? Neuron 2020; 108: 401–12. [DOI] [PMC free article] [PubMed] [Google Scholar]
- 32.Tan BKJ, Man REK, Gan ATL, et al. Is sensory loss an understudied risk factor for frailty? A systematic review and meta-analysis. J Gerontol A Biol Sci Med Sci 2020; 75: 2461–70. [DOI] [PubMed] [Google Scholar]
- 33.Shukla A, Nieman CL, Price C, Harper M, Lin FR, Reed NS. Impact of hearing loss on patient-provider communication among hospitalized patients: a systematic review. Am J Med Qual 2019; 34: 284–92. [DOI] [PubMed] [Google Scholar]
- 34.Lin FR, Pike JR, Albert MS, et al. Hearing intervention versus health education control to reduce cognitive decline in older adults with hearing loss in the USA (ACHIEVE): a multicentre, randomised controlled trial. Lancet 2023; 402: 786–97. [DOI] [PMC free article] [PubMed] [Google Scholar]
- 35.Bisgaard N, Ruf S. Findings from EuroTrak surveys from 2009 to 2015: hearing loss prevalence, hearing aid adoption, and benefits of hearing aid use. Am J Audiol 2017; 26: 451–61. [DOI] [PubMed] [Google Scholar]
- 36.Yi JS, Garcia Morales EE, Reed NS, Willink A, Nieman CL. Racial and ethnic differences in hearing aid use among Medicare beneficiaries. J Aging Health 2022; 34: 1117–24. [DOI] [PubMed] [Google Scholar]
Associated Data
This section collects any data citations, data availability statements, or supplementary materials included in this article.
Supplementary Materials
Data Availability Statement
The data and codebooks for the NHANES and the corresponding mortality follow-up are publicly available on the study’s website. NHANES data are available at the following link: https://wwwn.cdc.gov/nchs/nhanes/. Mortality data are accessible through the following link: https://www.cdc.gov/nchs/data-linkage/mortality-public.htm.