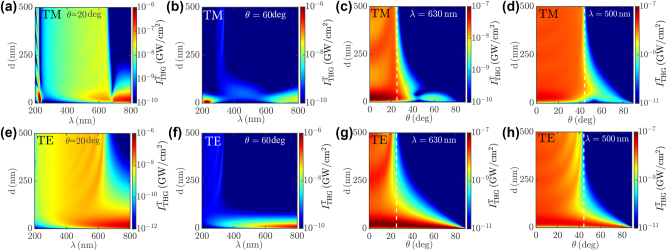
Figure 4:
THG manipulation by Na-based thin films. (a, b, e, f) Dependence of the FW intensity of the THG signal over the thin film thickness d and the pump wavelength λ for incidence angle (a, e) θ = 20° and (b, f) θ = 60°. (c, d, g, h) Dependence of over the thin film thickness d and the pump incidence angle θ for wavelength (c, g) λ = 630 nm and (d, h) λ = 500 nm. All plots refer to either (a–d) TM or (e–h) TE polarization of the pump field. The white dashed vertical lines in (c, d, g, h) indicate the NZI critical angle θ NZI(λ/3). All plots are obtained for fixed pump intensity I 0 = 100 GW/cm2.

