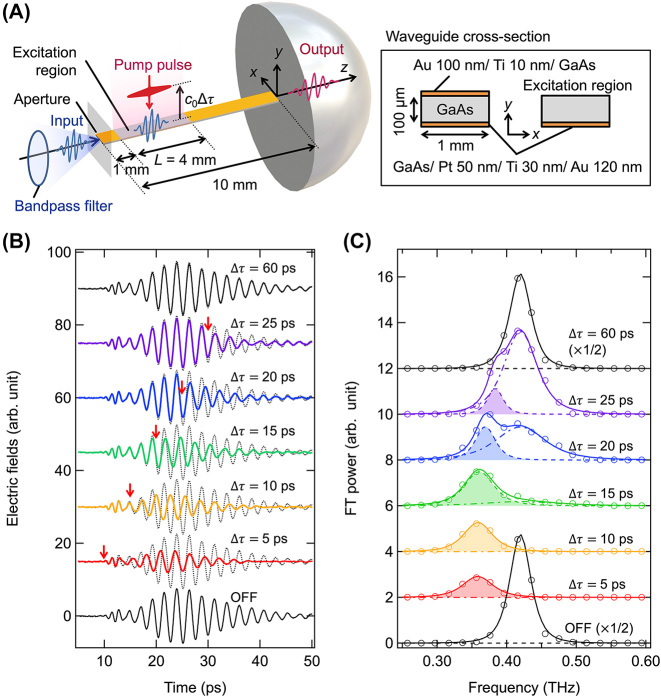
Figure 2:
Experimental setup and observed terahertz waves. (A) Schematic of the GaAs waveguide and the experimental setup. (B) Time-domain waveforms of the terahertz wave packets passing through the waveguide with and without the pump pulses (solid lines). Each electric field waveform is offset for varying pump timing Δτ. The waveforms without pump laser pulses are superimposed on each waveform with the dotted lines. The start time of the waveform changes is indicated by the red arrows. (C) Fourier-transformed power spectra (open circles) of the waveforms in panel (B). Solid lines indicate the curves fitted with the two Lorentzian functions of Equation (13). Dot-dashed and dashed lines indicate the spectral components before and after the frequency conversion in the fitted curves, respectively. The areas of the frequency-converted components are shaded.

