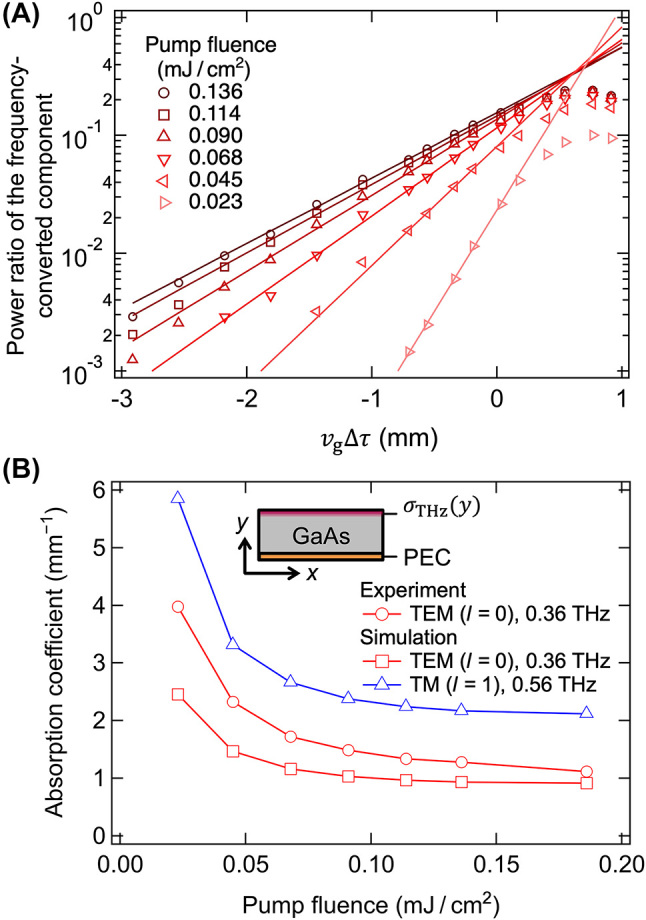
Figure 6:

Impact of pump pulse fluence on power and attenuetion coefficients of frequency-converted terahertz waves. (A) Power ratio of the frequency-converted terahertz waves with and without the pump pulse when its fluence is varied. The lines are fitted with exponential functions. (B) Attenuation coefficients obtained from the experiment and simulation. The experimental results are obtained from the fitting lines in panel (A) and Figure 4(C). The inset represents the schematic cross-section of the simulation model. A two-dimensional waveguide whose bottom surface was defined as a perfect electric conductor (PEC) and the upper surface was defined to exhibit the conductivity distribution described in Figure S3(B) and Equation (14).
