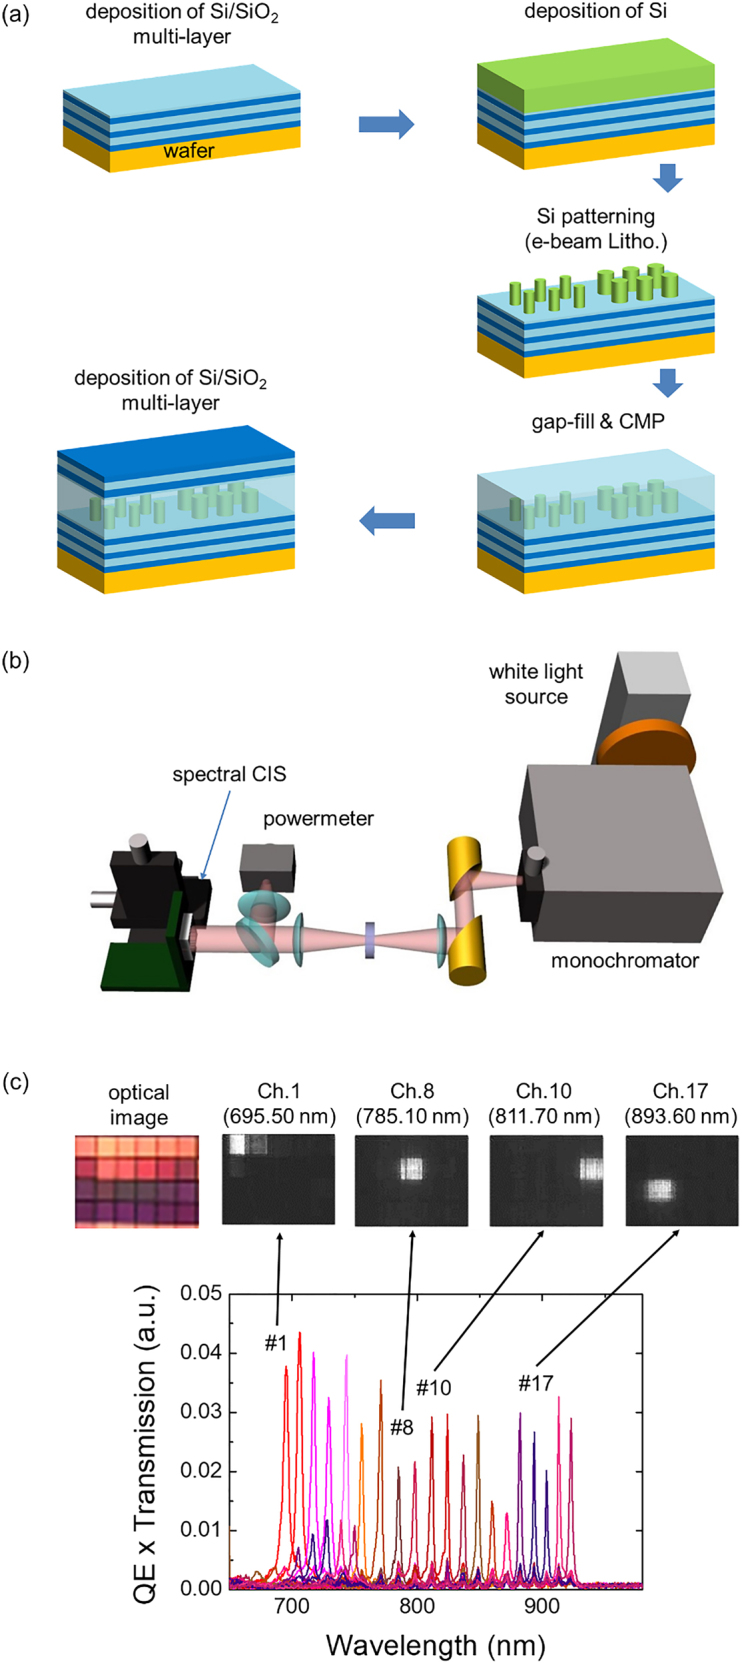
Figure 3:

Characterization of meta-spectral imager. (a) Schematic of the whole fabrication processes. (b) Schematic of the spectral imager characterization setup. (c) Measured characteristic spectra of the spectral imager. Top rows are images of some channels taken by the spectral imager. As the incident wavelength increased, the bright channel moves from top-left (the first channel) to bottom-right (the twentieth channel).
