Abstract
Amperometry is a commonly used electrochemical method for studying the process of exocytosis in real-time. Given the high precision of recording that amperometry procedures offer, the volume of data generated can span over several hundreds of megabytes to a few gigabytes and therefore necessitates systematic and reproducible methods for analysis. Though the spike characteristics of amperometry traces in the time domain hold information about the dynamics of exocytosis, these biochemical signals are, more often than not, characterized by time-varying signal properties. Such signals with time-variant properties may occur at different frequencies and therefore analyzing them in the frequency domain may provide statistical validation for observations already established in the time domain. This necessitates the use of time-variant, frequency-selective signal processing methods as well, which can adeptly quantify the dominant or mean frequencies in the signal. The Fast Fourier Transform (FFT) is a well-established computational tool that is commonly used to find the frequency components of a signal buried in noise. In this work, we outline a method for spike-based frequency analysis of amperometry traces using FFT that also provides statistical validation of observations on spike characteristics in the time domain. We demonstrate the method by utilizing simulated signals and by subsequently testing it on diverse amperometry datasets generated from different experiments with various chemical stimulations. To our knowledge, this is the first fully automated open-source tool available dedicated to the analysis of spikes extracted from amperometry signals in the frequency domain.
Keywords: Statistical analysis, Frequency analysis, Fourier transform, Amperometry, Mean frequency
Subject terms: Electrophysiology, Software, Statistical methods, Biophysics, Computational biology and bioinformatics, Physics, Biological physics
Introduction
Amperometry is a commonly used method for studying the process of exocytosis in real time. It is useful in analyzing exocytosis because it offers high sensitivity, excellent temporal resolution, precise quantification of released neurotransmitters, and enables direct observation of the kinetics of secretory events as it happens1–3. Amperometric traces are generated by the oxidation of catecholamines released by a cell close to the microelectrode tip. The exocytosis process has been well-studied and typically progresses in the following molecular steps: steps: 1 Opening of the fusion pore resulting in the detection of the Pre-Spike Foot or PSF (indicated by the foot parameters , , in Fig. 1) steps: 2 Expansion of the fusion pore resulting in massive release of catecholamines shown as a spike in the amperometric recording (steep rising phase characterized by in Fig. 1) steps:3 A decay phase caused by the pore closure ((double) exponential falling phase characterized by in Fig. 1). The frequency and shape of amperometry spikes and their sequence contain information about the dynamics of the release process, while their areas correspond to the total charge or the number of molecules released4,5. Statistical analysis of these spikes can offer insights into patterns and correlations across different samples, with high reliability and generalisability for relatively modest time and resource costs.
Figure 1.
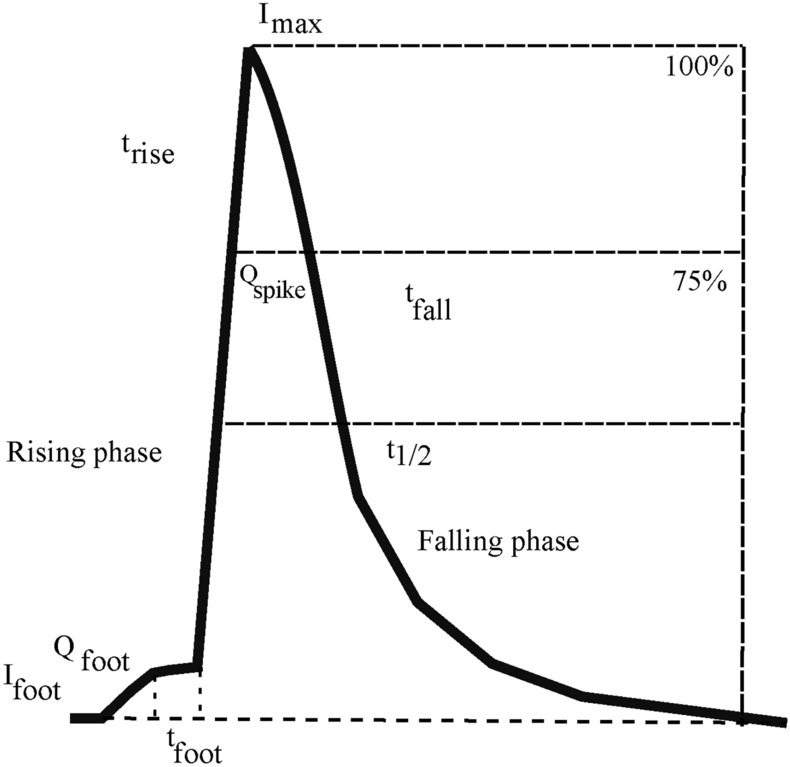
Spike parameters in the time domain: an amperometric spike is characterized by the Pre-Spike Foot (PSF), rising phase, spike and the falling phase. Here is the peak current, is the rise time (from to of ), is the half peak width, is the PSF current, is the PSF duration, is the charge of the spike and is the charge of the PSF.
The microelectrode material is chosen based on it allowing high-throughput fabrication, fine spatial resolutions and fast analysis rates for single-cell analysis - most often this is carbon6. Spikes generated during the exocytosis process may contain information about cell types or activity states of the cell. These spikes exhibit large temporal variability, and also depend on the type of stimulation used to induce exocytosis by the cell. Usually, the falling phase of a spike can be fitted by a single or double exponential function due to the diffusion mechanism. Quantification of electroactive neurotransmitters (e.g. catecholamines) can be accomplished using different techniques based on amperometry. Single cell amperometry (SCA) was first introduced by Wightman and colleagues in the 1990s7. It employs a carbon microelectrode that is placed on a single cell in buffer with the assistance of a microscope. A reference electrode is located nearby in the same solution. The cell is (chemically) stimulated, after which it releases neurotransmitters from vesicles docked at the cell membrane. Since a constant potential is applied, the neurotransmitters are oxidized at the working electrode, leading to current “spikes” when this data is plotted versus time. Integration of these signals gives the charge Q, which, using Faraday’s law, allows quantification of the number of molecules involved in the “spike”8.
Another amperometric method, which does not measure the number of released molecules, but uses the same amperometric principle to quantify the contents of the vesicles that store neurotransmitters is VIEC (Vesicle Impact Electrochemical Cytometry). VIEC allows isolated vesicles to adsorb to a microelectrode which then burst stochastically, after which the electroactive contents are oxidized on the electrode surface. Similar to SCA, the number of molecules can then be quantified by examining the resulting current spikes9,10. Intracellular VIEC (IVIEC), employs a nanotip electrode that is inserted into a single cell11. This allows quantification of vesicular content inside a cell. By combining with SCA and comparing the number of molecules, different exocytotic modes can be investigated (e.g., kiss and run, partial release, and full release). Indeed, it has been found that exocytosis is a highly modulated process, and that partial release of vesicular content is preferred over all-or-nothing exocytosis both in vitro and in vivo8,9,12–14. Vesicle impact electrochemical cytometry offers a direct quantification of vesicular catecholamine storage in isolated vesicles. VIEC is similar to IVIEC, but instead of in situ quantification of vesicle content in a living cell, vesicles are isolated and collected as a suspension in an intracellular physiological buffer to perform electrochemical cytometry15.
Not unlike modern electrophysiological experiments, amperometry experiments also involve the acquisition, display, and analysis of data16. Given the high precision during recording amperometry, the volume of data generated can span over several hundreds of megabytes to a few gigabytes. Several well-structured programs that facilitate the analysis of such data exist in the electrochemistry community, the most commonly used being IgorPro QuantaAnalysis software5. QuantaAnalysis is a mature software dedicated to the analysis of amperometry traces that allows digital filtering and analysis of the current noise, spike identification, calculation of over 20 spike kinetic parameters, and visualization. The most commonly measured spike characteristics include the area under the spike (such as or ), spike maximal height () and spike width () at half its height (where ) as illustrated in Fig. 1.
Along with this, the QuantaAnalysis software outputs several other spike parameters in a matrix form (similar to that shown in Fig. 7B) that enables spike-wise or average characterization of specific traces. However, the QuantaAnalysis software involves semi-manual intervention for identifying thresholds for spikes extraction, selecting baseline intervals, and data manipulations in Excel. Furthermore, each amperometric trace has to be handled separately in QuantaAnalysis, which significantly affects the efficiency of the process. In addition, applications of neurochemistry to amperometry and their applications in single-cell analysis, is still a maturing area and because of the complex nature of the data, methods to analyze traces may vary considerably from lab to lab, thereby making it difficult to compare observations from different sources17.
Figure 7.
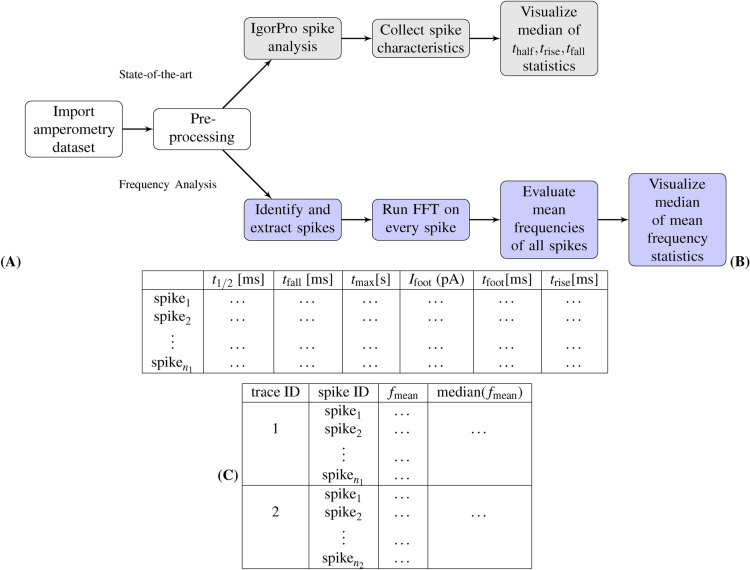
Analysis of amperometry traces: (A) a comparison between the workflow adopted by the “state-of-the-art” method, which uses QuantaAnalysis to analyze time-domain spike parameters of the trace, and the proposed “frequency analysis” method, which analyzes the spikes in the frequency domain. (B) shows an overview of the output time, current and charge parameters in the time domain. (C) shows an overview of the output parameters in the frequency domain, mean frequencies and their median within each trace. The frequency analysis method provides a statistical validation for the state-of-the-art.
Further, though one can argue that the spike characteristics of amperometry traces in the time domain hold information about the dynamics of exocytosis, these biochemical signals are more often than not characterized by time-varying signal properties (i.e. from the statistical perspective, they are non-stationary). Such signals with time-variant properties may occur at different frequencies and it may be difficult to catch subtle differences in their patterns by only using time-domain observations. This necessitates the use of time-variant, frequency-selective signal processing methods as well, which can ably quantify the dominant or mean frequencies in the signal.
The Fast Fourier Transform (FFT) is a well-established computational tool that is commonly used to find the frequency components of a signal buried in noise18–23. It is based on the Fourier Analysis method which states that any periodic function can be represented as an infinite enumerable sum of trigonometric functions24. FFT is a method for efficiently computing the Discrete Fourier Transform (DFT) of time series and facilitates power spectrum analysis and filter simulation of signals. All these measures are time-variant. Frequency analysis has found itself a wide variety of applications including digital image processing reconstruction, numerical solution of differential equations, multiple time series analysis, and filtering among many others25–28. In the biomedical signal processing community, the FFT is widely used in Electroencephalogram (EEG), Magnetoencephalography (MEG), EMG (Electromyogram), functional Multineuron Calcium Imaging (fMCI), analysis of calcium fluorescence traces, and Diffusion Tensor Imaging (DTI) data29,30.
In this work, we develop a method for spike-by-spike frequency analysis of amperometry traces and show that in addition to gaining information on the key frequencies, this method can provide statistical validation of observations made on traces in the time domain. We motivate this method through the relationship of spike width and mean frequency wherein thin spikes that arise out of high-frequency oscillations are expected to have higher mean frequency compared to their wider counterparts (such as that in the illustration Fig. 2). Amperometry traces show a variety of spike shapes intra-trace and inter-traces whose statistics usually remain consistent across a given stimulation and cell type. Hence it provides a very interesting field of research for frequency analysis methods. In addition, the frequency analysis pipeline dedicated for amperometry traces that we implemented in Python is available open-source (refer to supplementary section).
Figure 2.
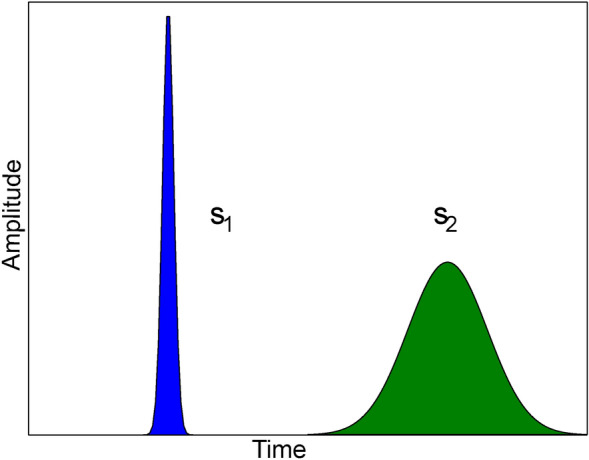
Relationship between spike shape and mean frequency: Consider two spikes coming out of an amperometric trace, representing a high frequency oscillation (hence a thin spike) and representing a low frequency oscillation (and hence a wide spike). We expect that the wider the curve, the lower is the mean frequency i.e. .
Frequency-domain analysis reveals distinct characteristics of vesicle fusion and neurotransmitter release, including the speed of exocytosis and the stability of the fusion pore. These insights help differentiate exocytosis modes and assess the influence of external factors on cellular behavior. The mean frequency is defined as the energy-weighted average of the frequency components within a spike, calculated using the Fast Fourier Transform (FFT). This value represents the central tendency of the spike’s frequency content, providing a summary measure of its oscillatory behavior.
The paper is organized as follows: first, we motivate the idea of frequency analysis with simulated signals as a proof-of-concept, followed by outlining the key results for the aforementioned candidate datasets, and then we summarize the work and give brief conclusions. Finally, we go in-depth about the FFT and briefly describe the package implementation. Further details on the experimental methods for data generation, dataset attributes, and frequency analysis program may be found in the supplementary information section.
Results and discussion
Overview of the datasets
We demonstrate the method by utilizing simulated signals and subsequently test it on diverse amperometry datasets generated through different experiments under different stimulation conditions. Simulated signals or artificial spike trains were generated through spikes modeled with a linear rise and Gaussian decay. The three candidate datasets we chose to explore in the frequency domain are steps: 1 Hofmeister series dataset31, steps: 2 Dimethyl Sulfoxide (DMSO) dataset32, and steps: 3 Electrodes dataset (first presented in this study). The Hofmeister series dataset makes an excellent candidate to demonstrate that the spike-by-spike frequency analysis method preserves time-domain spike characteristics. The investigation of the relationship between inorganic anions and exocytosis was carried out by He et al.31 and it was shown that anions regulate pore geometry, opening duration, and pore closure in the exocytosis process.
Specifically, when chromaffin cells were stimulated by counteranions along the Hofmeister series (from , , , , ) in solution, the spike width (including , and ) increases and the PSF parameters (including , and where N is the number of molecules and I is the current) decreases in the Hofmeister order while the number of spike events appears to be similar across all stimulations. With the stimulation of chaotropic anions (such as ), the expansion and closing time of the fusion pore is longer when compared to that of kosmotropic ions (such as ). The Hofmeister series dataset has therefore been well-studied in the time domain.
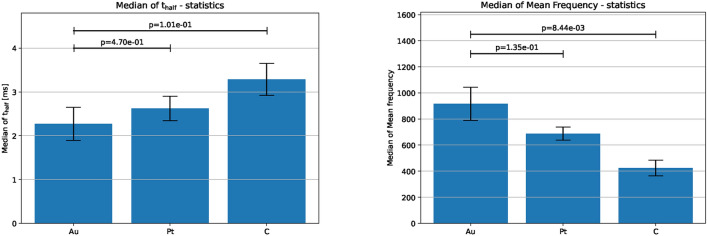
Another compound, DMSO has also been shown to affect the fusion pore opening rate and increase neurotransmitter content while leaving vesicular contents unchanged. Unlike for example, the Hofmeister series, DMSO affects only the rising phase, . The DMSO dataset was generated through IVIEC experiments conducted on chromaffin cells using a nanotip electrode. Analysis of control and DMSO datasets in the time domain has been established and hence makes an interesting dataset for frequency analysis. We also demonstrate frequency analysis methods on the electrode dataset which constitute VIEC experiments on chromaffin vesicles using three electrode materials: carbon, platinum, and gold. Sample amperometric traces of all the above datasets are shown in Fig. 18, 19 and 20 of the supplementary section.
Hypothesis verification using simulated signals
To verify the hypothesis of the relationship between spike shape and mean frequency, we generated simulated signals that mimic the behavior of the Hofmeister ions in the time domain. Simulated to mimic the amperometry spikes, the artificial spikes consist of a linear rising segment and a Gaussian decay. Note that Gaussian decay models an exponentially decaying amperometry spike which simulates the signal decay more accurately compared to Dirac delta spikes.
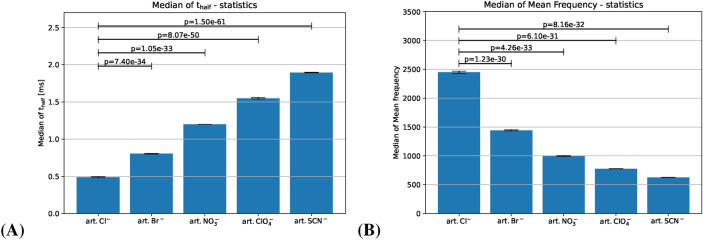
The artificially generated set of spike trains mimics the behaviors of the Hofmeister series dataset observed in the time domain, e.g. kosmotropic anions in the Hofmeister series cause thin spikes (hence high-frequency oscillations) in comparison to the wide spikes (low-frequency oscillations) of the chaotropic ions. In other words, in the time domain, the median of the spike width, , of the artificial spikes increases in average along the “Hofmeister” order (see Fig. 3).
Figure 3.
FFT on simulated signals: (A) Spike characteristics in the time domain shown by median of . (B) Spike characteristics in the frequency domain shown by median of mean frequency, . Hofmeister-like arrangement of mean frequency in the simulated spike trains (“art” stands for artificial). Standard error of mean of the median of and the median of mean frequency are shown by the error bars. Bars represent the mean of the medians of t-half across multiple simulated signals, with error bars representing the standard error of the mean of the medians.....
Thus we artificially assigned each anion type in the artificial data with a range of width that does not overlap with the others, as can be seen in Fig. 3A. Since the number of samples generated per artificial data category was sufficient and homogeneous across categories, we see that the width of standard error of mean bar is quite short and relatively consistent across all categories along with high standard error. In addition, for a detailed description of artificial data generation procedure refer to the supplementary section.
We found that the averaged mean frequency of the artificially generated spike trains decreases along the Hofmeister order with no exception, which is consistent with the observations on real data. Since a thinner sine function oscillates with a higher frequency, a kosmotropic anion like will behave similarly, as can be seen from Fig. 3B. Relationship between spike shape and frequency and their influences on spike morphology with explanations on spike detection, and comparison of corresponding sine wave frequency components and Gaussian decay model is discussed in detail in the supplementary section.
Comparison across datasets
The mean frequency was selected as a representative metric for spike analysis as it captures the central tendency of the frequency components within each spike, weighted by their amplitudes. While the distribution of frequencies for an individual spike may not be normal, the mean frequency provides a consistent and interpretable summary of the overall oscillatory behavior of the spike. This choice allows for a robust comparison of spikes across different experimental conditions, without assuming normality in the underlying frequency distribution. The median of the mean frequency represents the overall frequency content of the spike and can be associated with different time-domain parameters, such as t-rise or t-half, depending on the experimental conditions. This relationship reflects the influence of exocytosis dynamics on the frequency components of the spike. In new data, this frequency indicator can be used to infer shifts in vesicle fusion dynamics or exocytosis duration based on how it correlates with known time-domain parameters.
Given that the distribution of t-half (spike width) values is often non-normal, we use the median as a measure of central tendency. The median is more robust to outliers and skewed distributions compared to the mean, making it an appropriate choice for summarizing the spike width across different experimental conditions.
To compare across different datasets or experimental conditions, we compute the mean of the medians of t-half. This allows us to provide an overall summary of the central tendency of spike widths across multiple experimental trials.
The standard error of the mean of the medians is calculated to estimate the variability in the mean of the median t-half values across experimental repetitions. This measure helps assess the precision of the estimate and ensures that any observed differences between conditions are statistically meaningful.
Although the individual t-half values are non-normally distributed, the Central Limit Theorem (CLT) justifies the use of the mean of the medians and the calculation of standard error. The CLT states that the distribution of the sample mean (in this case, the mean of medians) will approximate normality with a sufficiently large sample size, allowing us to calculate the standard error and make valid statistical inferences.
Observations on the amperometry datasets
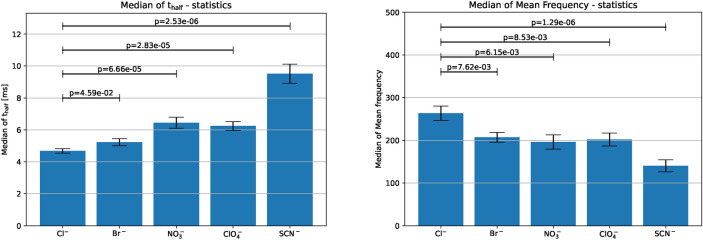
In the time domain, the mean of medians of spike width of the Hofmeister dataset traces increases in the Hofmeister order, however with the exception of the nitrate ion (left panel of Fig. 4). In the frequency domain, the mean frequency decreases along with the Hofmeister order, or increases exactly in the opposite order due to the inverse relationship between spike shape and mean frequency. The atypical ordering between the chlorate ion and nitrate ion is captured in the frequency domain as well (right panel of Fig. 4). Our use of median-based statistics, along with the calculation of the standard error of the mean of the medians, ensures robust and reliable comparisons of spike characteristics across experimental conditions, accounting for the inherent variability in biological data.
Figure 4.
FFT on the Hofmeister dataset. Left: Spike characteristics due to different anion stimulation in the time domain shown by . Right: Spike characteristics in the frequency domain shown by median of mean frequency, . The averaged median of mean frequency (shown with solid bar) shows a clear dependency on the stimulating anion, i.e. it decreases along the Hofmeister-order (here from left to right) except for the anion , which also showed its abnormality during the time-domain analysis. Additionally, the cross-cell standard error of mean of the median of and the median of mean frequency are denoted by the error bars. Bars represent the mean of the medians of t-half across multiple datasets, with error bars representing the standard error of the mean of the medians.
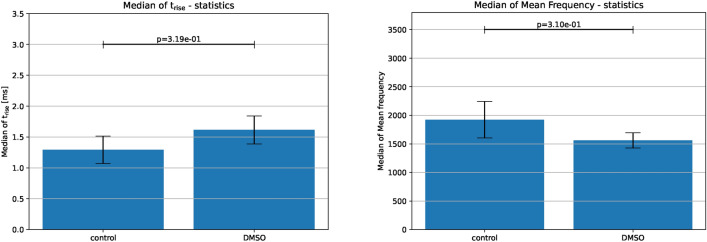
DMSO incubation influences only certain spike characteristics, specifically, it increases . This is evident from the median of spike width in the time domain, where the control group shows a lower mean of the median value of compared to DMSO. In the frequency domain, DMSO shows lower mean frequency on average (Fig. 5). Similar observations can be made on our third and final candidate, i.e. the electrodes dataset (Fig. 6).
Figure 5.
FFT on the DMSO dataset. Left: Spike characteristics for control and DMSO in the time domain shown by (25–100%). Right: Spike characteristics in the frequency domain shown by median of mean frequency, . Standard error of mean of the median of and the median of mean frequency are shown by the error bars. Bars represent the mean of the medians of t-half across multiple datasets, with error bars representing the standard error of the mean of the medians.
Figure 6.
FFT on the electrodes dataset. Left: Spike characteristics due to different electrodes in the time domain shown by . Right: Spike characteristics in the frequency domain shown by median of mean frequency, . Standard error of mean of the median of and the median of mean frequency are shown by the error bars. Bars represent the mean of the medians of t-half across multiple datasets, with error bars representing the standard error of the mean of the medians.
The standard error of mean error bars per category, and the corresponding standard errors, reflect the effect of sample sizes (5–10 each category), as can been seen for example, in the electrodes dataset that has poor sample sizes. The datasets used here as candidates along with their respective sample sizes and other attributes are summarized in the supplementary section.
This method is therefore amenable for statistical validation of any amperometry dataset in the frequency domain. However, it is important to note that (as can been seen from the electrodes dataset), the sample size and length of measurements play a key role as well. Too few samples or too short measurements per category may not be sufficient for statistical tests of frequency analysis, and may result in extremely low standard error of means.
Although a workaround for this issue of large error bars might be removing outliers, this is highly discouraged since this would reduce the credibility of the observations made - in particular when the sample size is small. The procedure outlined herein is available as an open-source tool specifically dedicated to the analysis of amperometry signals in the frequency domain. The program implementation is also detailed in the supplementary section.
In this work, we have outlined a method for spike-based frequency analysis of amperometry traces that also provides statistical validation of observations on spike characteristics in the time domain. To our knowledge, this is the first fully automated open-source tool available for analyzing amperometric spikes in the frequency domain. We have shown that the time-domain information could be retrieved from spike-based frequency analysis. The proposed method provides a more systematic way of analyzing amperometry data compared to IgorPro QuantaAnalysis which involves manual interventions with the GUI and on Excel.
We have outlined quite a diverse set of amperometry datasets that illustrates the relationship between spike shape and mean frequency. Although a few steps of the frequency analysis method are user-dependent (such as data filtering and cut-off factor), the majority of our program is fully automated and has provided consistent results on different amperometric datasets. However, the frequency analysis implementation is a Python package that is not as mature as IgorPro QuantaAnalysis software which, for instance, has functionalities to handle the separation of overlapping spikes automatically. Further, the package does not have a GUI and interaction happens through a Command Line Interface. In addition, this method may not be suitable for datasets that have too few traces.
Though with Fourier Transform methods it is possible to evaluate all the frequencies in a signal, the time at which they occur cannot be determined since the signal is represented only in the frequency domain. This bottleneck may be overcome by using methods such as wavelet analysis which can represent a signal in the time and frequency domain at the same time33,34. Using discrete wavelet analysis on the detected spikes will give the time localization of the key frequency levels as well.
Methods
State-of-the-art amperometry data analysis workflow
As motivated in the introduction, amperometry traces are one-dimensional waveforms (or signals) that can also be treated in the frequency domain, thereby making frequency analysis an alternative to the traditional time-domain methods. The traditional analysis is usually done by using the mature spike-based amperometric data analysis software IgorPro QuantaAnalysis. In the state-of-the-art QuantaAnalysis workflow, amperometry traces are imported into the program, and traces are pre-processed using filters wherever necessary.
Subsequently, the pre-processed data is used to identify spikes based on a pre-defined threshold. This is then followed by statistical analysis and visualization of over 20 representative spike characteristics, including time parameters, such as , and ; current parameters, such as and ; and charge parameters, such as and (as shown in top sequence of workflow in Fig. 7A and illustrated in Fig. 1). In addition, the spike characteristics of all spikes in an amperometry trace are written out by the QuantaAnalysis program to a table similar to that shown in Fig. 7B.
Frequency analysis workflow
In the “frequency analysis” workflow shown in the bottom sequence of Fig. 7A, similar pre-processing is done by removing unstable data caused by poor device alignment, followed by low-pass filtering for noise removal. Few signals could be exceptions to automated pre-processing and may require manual intervention. This may include cases where there are artifacts (e.g. “spike” clusters occurring from time to time, and the presence of noise arising due to the type of electrodes used in the experiment.
Spike clusters are defined as groups of spikes that occur in rapid succession, such that the intervals between consecutive spikes are significantly shorter than usual. While these spikes do not physically overlap, their close temporal proximity can cause baseline recovery issues and shape distortions. Analyzing spike clusters presents several difficulties. First, baseline recovery between spikes may be incomplete, leading to errors in detecting the start and end points of individual spikes. Second, the proximity of spikes can distort their amplitude and shape, complicating the calculation of key parameters such as spike width and mean frequency. Finally, frequency analysis of closely spaced spikes can result in overlapping frequency components, making it harder to accurately extract the oscillatory characteristics of each spike. As a result, manual intervention is often required to correctly segment and analyze spikes within clusters.
Signal “jumps” at the beginning of the signal were for instance observed in the electrodes dataset, perhaps due to poor alignment of the measuring instruments. This may lead to unrealistic spikes that may crash the program. In addition, we also observed spike clusters occasionally occurring in the datasets, wherein hundreds or even thousands of spikes occur sequentially. Such clusters can cause significant bias when evaluating the spike statistics. These anomalies were observed with varying probabilities of occurence for all datasets we analyzed, usually caused by poor device alignment.
In these exceptional cases, we recommend manual handling of these traces; for instance by ignoring the starting segment of the traces that contain artifacts or by ignoring spikes identified as belonging to a cluster. Once this is done, the standard deviation of the baseline, and local maxima are determined. Then each local maximum is analyzed and compared with a pre-defined threshold factor . Using this threshold, spikes are identified and extracted, followed by the application of Fast Fourier Transform (FFT) on each spike (the FFT method is discussed in more detail in the latter part of this section).
Using FFT, the mean frequency of each spike can be calculated in the frequency domain. Subsequently, the means of median of the mean frequencies of all spikes (and corresponding standard deviation) can be used for statistical analysis of the traces (as shown in Fig. 7C). This pipeline in the frequency domain, outlined above, is implemented as an end-to-end Python package that takes in raw amperometry trace and outputs the mean frequencies and their statistics. A more detailed treatment of the package implementation is outlined in the supplementary section.
Fourier transform
Amperometry traces are signals that are sampled discretely in time, hence we require a Discrete Fourier Transform (or DFT) for frequency analysis. The DFT is a commonly used method in signal processing to convert a signal in the time domain into a frequency spectrum, enabling us to characterize the mean or dominant frequency properties of the signal. Mathematically, a Fourier Transform breaks down a non-linear function into a linear superposition of simple basis functions, such as sines and cosines, whose summation reconstructs the original signal.
The basis function herein must form an orthonormal base to ensure linear independence, which are the complex exponentials in the Fourier Transform. In terms of computational cost, a DFT requires operations, which gets quite expensive for a large number of sampling points. The Fast Fourier Transform method numerically divides the DFT into smaller DFTs thereby bringing down the number of operations to complexity of .
Consider a periodic sinusoidal signal, , where A is the amplitude of the signal and is the angular frequency of the signal. A Fourier Transform of this signal is exactly supported at and . For such a signal, if the waveform oscillates rapidly as a function of time, it is referred to as a high frequency signal (such as in Fig. 2), else if it varies slowly then it is referred to as low frequency signal (such as in Fig. 2).
In the case of linear superposition of multiple signals, such as the one illustrated in Fig. 8, Fourier Transform can reveal the constituent trigonometric functions at different frequencies decomposed from these signals. The discrete Fourier transform transforms a sequence of N complex numbers, into another sequence of numbers, , which is given by,
and
where N is the number of time samples we have from the trace; n is the current sample we are considering; is the current frequency (0 to Hz) and is the amount of frequency k in the signal (constituted by amplitude and phase). A non-oscillating shift only changes the coefficient . Therefore the baseline shift can be neglected by ignoring the 0 Hz component in FFT. Please note that usually a factor of is used in the inverse transform from frequency to the time domain. Alternatively, one could apply the factor to both DFT and inverse DFT.
Figure 8.
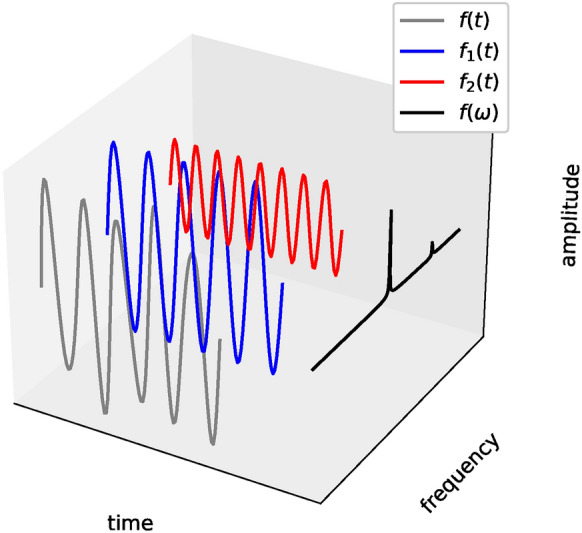
Illustration above represents the idea of a Fourier Transform: Consider a signal, in the time-amplitude space(represented by the gray curve). This signal can be decomposed into and in the time-amplitude space (represented by the blue and red curves respectively). Fourier Transform of the signal, shows these two peak frequencies respectively in the frequency-amplitude space (represented by the black curve).
Main and mean frequency
For our analysis of amperometry traces, the frequency is in the range of . The experimental data were recorded with a sampling frequency, kHz, therefore the Nyquist frequency is one-half of the sampling frequency i.e. 5 kHz. When considering only the frequency components below the Nyquist frequency, the resulting discrete-time signal can be exactly reconstructed without distortion (known as aliasing).
The main frequency that comes out of the analysis is the one with the largest amplitude, whereas the mean frequency is calculated as the energy averaged frequency, . Note that analyzing the full-time series (including baseline) would show no characteristic frequencies apart from a peak at around 0 Hz (refer supplementary section). However, doing a spike-based frequency analysis gives true insight into the mean frequency range of the traces.
Once this implementation for frequency analysis is established, it is straightforward to observe the reflection of spike shape (thin or wide) on the mean frequency. The relationship between spike shape and mean frequency has been motivated by way of simulated signals in the conclusions section. It can also be shown analytically using high- and low-frequency triangular signals in the time domain as objects for Fourier Transform (detailed in the supplementary section).
Supplementary Information
Acknowledgements
The authors thank Zahra Taleat, Alex S. Lima, Elias Ranjbari, Johan Dunevall for their data contributions.
Funding
This work was supported by the JPND Neuronode grant No. 01ED1802 for the computational work; and the MSCA grant funding from the European Union’s Horizon 2020 research and innovation program under the Marie Skłodowska-Curie Grant Agreement No.793324 for the experimental work.
Data availability
Raw data were generated at the University of Gothenburg, Sweden. Associated publications have been cited in the manuscript with detailed description in the supplementary section. The data that support the findings of this study are available from the corresponding author, J.K., upon reasonable request.
Declarations
Competing interests
The authors declare no competing interests.
Footnotes
Publisher’s note
Springer Nature remains neutral with regard to jurisdictional claims in published maps and institutional affiliations.
Supplementary Information
The online version contains supplementary material available at 10.1038/s41598-024-76665-7.
References
- 1.Wrenn, K. Past and present. Ann. Intern. Med. 138, 847. 10.7326/0003-4819-138-10-200305200-00015 (2003). [DOI] [PubMed] [Google Scholar]
- 2.Liu, X., Tong, Y. & Fang, P. P. Recent development in amperometric measurements of vesicular exocytosis. TrAC - Trends Anal. Chem. 113, 13–24. 10.1016/j.trac.2019.01.013 (2019). [Google Scholar]
- 3.TL, C., EJ, H., EN, P., D, S. & AG, E. Quantitative and statistical analysis of the shape of amperometric spikes recorded from two populations of cells. J. Neurochem. 74, 1086–1097. 10.1046/j.1471-4159.2000.741086.x (2000). [DOI] [PubMed]
- 4.Segura, F., Brioso, M. A., Gómez, J. F., Machado, J. D. & Borges, R. Automatic analysis for amperometrical recordings of exocytosis. J. Neurosci. Methods 103, 151–156. 10.1016/S0165-0270(00)00309-5 (2000). [DOI] [PubMed] [Google Scholar]
- 5.Mosharov, E. V. & Sulzer, D. Analysis of exocytotic events recorded by amperometry. Nat. Methods 2, 651–658 (2005). [DOI] [PubMed] [Google Scholar]
- 6.Lemaître, F., Guille Collignon, M. & Amatore, C. Recent advances in electrochemical detection of exocytosis. Electrochim. Acta 140, 457–466. 10.1016/j.electacta.2014.02.059 (2014).
- 7.Wightman, R. M. et al. Temporally resolved catecholamine spikes correspond to single vesicle release from individual chromaffin cells. Proc. Natl. Acad. Sci. USA. 88, 10754–10758 (1991). [DOI] [PMC free article] [PubMed] [Google Scholar]
- 8.Phan, N. T. N., Li, X. & Ewing, A. G. Measuring synaptic vesicles using cellular electrochemistry and nanoscale molecular imaging. Nat. Rev. Chem. 1, 0048 (2017). [Google Scholar]
- 9.Li, X., Dunevall, J. & Ewing, A. G. Quantitative chemical measurements of vesicular transmitters with electrochemical cytometry. Acc. Chem. Res. 49, 2347–2354 (2016). [DOI] [PubMed] [Google Scholar]
- 10.Dunevall, J. et al. Characterizing the Catecholamine Content of Single Mammalian Vesicles by Collision-Adsorption Events at an Electrode. J. Am. Chem. Soc. 137, 4344–4346. 10.1021/ja512972f (2015). [DOI] [PubMed] [Google Scholar]
- 11.Li, X., Majdi, S., Dunevall, J., Fathali, H. & Ewing, A. G. Quantitative measurement of transmitters in individual vesicles in the cytoplasm of single cells with nanotip electrodes. Angew. Chem. Int. Edn. 54, 11978–11982. 10.1002/anie.201504839 (2015). [DOI] [PMC free article] [PubMed] [Google Scholar]
- 12.Ren, L. et al. The evidence for open and closed exocytosis as the primary release mechanism. Q. Rev. Biophys. 49, 1–27 (2016). [DOI] [PubMed] [Google Scholar]
- 13.Larsson, A. et al. Intracellular electrochemical nanomeasurements reveal that exocytosis of molecules at living neurons is subquantal and complex. Angew. Chem. Int. Edn. 59, 6711–6714. 10.1002/anie.201914564 (2020). [DOI] [PubMed] [Google Scholar]
- 14.Wang, Y. & Ewing, A. Electrochemical quantification of neurotransmitters in single live cell vesicles shows exocytosis is predominantly partial. ChemBioChem 22, 807–813 (2021). [DOI] [PMC free article] [PubMed] [Google Scholar]
- 15.Steven M. Singer, Marc Y. Fink, V. V. A. Vesicle impact electrochemical cytometry compared to amperometric exocytosis measurements. Physiol. Behav. 176, 139–148 (2019).
- 16.Wacker, M. & Witte, H. Time-frequency techniques in biomedical signal analysis: A tutorial review of similarities and differences. Methods Inf. Med. 52, 279–296. 10.3414/ME12-01-0083 (2013). [DOI] [PubMed] [Google Scholar]
- 17.Evanko, D. Primer: Spying on exocytosis with amperometry. Nat. Methods 2, 650. 10.1038/nmeth0905-650 (2005). [DOI] [PubMed] [Google Scholar]
- 18.Cooley, J. W. & Tukey, J. W. An algorithm for the machine calculation of complex fourier series. Math. Comput. 19, 297–301 (1965). [Google Scholar]
- 19.RN, B. The fourier transform and its applications. Math. Comput. (1999).
- 20.Brigham, E. O. & Morrow, R. E. The fast Fourier transform. IEEE Spectr. 4, 63–70. 10.1109/MSPEC.1967.5217220 (1967). [Google Scholar]
- 21.Cohen, L. Time-frequency distributions-a review. Proc. IEEE 77, 941–981. 10.1109/5.30749 (1989). [Google Scholar]
- 22.Cooley, J., Lewis, P. & Welch, P. Historical notes on the fast fourier transform. Proc. IEEE 55, 1675–1677. 10.1109/PROC.1967.5959 (1967). [Google Scholar]
- 23.The Fast Fourier Transform and its Applications. IEEE Trans. Educ. 12, 27–34. 10.1109/TE.1969.4320436 (1969). [Google Scholar]
- 24.Letelier, J. C. & Weber, P. P. Spike sorting based on discrete wavelet transform coefficients. J. Neurosci. Methods 101, 93–106. 10.1016/S0165-0270(00)00250-8 (2000). [DOI] [PubMed] [Google Scholar]
- 25.Alsop, L. E. Faster fourier analysis. J. Geophys. Res. 71, 5482–5483 (1966). [Google Scholar]
- 26.Heitler, W. J. DataView: A tutorial tool for data analysis: Template-based spike sorting and frequency analysis. J. Undergrad. Neurosci. Educ. 6, 1–7 (2007). [PMC free article] [PubMed] [Google Scholar]
- 27.Mikheev, P. A. Application of the fast Fourier transform to calculating pruned convolution. Dokl. Math. 92, 630–633. 10.1134/S1064562415050075 (2015). [Google Scholar]
- 28.A., P. The Fourier Integral and its Applications (New York: McGraw-Hill, 1962).
- 29.Identification of neuronal network properties from the spectral analysis of calcium imaging signals in neuronal cultures. Front. Neural Circ. 7, 1–16. 10.3389/fncir.2013.00199 (2013). [DOI] [PMC free article] [PubMed]
- 30.Ruffinatti, F. A. et al. Calcium signals:Analysis in time and frequency domains. J. Neurosci. Methods 199, 310–320. 10.1016/j.jneumeth.2011.05.009 (2011). [DOI] [PubMed] [Google Scholar]
- 31.He, X. & Ewing, A. G. Counteranions in the Stimulation Solution Alter the Dynamics of Exocytosis Consistent with the Hofmeister Series. J. Am. Chem. Soc. 142, 12591–12595. 10.1021/jacs.0c05319 (2020). [DOI] [PMC free article] [PubMed] [Google Scholar]
- 32.Majdi, S., Najafinobar, N., Dunevall, J., Lovric, J. & Ewing, A. G. DMSO chemically alters cell membranes to slow exocytosis and increase the fraction of partial transmitter released. ChemBioChem 18, 1898–1902. 10.1002/cbic.201700410 (2017). [DOI] [PubMed] [Google Scholar]
- 33.Coifman, R. R., Meyer, Y. & Wickerhauser, V. Wavelet analysis and signal processing. In Wavelets and their Applications, 153–178 (1992).
- 34.Pavlov, A. N. et al. Wavelet analysis in neurodynamics. Phys. Usp. 55, 845–875. 10.3367/ufne.0182.201209a.0905 (2012). [Google Scholar]
Associated Data
This section collects any data citations, data availability statements, or supplementary materials included in this article.
Supplementary Materials
Data Availability Statement
Raw data were generated at the University of Gothenburg, Sweden. Associated publications have been cited in the manuscript with detailed description in the supplementary section. The data that support the findings of this study are available from the corresponding author, J.K., upon reasonable request.


