Abstract
Postural orthostatic tachycardia syndrome (POTS) presents excessive orthostatic tachycardia and orthostatic intolerance. POTS is a common and therapeutically challenging condition affecting numerous people worldwide. As many disease entities can be confused with POTS, it becomes critical to identify this syndrome. Moreover, unbalanced autonomic nervous activity can induce cardiovascular diseases and influence the bio-feedback mechanism: Baroreflex (BR) and cerebral autoregulation (CA). BR and CA are important bio-mechanisms that maintain a stable circulatory system via the autonomic nervous system. Therefore, an impaired autonomic nervous system would lead to imbalanced BRS and CA. Consequently, we propose an advanced cross-correlation function (ACCF) time-domain approach to analyze baroreflex and cerebral autoregulation using physiological signals. This study assesses relation changes in BR and CA using ACCF in POTS for early clinical detection and diagnosis. The ACCF analysis results has thresholds that reveal that the BR of healthy and POTS groups present significantly different maximum CCF values (p < 0.05). The complete CCF index shows that the BR phase changes significantly into phase lag in the POTS group. Although CA analysis using the maximum CCF index was mildly weak, it did not differ in the POTS group. Thus, POTS only affects BR. An increasing sympathetic activity might induce an unbalanced baroreflex effect and increase cerebral vasomotor tone with CA. Maximum CCF value correlation coefficients between BR and CA indicated positive in POTS groups and negative in the healthy group. It could be speculated that the sympathetic nervous system compensates to improve BR function, which remains CA function. The advantage of this ACCF algorithm is that it helps observe BR and CA for early detection.
Keywords: Cardiovagal baroreflex, Cerebral autoregulation, Postural orthostatic tachycardia syndrome, Blood pressure, Heart rate, Advanced cross-correlation function
Subject terms: Biological techniques, Computational biology and bioinformatics, Health care, Mathematics and computing, Nanoscience and technology
Introduction
The definition of postural orthostatic tachycardia syndrome (POTS) may be traced to 1993 by Schondorf and Low1, in which a small group of patients presented excessive orthostatic tachycardia and orthostatic intolerance. The criteria for conventional POTS involves extreme orthostatic tachycardia and the lack of substantial orthostatic hypotension and predominant orthostatic intolerance symptoms, worse with upright posture and better with recumbence2. POTS is defined as a chronic orthostatic intolerance characterized by an excessive heart rate increase of 30 beats per minute (bpm) or more within 10 min of standing or head-up tilt. Frequent orthostatic intolerance symptoms while standing up that quickly improve upon lying down. These symptoms may include lightheadedness, palpitations, tremors, general weakness, blurred vision, and fatigue, lasting for at least 3 months3.
POTS should also be viewed as a central nervous system disorder4 with multiple contributing pathophysiologic mechanisms. Three primary pathophysiologic agents that induce POTS include partial autonomic neuropathy, hypovolemia, and hyperadrenergic. As a result, patients with POTS would have a higher heart rate of at least 30 bpm in an upright position5. Usually, POTS is accompanied by decreased brain blood flow, autonomic dysfunction, and orthostatic intolerance6. It has been reported that heart rate variability (HRV) in patients with POTS would be significantly irritated by age, sex, race, physical fitness, and circadian rhythm7. Another report revealed that patients with POTS have baroreflex deficits and that the maximum baroreflex gain is reduced by 25% in POTS compared with healthy control while in the supine position. It has been suggested that a combination of exercise and pyridostigmine/digoxin, which increases parasympathetic activity and reduces sympathoexcitation, might be beneficial for the treatment of POTS8. It is estimated that postural tachycardia syndrome affects more than 3 million people in the United States9. It affects more women (women: men 5:1) aged 15–50 years10. In addition, POTS is a common and therapeutically challenging condition affecting numerous people worldwide11. As many disease entities can be confused with POTS, it becomes critical to identify this syndrome. Unfortunately, there are gaps in the current criteria for identifying individuals with this condition12.
Moreover, recent studies indicated that POTS syndrome would induce a 36% total loss of more than USD 10,000 in the past year before the survey13. POTS patients have a higher HR than healthy patients after HUTT and lower HRV in terms of time domain measurement but not frequency domain measurement. HR and HRV time domain analyses are more reliable than frequency domain analyses in differentiating POTS patients from healthy participants. Sensitivity and specificity studies may be required14. Many patients with POTS suffer from fatigue, daytime sleepiness, and sleeping disturbances. POTS patients showed a reduction in LF/HF ratio variability in different sleep stages15. Using HRV analysis, Vagus activity reduction was the main physiological point of POTS and identified that tall, lean teenagers were high-risk groups16. Previous and current studies revealed that POTS would significantly affect quality of life, and water, and salt supplementation, with exercise could be non-pharmacological ways to improve symptoms, plasma volume, and orthostatic responses in patients with POTS17–19. POTS similar symptoms have been reported after COVID-19 infection in previously healthy patients. However, appropriate diagnostic investigations and therapies are necessary to identify and treat autonomic dysfunction after COVID-1920. COVID-19 also provided a unique prospect for surveying autonomic syndromes after infection, and it could lead to an understanding of the pathogenic mechanisms of POTS21. ANS adjusts the cardiopulmonary system homeostasis by modulating the interaction between blood pressure and heart rate through arterial cardiovagal baroreflex. A negative feedback mechanism buffers blood pressure variation to retain heart rate and blood volume to adjust to varying conditions in daily activities22. POTS is a central nervous system disorder that affects the cardiopulmonary system and induces some circulation syndromes. Age, gender, reflex, humeral, behavioral, and environmental factors may control cardiovascular variability and baroreflex effectiveness23,24. Baroreflex function, well or not, could be an index for circulatory regulation via the atrial sinus node25–27. A previous study reviewed approaches, ex. sequence method, cross-correlation method, cross-spectral method, synchronization index, cross-multiscale entropy, joint symbolic dynamics, similarity index, etc., for evaluating baroreflex function in POTS using ECG measurements. Abnormal baroreflex function could be indicated early using autonomic cardiovascular imbalance28–31. Another study demonstrated that BRS algorithms included time and frequency domain methods. These methods might not be applied to observe the sympathetic baroreflex component32–34. Most published BRS algorithms focus on cardio-vagal function but not sympathetic function. Therefore, impaired baroreflex function might not always be revealed due to the limitations35. The interaction between blood pressure and cerebral blood flow could be assessed to quantify the cerebral autoregulation function (CA). Researchers evaluated CA in POTS using auto spectra and transfer function, revealing that impaired CA might underlie upright neurocognitive dysfunction36. A previous study indicated that some patients with POTS were found to have a more significantly decreased CBV37 and less effective CA during head-up tilt38. However, another report revealed that cerebral perfusion and autoregulation in POTS were not significantly different from normal subjects. Hence, the POTS pathologies must be clarified39.
As we know, the physiological status was often related to the bio-signal responses. One of the analysis methods in the time domain is the cross-correlation function (CCF). The CCF method was used to analyze the proposed correlation estimations to assess the relationship levels of the two signals. CCF estimation’s advantage was finding the hidden information and quantifying the temporal similarity40. Furthermore, studies have shown that CCF estimation could examine the sense of balance between the autonomic system and baroreflex control41–43. For example, cross-correlation baroreflex sensitivity (xBRS) was adopted to analyze the EUROBAVAR database, including patients with a heart transplant and autonomic neuropathy. This indicated that a delayed baroreflex occurred in patients41. A modified cross-correlation function named advanced cross-correlation function was applied to successfully identify arterial baroreflex in diabetes. It could explore hidden messages in diabetic baroreflex control43. Recently, CCF was adopted to evaluate multi-channel NIRS signals for the hemodynamic responses after cupping therapy. It was found that there was a correlation between deoxyhemoglobin and a more significant negative pressure intensity44.
Cerebral autoregulation has been evaluated using CCF, which has been used successfully in previous studies. They also showed the difference in the bio-mechanism between the healthy and patients45–49. Although researchers have applied the cross-correlation concept and CCF algorithm in many fields, the algorithm still has a natural disadvantage32–34. Therefore, the purpose of this study was to apply a new model to enhance the CCF algorithm into the advanced CCF (ACCF) and categorizes the relationship change between BR and CA to detect POTS information in the early stage. This pilot study investigates BR and CA correlation performance using the advanced cross-correlation function (ACCF) to observe POTS progress. The findings from this novel approach could be applied to realize the POTS effects on the relationship between baroreflex and cerebral autoregulation using the proposed method -advanced cross-correlation function approaches.
Materials and methods
Subjects and measurement
This study enrolled eighteen age-matched patients (54.21 ± 15.47 years) with POTS. The patients presented no cardiovascular disease (including diagnosed diabetes) and no significant blood pressure difference (p > 0.05) among groups in the supine position. In addition, ten healthy subjects (57.40 ± 8.41 years) were recruited without receiving any medication during the study period. Participants in this study provided written informed consent, including the experimental process, and before evaluation, and the ethics committee of Cheng-Ching General Hospital, Taiwan, approved the study (IRB No. HP160028). Finapres (Model 2300, Ohemda, Englewood, CO, USA) uses the photoplethysmographic signal to clamp volume in the finger by servo control to acquire subjects’ continuous arterial blood pressure and heart rate signals were acquired for 5 min during resting and tilting postures, respectively. Cerebral blood flow velocity signals were obtained through TCD (transcranial Doppler ultrasound, EME TC 2020, Nicolet instrument, Warwick, United Kingdom) in conjunction with a 5-MHz transducer fixed over the temporal bones by an elastic headband. In our experiments, the sampling rate is set to 60 Hz for acquiring the analog data from Finapres and TCD in this system. Subjects first laid down on a tilting table with a safety belt. The subject was head-up tilted to 75 degrees within 4 s from horizontal supine posture to induce BP fluctuation using the tilting table. Data acquisition was performed after a 10-minute relaxation period in the resting position. All methods were performed in accordance with the relevant guidelines and regulations50. The data that support the findings of this study are not openly available due to reasons of sensitivity and are available from the corresponding author upon reasonable request. Data are located in controlled access data storage at Cheng-Ching General Hospital, Taiwan.
Advanced cross-correlation function estimation
Cross-correlation function estimation
Cross-correlation is a method to assess the degree of similarity between two data sets. The Cross-correlation function could determine the association between signals22. Taking the systolic arterial blood pressure (SABP) and the beat-to-beat heart rate signals as the input data for estimation, the relation and phase between the SABP and the HR signals can be determined using the cross-correlation function. The phase relationship between BP and HR is applied to discover the baroreflex sensitivity mechanism in the cardiovascular system. The phase relationship between mean arterial blood pressure (MABP) and mean cerebral blood flow velocity (MCBFV) was also determined using CCF estimation for evaluating the cerebral autoregulation function. The cross-correlation function is expressed as CCF(k), W is the window length, k is the number of peak-to-peak displacement points, and N is the total signal length. Assume SABP and HR signals are f(n) and g(n), respectively. To assess the autonomic nervous system in specific frequency bands, both f(n) and g(n) signals were bandpass filtered in low frequency (LF) ranges before applying the CCF. Where the LF range is 0.04 through 0.15 Hz, assume that bandpass filtered f(n) and g(n) signals are  and
and  , respectively. The CCF between
  and
and  can be calculated as follows:
 |
where  is an estimate of the cross-covariance in the ith time window and defined as
 |
 |
N is the total number of cardiac cycles, W is the window width, and k is the time lag. is the CCF outcome between
  and
and  in the ith time window.
Advanced cross-correlation function estimation using the threshold setting
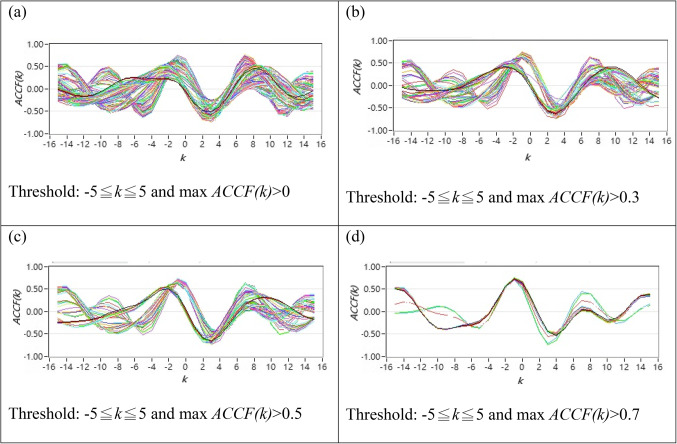
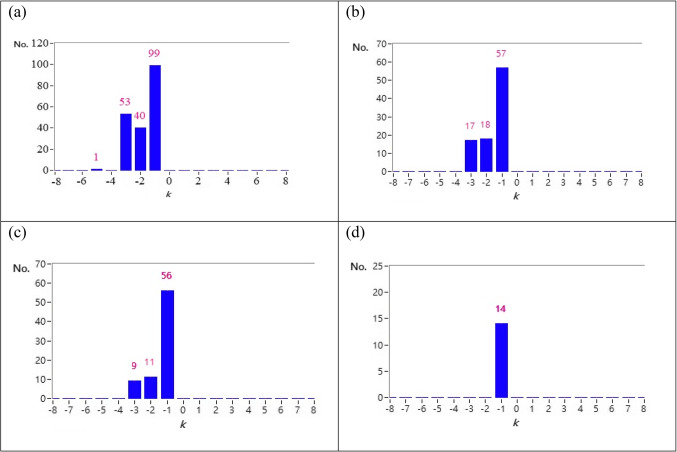
As described in Sect. 2.2.1, the original CCF estimation has N = 256, W = 64, and no other threshold following the CCF estimation. Figure 1 shows typical 2D figures using the CCF estimation. Due to i = 1 to N-W + 1, there are 193 CCF curves in this study. A typical 2D representative figure and bar chart for maximum CCF index distribution are shown in Figs. 1 and 2, respectively.
Fig. 1.
(a) All ACCF curves for a typical POTS subject that 100% curves satisfy the threshold by -5≦k≦5 and max ACCF(k)>0 (b) 2D representative figures of 47.67% ACCF curves for a typical POTS subject satisfy the threshold by -5≦k≦5 and max ACCF(k)>0.3 (c) 2D representative figures of 39.38% ACCF curves for a typical POTS subject with curves satisfy the threshold by -5≦k≦5 and max ACCF(k)>0.5 (d) 2D representative figures of 7.25 % ACCF curves for a typical POTS subject with satisfy the by -5≦k≦5 and max ACCF(k)>0.7.
Fig. 2.
(a) bar chart for maximum ACCF index distribution for a typical POTS subject that 193 curves satisfy the threshold by -5≦k≦5 and max ACCF(k)>0 (b) bar chart for maximum ACCF index distribution for a typical POTS subject that 92 curves for a typical POTS subject satisfy the threshold by -5≦k≦5 and max ACCF(k)>0.3 (c) bar chart for maximum ACCF index distribution for a typical POTS subject that 76 CCF curves for a typical POTS subject with curves satisfy the threshold by-5≦k≦5 and max ACCF(k)>0.5 (d) bar chart for maximum ACCF index distribution for a typical POTS subject that 14 curves for a typical POTS subject with satisfy the by -5≦k≦5 and max ACCF(k)>0.7.
In ACCF estimation, we set threshold parameters for k, improved some limitations, and filtered some noise to avoid a result bias. The settings were as follows:
Following the CCF estimation, we set N = 256, W = 64, and − 5 ≦ k ≦ 5.
The ACCF value between  and
and  can be calculated as follows:
 |
Setting 1: threshold by -5 ≦ k ≦ 5 and maximum ACCF(k) > 0 (as shown in Fig. 1(a) and Fig. 2(a)).
Setting 2: threshold by-5 ≦ k ≦ 5, and maximum ACCF(k) > 0.3(as shown in Fig. 1(b) and Fig. 2(b)).
Setting 3: threshold by-5 ≦ k ≦ 5, and maximum ACCF(k) > 0.5 (as shown in Fig. 1(c) and Fig. 2(c)).
Setting 4: threshold by-5 ≦ k ≦ 5, and maximum ACCF(k) > 0.7 (as shown in Fig. 1(d) and Fig. 2(d)).
Results
Baroreflex analysis with a threshold of cross-correlation function value
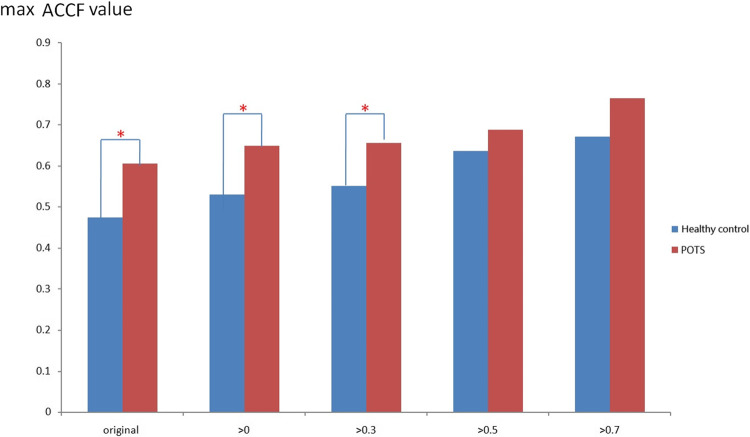
Figure 3 shows the maximum CCF value when the CCF value threshold setting is greater than 0 ~ 0.7 during the resting position. It revealed that the maximum CCF values were significantly higher (p < 0.05) than those in the healthy group, while the threshold was more significant than 0 ~ 0.3. This setting could separate the baroreflex difference between healthy and POTS groups in the resting position. In addition, it was revealed that the correlation between blood pressure and heart rate in POTS was significantly higher.
Fig. 3.
The present maximum ACCF value using the threshold CCF>0, 0.3, 0.5, and 0.7 in the resting position. ( *P < 0.05, compared between Healthy control and POTS).
The maximum CCF values trend to lower with the higher threshold between healthy and POTS groups. Further, the threshold setting was practical when the threshold was from 0 ~ 0.3. On the other hand, when the threshold was more significant than 0.5 and 0.7, it did not significantly show the difference.
Maximum cross-correlation function index results with threshold filtering
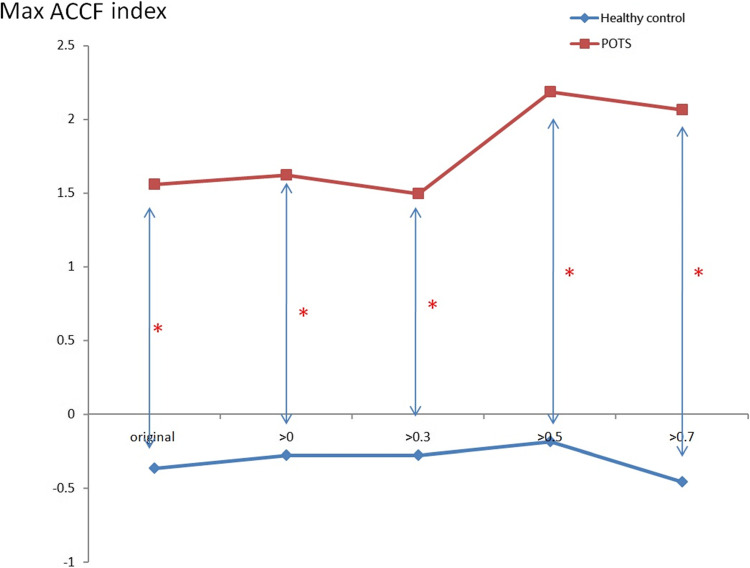
In Fig. 4, when the threshold setting for maximum CCF value is greater than 0 ~ 0.7, the maximum CCF index in the POTS group was positive and negative in the healthy group during the tilting position. The index indicates the phase between blood pressure and heart rate. It may indicate that the baroreflex phase in the POTS group was significantly different (p < 0.05) from those in the healthy group. That means phase change is significant (p < 0.05) in POTS subjects while position change is not in healthy subjects.
Fig. 4.
The present maximum ACCF index of baroreflex using the threshold CCF>0, 0.3, 0.5, and 0.7 in the tilting position. (*P < 0.05, compared between Healthy control and POTS).
Position change effect by advanced cross-correlation function analysis with threshold filtering
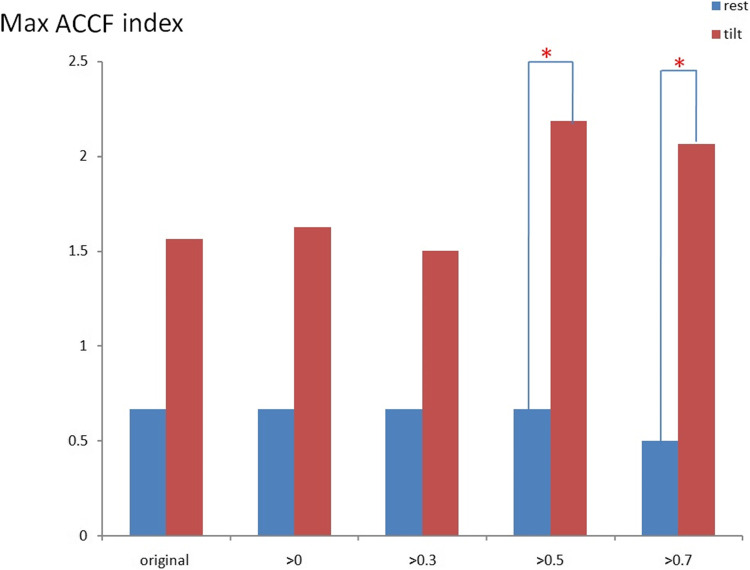
Figure 5 indicates the qualified maximum CCF index value results using the threshold in the resting and tilting positions. When the threshold setting for the maximum value of the CCF is greater than 0.5 and 0.7, the maximum CCF index showed significant differences (p < 0.05) in POTS groups during a position change. In addition, it indicated that the phase between HR and BP changed in the DM groups.
Fig. 5.
The present for qualified maximum ACCF index value of baroreflex using the threshold CCF>0, 0.3, 0.5, and 0.7 in resting position. (*P < 0.05, compared between rest and tilt positions).
Cerebral autoregulation analysis with a threshold of cross-correlation function value
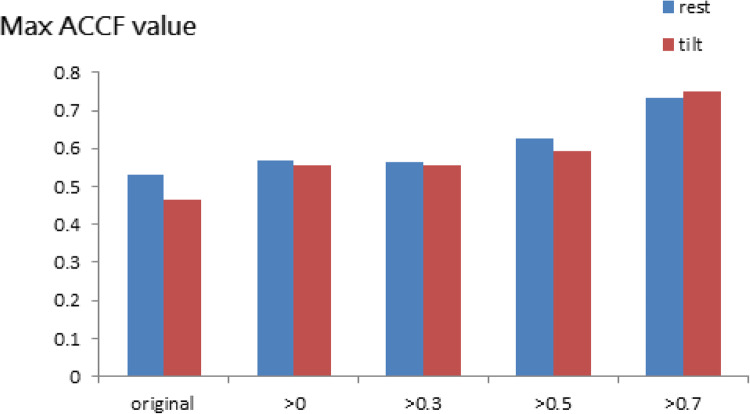
Figure 6 shows the POTS group’s maximum ACCF value between resting and tilting positions. It did not show the difference with a threshold of CCF value. On the other hand, the maximum CCF values become more than 0.5 with a threshold of CCF value.
Fig. 6.
The present maximum ACCF value of cerebral autoregulation using the threshold CCF>0, 0.3, 0.5, and 0.7 in POTS during rest and tilt position.
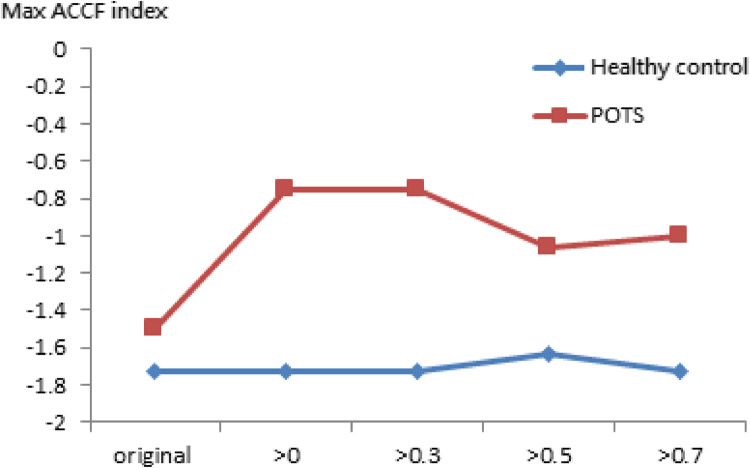
Figure 7 presents the maximum CCF index of CA using the threshold CCF > 0, 0.3, 0.5, and 0.7 in tilting positions in these two groups. The index values in these two groups were negative. Although it did not show a difference between healthy and POTS groups, index values in POTS showed closer to zero than those in the healthy group.
Fig. 7.
The present maximum CCF index of CA using the threshold CCF>0, 0.3, 0.5, and 0.7 in the tilting position.
Relation between cerebral autoregulation and baroreflex
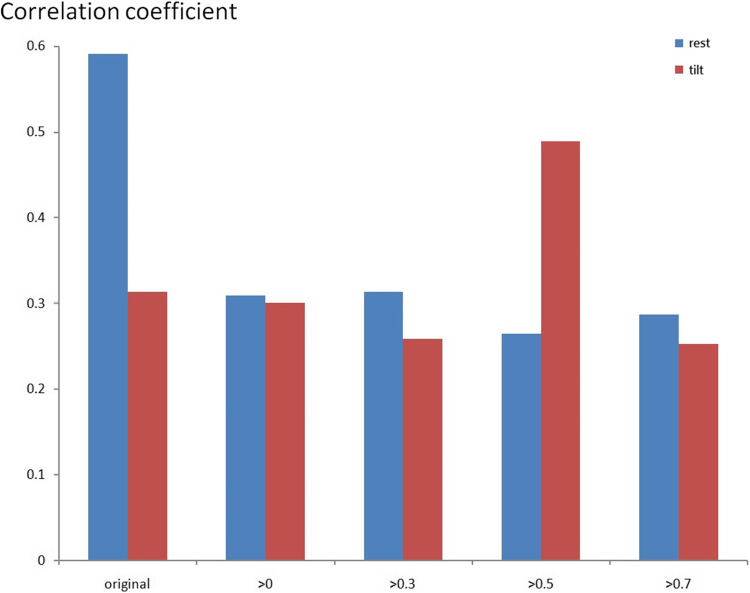
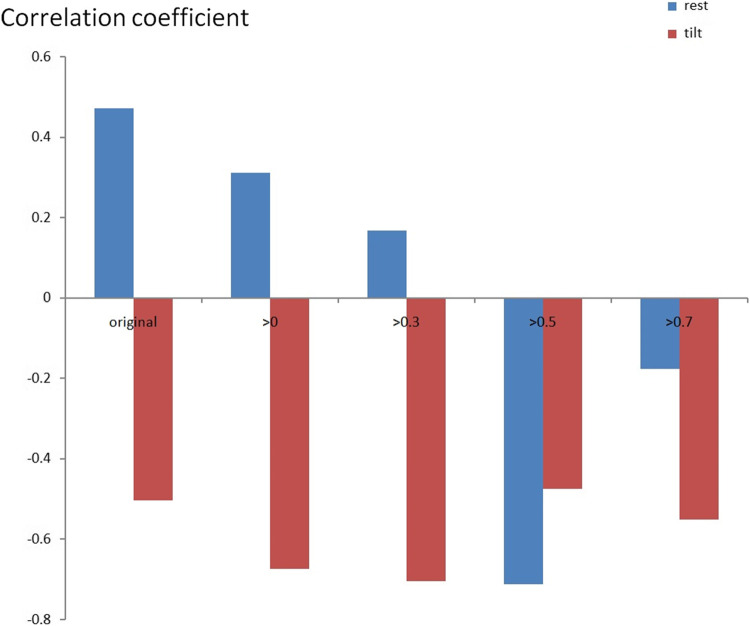
Figures 8 and 9 indicate the correlation coefficient results between BR and CA using the maximum CCF value using the resting and tilting position thresholds. Again, the correlation coefficients were positive in the POTS group, and there was no significant difference between the supine and upright positions. However, the correlation coefficients were negative in response to the tilting position for the healthy control group. Therefore, BR and CA’s correlation coefficients differed in POTS and healthy control groups.
Fig. 8.
The present correlation coefficient value between BR and CA of the POTS group by maximum ACCF value with the threshold CCF>0, 0.3, 0.5, and 0.7 in resting and tilting positions.
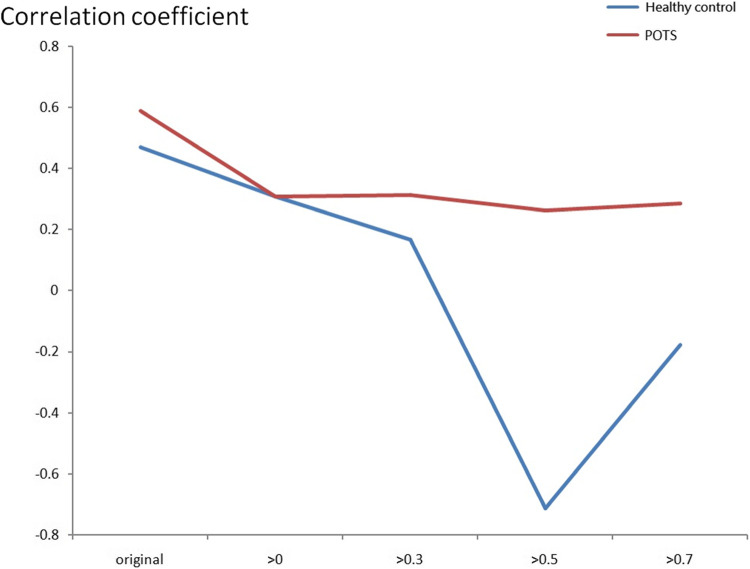
Fig. 9.
The present correlation coefficient value between BR and CA of the healthy control group by maximum ACCF value with the threshold CCF>0, 0.3, 0.5, and 0.7 in resting and tilting positions.
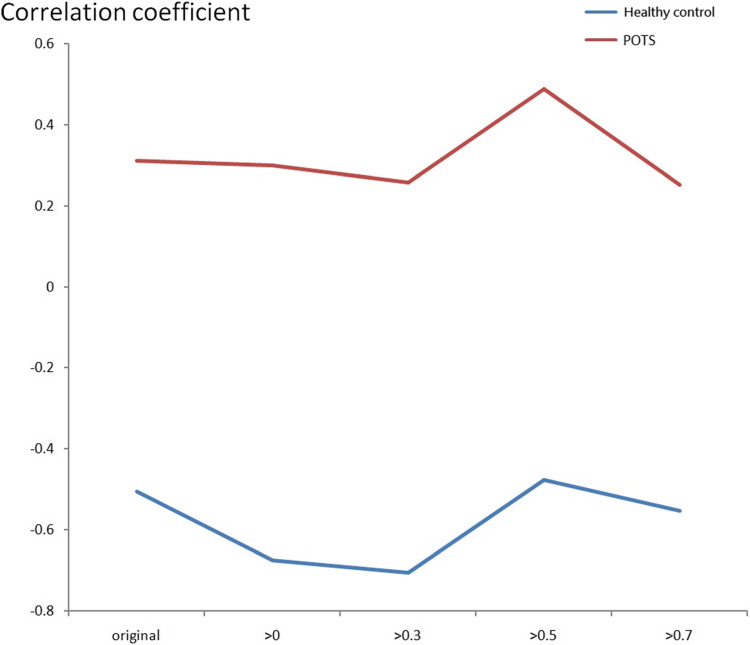
Figures 10 and 11 indicate the correlation coefficient trend between BR and CA using the maximum CCF value with the CCF > 0, 0.3, 0.5, and 0.7 thresholds in the resting and tilting positions. In the resting position, the POTS group correlation coefficient values were positive in all thresholds. However, the healthy group correlation coefficient values were negative in the 0.5 and 0.7 thresholds. The POTS group’s correlation coefficient values remained positive in all thresholds in the tilting position. Nevertheless, the healthy group correlation coefficient values were negative in all thresholds. Therefore, correlation coefficient values could show the difference between BR and CA in POTS and healthy groups.
Fig. 10.
The correlation coefficient trend between BR and CA using the maximum CCF value with the threshold CCF >0, 0.3, 0.5, and 0.7 in the resting position.
Fig. 11.
The correlation coefficient trend between BR and CA using the maximum CCF value with the threshold CCF>0, 0.3, 0.5, and 0.7 in the tilting position.
Discussion
Figure 3 exhibited varying maximum cross-correlation function (CCF) values across different thresholds. The POTS group demonstrated a notably elevated correlation between blood pressure and heart rate, as indicated by the maximum CCF value. Specifically, within the 0 to 0.3 threshold range, the POTS group exhibited maximum CCF values exceeding 0.6, significantly surpassing those of the healthy group. This observation suggests a potential distinction between the POTS and healthy groups in the baroreflex buffer function. Figure 4 presents the advanced cross-correlation function (ACCF) analysis concerning the maximum cross-correlation function (CCF) index value during tilting. The maximum CCF index value represents the phase relationship between two time series. As indicated in previous studies, a negative lag in the maximum CCF index value may signify phase-leading characteristics48,50. Consequently, an earlier study suggests nearly zero time delay due to impaired biological regulation performance46. In our investigation, the ACCF analysis revealed consistently negative maximum CCF index values in the healthy group across all thresholds, consistent with the expected phase-leading characteristic of normal biological regulation. Conversely, positive maximum CCF index values were observed in the POTS group, significantly differing from those in the healthy group (p < 0.05), potentially indicating a phase-lag characteristic of the baroreflex in POTS. Thus, the POTS syndrome may induce a phase shift between blood pressure and heart rate due to baroreflex dysfunction during tilting. Figure 5 illustrates the maximum cross-correlation function (CCF) index values for baroreflex using resting and tilting positions within the POTS group. Notably, during the transition from supine to upright posture, the maximum CCF index values were significantly higher within the 0.5 to 0.7 threshold range during the tilting position compared to the resting position. Additionally, Fig. 5 highlights the advantages of advanced cross-correlation function (ACCF) analysis, demonstrating significant differences in maximum CCF index values at higher 0.5 and 0.7 thresholds. Consequently, this study suggests that baroreflex dysfunction may exhibit significant phase-lag characteristics (p < 0.05) during the transition to an upright posture at elevated thresholds.
In the CA ACCF analysis, maximum CCF value results did not show a difference in the POTS group during both resting and tilting positions using the results shown in Fig. 6. It may indicate that posture change did not affect CA in the POTS group. On the other hand, Fig. 7 shows the maximum CCF index based on the ACCF analysis results. However, it did not show a difference between healthy and POTS groups. The maximum CCF index values with all thresholds in the POTS group were closer to zero than those in the healthy group. This may indicate that CA in the POTS group trended to mild dysfunction and slightly differed from the healthy group. The relationship between BR and CA is shown in Figs. 8, 9 and 10, and 11. It can be observed that positive and negative correlation coefficient values in POTS and healthy groups, respectively. Figure 8 presents a positive relation between BR and CA in the POTS group. This may mean that the interaction between BR and CA was unbalanced. The ACCF estimation advantage can also be observed in Fig. 9, and it showed a negative relation with higher thresholds of 0.5 and 0.7. A previous study indicated healthy subjects showed an inverse correlation between CA and BR. The increased sympathetic activity might induce an unbalanced baroreflex effect and increase cerebral vasomotor tone with CA51. In our study, the healthy group has a negative correlation coefficient value. It satisfies the previous report’s results51. However, the POTS group showed a positive relation between BR and CA. It could be speculated that the sympathetic nervous system compensation for improving BR function, which remains well in CA function. The results revealed that the threshold setting k for maximum CCF value was 0 to 0.5, showing a significant difference in BR between POTS and healthy groups. This relation could be a reference to observe the difference of BR and CA between POTS and healthy groups.
A recent study indicated that hypocapnic orthostatic intolerance with POTS and without hypocapnic cerebral hypoperfusion (HYCH) tachycardiathe syndromes have a comparable orthostatic decline in CBFV and end-tidal CO2 without orthostatic hypotension, POTS had lower levels and a greater decline in upright end-tital CO252. Furthermore, studies also revealed that there was also a tendency for more gastroenteric symptoms in HYCH and that it could be speculated that irritable bowel syndrome (IBS) could be due to decreased volume loss. In the last decade, research studies have identified peripheral irritants or mechanisms that cause IBS symptoms and are classified as a neuro gastrointestinal disorder53,54. Therefore, ACCF could be a useful tool in the future, along with other clinical measurements, to help diagnose related syndromes in POTS, HYCH, IBS, etc.
Conclusion
This study demonstrated the results from assessing the BR change using an advanced CCF analysis in POTS and healthy groups. The significant differences might indicate that POTS patients with a higher heart rate would be one of the main factors in inducing dysfunction BR control and sympathetic nervous system properties in the POTS group. The ACCF analysis results with appropriate threshold parameters could extract the hidden BR and CA performance characteristics in POTS patients. We speculate that an irregular autonomic nervous system would lead to BR dysfunction but maintain CA function. Advanced cross-correlation function could be a tool to observe the bio-feedback mechanism and its interaction in the human body.
Acknowledgements
The authors thank the National Science and Technology Council, Taiwan, ROC, for supporting this research under Contract No. NSTC 112-2637-E-241-002 and NSTC 113-2221-E-035-014.
Author contributions
Conceptualization and methodology, B.-Y.L., and S.-J.Y.; formal analysis, B.-Y.L., and Y.-K.J.; writing, B.-Y.L., C.-W.L., and Y.-K.J.; project administration, B.-Y.L. and L.-L.L. All authors have read and agreed to the published version of the manuscript.
Funding
This work was supported by the National Science and Technology Council, Taiwan (NSTC 112-2637-E-241-002 and NSTC 113-2221-E-035-014) to L.-L.L. and B.-Y.L.
Data availability
The data that support the findings of this study are not openly available due to reasons of sensitivity and are available from the corresponding author upon reasonable request. Data are located in controlled access data storage at Cheng-Ching General Hospital, Taiwan.
Declarations
Competing interests
The authors declare no competing interests.
Footnotes
Publisher’s note
Springer Nature remains neutral with regard to jurisdictional claims in published maps and institutional affiliations.
References
- 1.Schondorf, R. & Low, P. A. Idiopathic postural orthostatic tachycardia syndrome: an attenuated form of acute pandysautonomia? Neurology. 43 (1_part_1), 132–132 (1993). [DOI] [PubMed] [Google Scholar]
- 2.Satish, R. et al. Canadian Cardiovascular Society Position Statement on Postural Orthostatic Tachycardia Syndrome (POTS) and related disorders of Chronic Orthostatic Intolerance. Can. J. Cardiol.36 (3), 357–372 (2020). [DOI] [PubMed] [Google Scholar]
- 3.Vernino, S. et al. Postural orthostatic tachycardia syndrome (POTS): state of the science and clinical care from a 2019 National institutes of Health Expert Consensus Meeting - Part 1. Auton. Neurosci.235, 102828 (2021). [DOI] [PMC free article] [PubMed] [Google Scholar]
- 4.Blitshteyn, S. Is postural orthostatic tachycardia syndrome (POTS) a central nervous system disorder? J. Neurol.269 (2), 725–732 (2022). [DOI] [PMC free article] [PubMed] [Google Scholar]
- 5.Mar, P. L. & Raj, S. R. Postural Orthostatic Tachycardia Syndrome: mechanisms and New therapies. Annu. Rev. Med.71, 235–248 (2020). [DOI] [PubMed] [Google Scholar]
- 6.Nardone, M., Guzman, J., Harvey, P. J., Floras, J. S. & Edgell, H. Effect of a neck compression collar on cardiorespiratory and cerebrovascular function in postural orthostatic tachycardia syndrome (POTS). J. Appl. Physiol.128 (4), 907–913 (2020). [DOI] [PubMed] [Google Scholar]
- 7.Swai, J. et al. Heart rate and heart rate variability comparison between postural orthostatic tachycardia syndrome versus healthy participants; a systematic review and meta-analysis. BMC Cardiovasc. Disord. 19, 320 (2019). [DOI] [PMC free article] [PubMed] [Google Scholar]
- 8.Stewart, J. M., Warsy, I. A., Visintainer, P., Terilli, C. & Medow, M. S. Supine Parasympathetic Withdrawal and Upright Sympathetic Activation Underly abnormalities of the Baroreflex in Postural Tachycardia Syndrome: effects of Pyridostigmine and Digoxin. Hypertension. 77 (4), 1234–1244 (2021). [DOI] [PMC free article] [PubMed] [Google Scholar]
- 9.Boris, J. R. Postural orthostatic tachycardia syndrome in children and adolescents. Auton. Neurosci.215, 97–101 (2018). [DOI] [PubMed] [Google Scholar]
- 10.Novak, P., Felsenstein, D., Mao, C., Octavien, N. R. & Zubcevik, N. Association of small fiber neuropathy and post treatment Lyme disease syndrome. PLoS One. 14 (2), e0212222 (2019). [DOI] [PMC free article] [PubMed] [Google Scholar]
- 11.Grubb, A. F. & Grubb, B. P. Postural orthostatic tachycardia syndrome: new concepts in pathophysiology and management. Trends Cardiovasc. Med.S1050-1738 (21), 00122–00125 (2021). [DOI] [PubMed] [Google Scholar]
- 12.Olshansky, B. et al. Postural Orthostatic Tachycardia Syndrome (POTS): a critical assessment. Prog. Cardiovasc. Dis.63 (3), 263–270 (2020). [DOI] [PMC free article] [PubMed] [Google Scholar]
- 13.Bourne, K. M. et al. Postural orthostatic tachycardia syndrome is associated with significant employment and economic loss. J. Intern. Med.290 (1), 203–212 (2021). [DOI] [PMC free article] [PubMed] [Google Scholar]
- 14.Swai, J., Hu, Z., Zhao, X., Rugambwa, T. & Ming, G. Heart rate and heart rate variability comparison between postural orthostatic tachycardia syndrome versus healthy participants; a systematic review and meta-analysis. BMC Cardiovasc. Disord.19 (1), 320 (2019). [DOI] [PMC free article] [PubMed] [Google Scholar]
- 15.Mallien, J., Isenmann, S., Mrazek, A. & Haensch, C. A. Sleep disturbances and autonomic dysfunction in patients with postural orthostatic tachycardia syndrome. Front. Neurol.5, 118 (2014). [DOI] [PMC free article] [PubMed] [Google Scholar]
- 16.Julia, B. & Reiner, B. The postural orthostatic stress syndrome in childhood: HRV analysis and the active standing test. Prev. Med.3, 1–7 (2020). [Google Scholar]
- 17.Carew, S. et al. A review of postural orthostatic tachycardia syndrome. Europace: Eur. Pacing Arrhythm. Cardiac Electrophysiol. : J. Working Groups Cardiac Pacing Arrhythm. Cardiac Cell. Electrophysiol. Eur. Soc. Cardiol.11 (1), 18–25 (2009). [DOI] [PubMed] [Google Scholar]
- 18.van der Zalm, T. et al. Postural orthostatic tachycardia syndrome (POTS): a common but unfamiliar syndrome. Neth. J. Med.77 (1), 3–9 (2019). [PubMed] [Google Scholar]
- 19.Williams, E. L. et al. Salt supplementation in the management of orthostatic intolerance: Vasovagal syncope and postural orthostatic tachycardia syndrome. Auton. Neurosci. Basic Clin. 237, 102906 (2022). [DOI] [PubMed]
- 20.Blitshteyn, S. & Whitelaw, S. Postural orthostatic tachycardia syndrome (POTS) and other autonomic disorders after COVID-19 infection: a case series of 20 patients. Immunol. Res.69 (2), 205–211 (2021). [DOI] [PMC free article] [PubMed] [Google Scholar]
- 21.Miglis, M. G. et al. A case report of postural tachycardia syndrome after COVID-19. Clin. Auton. Research: Official J. Clin. Auton. Res. Soc.30 (5), 449–451 (2020). [DOI] [PMC free article] [PubMed] [Google Scholar]
- 22.Oketa-Onyut Julu, P. Normal autonomic neurophysiology of postural orthostatic tachycardia and recommended physiological assessments in postural orthostatic tachycardia syndrome. Physiol. Rep.8 (12), e14465 (2020). [DOI] [PMC free article] [PubMed] [Google Scholar]
- 23.Laitinen, T. et al. Age and gender dependency of baroreflex sensitivity in healthy subjects. J. Appl. Physiol. (1985). 84 (2), 576–583 (1998). [DOI] [PubMed] [Google Scholar]
- 24.Lanfranchi, P. A. & Somers, V. K. Arterial baroreflex function and cardiovascular variability: interactions and implications. Am. J. Physiol. Regul. Integr. Comp. Physiol.283 (4), R815–R826 (2002). [DOI] [PubMed] [Google Scholar]
- 25.Jíra, M., Závodná, E., Honzíková, N., Nováková, Z. & Fiser, B. Baroreflex sensitivity is an individual characteristic feature. Physiol. Res.55 (3), 349–351 (2006). [DOI] [PubMed] [Google Scholar]
- 26.La Rovere, M. T., Pinna, G. D. & Raczak, G. Baroreflex sensitivity: measurement and clinical implications. Annals Noninvasive Electrocardiology: Official J. Int. Soc. Holter Noninvasive Electrocardiol. Inc. 13 (2), 191–207 (2008). [DOI] [PMC free article] [PubMed] [Google Scholar]
- 27.Dutra-Marques, A. C. et al. She exaggerated exercise blood pressure as a marker of baroreflex dysfunction in normotensive metabolic syndrome patients. Front. NeuroSci.15, 680195 (2021). [DOI] [PMC free article] [PubMed] [Google Scholar]
- 28.Michal Javorka, Z. et al. Baroreflex analysis in diabetes mellitus: linear and nonlinear approaches. Med. Biol. Eng. Comput. 49, 279–288 (2011). [DOI] [PubMed]
- 29.Xiao, M. X. et al. Application of a speedy modified entropy method in assessing the complexity of baroreflex sensitivity for age-controlled healthy and diabetic subjects. Entropy21(9), 894 (2019).
- 30.Cseh, D. et al. Type 2 Diabetes Mellitus Is Independently Associated With Decreased Neural Baroreflex Sensitivity: The Paris Prospective Study III. Thromb. Vascular Biology, 40(5), 1420–1428. (2020). [DOI] [PubMed] [Google Scholar]
- 31.Ziegler, D. et al. Association of Lower Cardiovagal Tone and Baroreflex Sensitivity with Higher Liver Fat Content early in type 2 diabetes. J. Clin. Endocrinol. Metab.103 (3), 1130–1138 (2018). [DOI] [PubMed] [Google Scholar]
- 32.Persson, P. B. et al. Time versus frequency domain techniques for assessing baroreflex sensitivity. J. Hypertens.19 (10), 1699–1705 (2001). [DOI] [PubMed] [Google Scholar]
- 33.Swenne, C. A. Baroreflex sensitivity: mechanisms and measurement. Neth. Heart Journal: Monthly J. Neth. Soc. Cardiol. Neth. Heart Foundation. 21 (2), 58–60 (2013). [DOI] [PMC free article] [PubMed] [Google Scholar]
- 34.Kawada, T., Saku, K. & Miyamoto, T. Closed-Loop Identification of Baroreflex Properties in the frequency domain. Front. NeuroSci.15, 694512 (2021). [DOI] [PMC free article] [PubMed] [Google Scholar]
- 35.Laude, D. et al. Comparison of various techniques to estimate spontaneous baroreflex sensitivity (the EuroBaVar study). Am. J. Physiol. Regul. Integr. Comp. Physiol.286 (1), R226–R231 (2004). [DOI] [PubMed] [Google Scholar]
- 36.Medow, M. S., Del Pozzi, A. T., Messer, Z. R., Terilli, C. & Stewart, J. M. Altered oscillatory cerebral blood flow velocity and autoregulation in postural tachycardia syndrome. Front. Physiol.5, 234 (2014). [DOI] [PMC free article] [PubMed] [Google Scholar]
- 37.Schondorf, R., Benoit, J. & Stein, R. Cerebral autoregulation is preserved in postural tachycardia syndrome. J. Appl. Physiol. (1985). 99 (3), 828–835 (2005). [DOI] [PubMed] [Google Scholar]
- 38.Ocon, A. J., Medow, M. S., Taneja, I., Clarke, D. & Stewart, J. M. Decreased upright cerebral blood flow and cerebral autoregulation in normocapnic postural tachycardia syndrome. Am. J. Physiol. Heart Circ. Physiol.297 (2), H664–H673 (2009). [DOI] [PMC free article] [PubMed] [Google Scholar]
- 39.Schondorf, R., Benoit, J. & Stein, R. Cerebral autoregulation in orthostatic intolerance. Ann. N Y Acad. Sci.940, 514–526 (2001). [DOI] [PubMed] [Google Scholar]
- 40.Derrick, T. R. & Thomas, J. M. Time Series Analysis: The Cross-Correlation Function 46 (Kinesiology, 2004). [Google Scholar]
- 41.Westerhof, B. E., Gisolf, J., Stok, W. J., Wesseling, K. H. & Karemaker, J. M. Time-domain cross-correlation baroreflex sensitivity: performance on the EUROBAVAR data set. J. Hypertens.22 (7), 1371–1380 (2004). [DOI] [PubMed] [Google Scholar]
- 42.Silvani, A., Magosso, E., Bastianini, S., Lenzi, P. & Ursino, M. Mathematical modeling of cardiovascular coupling: Central autonomic commands and baroreflex control. Auton. Neuroscience: Basic. Clin.162 (1-2), 66–71 (2011). [DOI] [PubMed] [Google Scholar]
- 43.Yeh, S. J., Lung, C. W., Jan, Y. K. & Liau, B. Y. Advanced cross-correlation function application to identify arterial Baroreflex sensitivity variations from healthy to diabetes Mellitus Front. Neurosci. 16, 812302 (2022). [DOI] [PMC free article] [PubMed] [Google Scholar]
- 44.Liau, B. Y. et al. Using cross-correlation analysis of multi-channel near infrared spectroscopy to assess the hemodynamic response to cupping therapy. Biomed Opt. Exp. 14(9), 4455–4467 (2023). [DOI] [PMC free article] [PubMed]
- 45.Panerai, R. B., Kelsall, A. W., Rennie, J. M. & Evans, D. H. Analysis of cerebral blood flow autoregulation in neonates. IEEE Trans. Bio Med. Eng.43 (8), 779–788 (1996). [DOI] [PubMed] [Google Scholar]
- 46.Steinmeier, R. et al. Slow rhythmic oscillations of blood pressure, intracranial pressure, microcirculation, and cerebral oxygenation. The dynamic interrelation and time course in humans. Stroke. 27 (12), 2236–2243 (1996). [DOI] [PubMed] [Google Scholar]
- 47.Czosnyka, M., Smielewski, P., Kirkpatrick, P., Menon, D. K. & Pickard, J. D. Monitoring of cerebral autoregulation in head-injured patients. Stroke. 27 (10), 1829–1834 (1996). [DOI] [PubMed] [Google Scholar]
- 48.Chiu, C. C. & Yeh, S. J. Assessment of cerebral autoregulation using time-domain cross-correlation analysis. Comput. Biol. Med.31 (6), 471–480 (2001). [DOI] [PubMed] [Google Scholar]
- 49.Panerai, R. B. et al. Multivariate dynamic analysis of cerebral blood flow regulation in humans. IEEE Trans. Bio Med. Eng.47 (3), 419–423 (2000). [DOI] [PubMed] [Google Scholar]
- 50.Chiu, C. C., Yeh, S. J. & Liau, B. Y. Assessment of Cerebral Autoregulation dynamics in diabetics using Time-Domain Cross-correlation Analysis. J. Med. Bio Eng.25 (2), 53–59 (2005). [DOI] [PubMed] [Google Scholar]
- 51.Nasr, N. et al. Baroreflex and cerebral autoregulation are inversely correlated. Circ. J.78 (10), 2460–2467 (2014). [DOI] [PubMed] [Google Scholar]
- 52.Novak, P. & Marciano, S. Hypocapnic Orthostatic Intolerance with (POTS) and without (HYCH) tachycardia represent a spectrum of the same disorder (S43. 003). Neurology. 100 (17_supplement_2), 3757 (2023). [Google Scholar]
- 53.Saha, L. Irritable bowel syndrome: pathogenesis, diagnosis, treatment, and evidence-based medicine. World J. Gastroenterol.20 (22), 6759–6773 (2014). [DOI] [PMC free article] [PubMed] [Google Scholar]
- 54.Camilleri, M. Diagnosis and treatment of irritable bowel syndrome: a review. Jama. 325 (9), 865–877 (2021). [DOI] [PubMed] [Google Scholar]
Associated Data
This section collects any data citations, data availability statements, or supplementary materials included in this article.
Data Availability Statement
The data that support the findings of this study are not openly available due to reasons of sensitivity and are available from the corresponding author upon reasonable request. Data are located in controlled access data storage at Cheng-Ching General Hospital, Taiwan.


