Abstract
The objective of this study was to evaluate the effects of methionine supplementation prior to and during a lipopolysaccharide (LPS) challenge on the performance and inflammatory biomarkers of receiving beef steers. Steers (n = 65; 295.8 ± 46.5 kg) were randomly assigned to 3 treatment groups: L0 = Control, receiving no supplement; L1 = 10 g/hd/d rumen-protected methionine (MetaSmart, Adisseo USA Inc., Alpharetta, GA); and L2 = 20 g/hd/d rumen-protected methionine and fed for 40 d at the West Texas A&M University Research Feedlot. On day 40, a subset of steers (n = 32; L0 = 10; L1 = 11; L2 = 11) were transported to the USDA Livestock Issues Research Unit, and on day 41 steers were weighed and fitted with indwelling rectal thermometers and jugular catheters. On day 42, steers were challenged i.v. with LPS (0.25 µg/kg BW). Blood samples were collected at −2, 0, 2, 4, 6, 8, 10, 12, 18, 24, 36, and 48 h relative to the LPS administration at 0 h. Serum was isolated to determine serum chemistry and inflammatory marker concentrations. Whole blood was used for hematology analysis. There were no differences in DMI or ADG (P ≥ 0.75) during 35 d of supplementation. A treatment × time interaction (P = 0.01) occurred for rectal temperature, where L2 steers had the greatest temperature following the challenge (P ≤ 0.05) compared to L1 and L0 steers. There was a treatment × time interaction (P = 0.03) for the change in white blood cells where L0 steers had the greatest change compared to L1 and L2 steers at various timepoints. There was a treatment × time interaction (P = 0.02) for the change in tumor necrosis factor-α concentration, where there was a greater increase in concentration in L0 compared to L1 and L2 steers. Additionally, there was a treatment × time interaction (P < 0.01) for Macrophage Inflammatory Protein-1β (MIP-1β) concentrations, where concentrations were greater in L0 compared with L1 and L2 steers from 2 to 4 h post-challenge. There was a treatment × time interaction for plasma total protein concentration (P < 0.01) where L0 steers had less plasma total protein compared with L1 and L2 steers, while L1 steers had less plasma total protein than L2 steers at −2 h prior to LPS challenge. These data suggest that methionine supplementation may have an immunomodulatory effect in beef steers that may improve response to pathogens.
Keywords: acute phase response, cytokines, lipopolysaccharide, methionine, receiving period
The effect of methionine supplementation during the receiving period of beef steers, and its further impact on the immune response to lipopolysaccharide in beef steers was studied. Supplementation of rumen-protected methionine may improve the health and wellness of beef steers during a critical period in their growth and development.
Introduction
The receiving period is a stressful event in the life of beef cattle, where cattle are subjected to transportation, commingling, potential disease, and decreased feed intake (Duff and Galyean, 2007). When combined, these stressors ultimately contribute to decreased immune defenses, leaving cattle vulnerable to illness such as bovine respiratory disease (BRD; Rice et al., 2007; Taylor et al., 2010). Bovine respiratory disease, and other illnesses, contribute to substantial economic loss, costing producers excessive amounts of pharmaceuticals, decreased productivity, and ultimate product loss with increased mortality (Loerch and Fluharty, 1999). Prior studies have recognized a reduced net return of $385/steer when treated 3 or more times for illness in a feedlot (Blakebrough-Hall et al., 2020), while improving the health and management of cattle at the feedlot may improve profitability by up to $67.11 per animal. Thus, it is necessary to improve the health and productivity of cattle entering feedlots.
Rumen-protected methionine has been unique to the dairy industry for over a decade, offering methionine supplementation without rumen degradation. The product in the current study is a chemical derivative of methionine, the isopropyl ester of 2-hydroxy-4-(methylthio)-butanoic acid (HMBi). Fifty percent is absorbed through the rumen wall and available as metabolizable methionine while the other 50% is available as HMB for utilization in the rumen. Rumen-protected methionine (57% HMBi, 78% methionine equivalent, 50% metabolizable) delivers 22.2% metabolizable methionine; therefore, 10 g of product supplies 2.2 g of methionine (Molano et al., 2020). Rumen-protected methionine has been evaluated in studies in pregnant beef cattle (Waterman et al., 2012; Silva et al., 2021) but the effect on the immune response of beef cattle has not been evaluated. The benefits of a ruminally protected methionine supplement have become increasingly evident in production (Silva et al., 2021).
Because of the benefits provided in prior studies by methionine supplementation in dairy cattle (Zhou et al., 2016; Vailati-Riboni et al., 2017), it was hypothesized that supplemented beef cattle would show improved health outcomes to an acute immune challenge. Therefore, the objective of this study was to determine the effect of supplementing beef steers with rumen-protected methionine on the acute phase response following a lipopolysaccharide (LPS) challenge.
Materials and Methods
All experimental procedures were in compliance with the Guide for the Care and Use of Agricultural Animals in Research and Teaching and approved by the Institutional Animal Care and Use Committee at West Texas A&M University (IACUC Protocol # 2021.03.001) and the Livestock Issues Research Unit (IACUC Protocol # 2119S).
Experimental Design
A total of 65 steers (287.1 ± 45.7 kg), sourced from auction markets in central and east Texas arrived at the West Texas A&M University Research Feedlot (WTRF) on February 23, 2021 (d −1) and were placed in holding pens overnight with free access to water, Bermudagrass hay (0.5 % BW), and a standard receiving ration (0.5% BW; Table 1). On day 0, steers were processed and allocated to treatment pens (n = 5 pens with 11 head per pen for each treatment group, and 1 pen of 10 for the L0 treatment group) based on pre-shipment BW collected at the auction markets. Preexisting ear tags were used for individual identification. Steers were weighed, implanted (Component E-S with Tylan; Elanco Animal Health, Greenfield, IN), treated internal and external parasites (Valbazen; Zoetis, Parsippany, NJ; Ivermax Plus; Aspen Veterinary Resources, Loveland, CO), vaccinated for respiratory disease (Bovi-Shield Gold 5; Zoetis), bacterial pneumonia (Once PMH; Merck Animal Health, Madison, NJ), and Clostridium varieties (Cavalry 9; Merck Animal Health) according to feedlot entrance protocol. Following the allocation of steers to treatment pens, pens were randomly assigned to receive 1 of 3 supplement treatments: 1) standard receiving ration supplemented with ground corn carrier (L0; n = 21), 2) standard receiving ration supplemented with 10 g/steer/d ruminally protected methionine (MetaSmart, Adisseo USA Inc., Alpharetta, GA), in a ground corn carrier (L1; n = 22), or 3) standard receiving ration supplemented with 20 g/steer/d ruminally protected methionine (MetaSmart, Adisseo USA Inc., Alpharetta, GA) in a ground corn carrier (L2; n = 22). Methionine supplement was top-dressed using a ground corn carrier at a rate of 0.45 kg/steer/d and mixed in the bunk of the assigned treatment pens immediately following feed delivery once daily. The L1 treatment group received 2.2 g/steer/d of methionine, while the L2 group received 4.4 g/steer/d of methionine. Feed bunks were evaluated daily at approximately 0630 hours. Unconsumed feed was collected and weighed, and a dry matter sample was taken to determine daily DMI. Steers were fed and supplements were provided once daily at approximately 0800 hours. Water tanks were cleaned thoroughly once weekly. Bunks were swept following precipitation.
Table 1.
Composition of the standard receiving ration fed to steers throughout the study period
| Ingredients | %1 |
|---|---|
| Steam-flaked corn | 28.54 |
| Molasses | 7.00 |
| KS01 supplement2 | 3.46 |
| Corn stalks | 19.00 |
| SweetBran3 | 42.00 |
1DM basis.
2Supplement contained 28.0% crude protein (Min.), 1.1% crude fat (Min.), 5.6% crude fiber (Max), 21.8% to 28% calcium, 0.1% phosphorus (Min.), 7.0% to 8.3% salt, 0.3% potassium, and 117,000 iU/lb of vitamin A.
3Cargill, Corn Milling, Blair, NE, USA.
Clinical health was assessed daily by trained WTRF employees and given daily clinical illness scores (CIS; Table 2). Steers displaying a CIS of 2 or greater were taken to the hospital pen and rectal temperatures (RTs) were recorded. Steers with a RT ≥ 39.7 °C were treated for BRD with an antimicrobial following a pre-determined regimen: steers were treated first with tildipirosin (Zuprevo; Merck Animal Health), the second treatment received florfenicol (Nuflor; Merck Animal Health), and the final treatment consisted of enrofloxacin (Baytril; Bayer Corporation, Whippany, NJ). Steers receiving all 3 treatments were considered chronically ill and did not receive further treatment for BRD.
Table 2.
Clinical illness score description1
| Clinical illness score | Description | Appearance |
|---|---|---|
| 0 | Healthy | Normal |
| 1 | Slightly ill | Inappetence, nasal/ocular discharge |
| 2 | Moderately ill | Gaunt, nasal/ocular discharge, lags behind other animals in group, coughing, labored breathing |
| 3 | Severely ill | Purulent nasal/ocular discharge, labored breathing, not responsive to human approach |
| 4 | Moribund | Near death |
Adapted from Pillen et al. (2016).
1Clinical illness score (CIS) determined daily by trained animal care personnel to determine morbidity in feedlot in cattle. The CIS was used to monitor illness during the feeding portion of the study.
Lipopolysaccharide Challenge
On April 5, 2021 (day 40), a subset of steers (n = 32; L0 = 10, L1 = 11, L2 = 11) were selected for the LPS challenge based on uniformity of temperament, BW, treatment history, and health status within treatment groups, and were transported approximately 165 km to the Livestock Issues Research Unit’s Liberty Farm Research Complex in Lubbock, TX. Upon arrival, steers were placed in 3 covered, outdoor dirt holding pens according to treatment. Steers had ad libitum access to water and the same receiving ration with treatment supplements when at WTTRF. On day 41, steers were weighed and fitted with an indwelling rectal temperature (RT) measuring device (Reuter et al., 2010) programmed to measure RT at 5-min intervals and an indwelling jugular catheter (Burdick Sanchez et al., 2013). Following processing, steers were placed in individual bleeding stalls (2.5 m × 6 m) in an enclosed, temperature-controlled barn for the duration of the LPS challenge. Steers were fed once daily with their respective supplement treatments and had free access to water. Individual water intake was measured while steers were individually housed in the barn via a Suevia Cup (QC Supply Inc., Schuyler, NE, USA) that was connected to a custom-built water intake monitoring system that allowed for the measurement of individual water intake as well as water intake bouts. Steers were challenged intravenously with LPS (0.25 µg/kg BW; LPS from E. coli O111:B4, Sigma Aldrich, St. Louis, MO) on day 42. Whole blood was collected at −2, 0, 2, 4, 6, 8, 10, 12, 18, 24, 36, and 48 h relative to the LPS administration at 0 h. Whole blood was collected in 4-mL vacutainers containing EDTA for analysis of complete blood counts using a ProCyte Dx Hematology Analyzer (IDEXX Laboratories, Inc., Westbrook, ME). A second sample was collected using 9-mL monovette tubes containing no additive (Sarstedt Inc., Newton, NC) for isolation of serum. The third and fourth samples were collected into 4-mL vacutainers containing EDTA or lithium-heparin for isolation of plasma.
Following collection of the 48-h sample on day 44, steers were removed from the bleeding stalls and processed through the working facility for the collection of final BW and removal of RT devices and jugular catheters. Steers were also administered tildipirosin (Zuprevo, Merck Animal Health). Steers were placed in outside holding pens with access to feed and water until the steers were returned to WTRF on April 12, 2021.
Sickness Behavior Scores
A trained evaluator assessed and recorded sickness behavior scores (SBS; Table 3) of each steer by visual observation prior to the collection of each blood sample (Carroll et al., 2017). Steers were evaluated on a scale of 1 to 5, where steers showing a health score of 1 displayed normal maintenance behaviors. Steers showing a SBS of 2 were calm but less alert and responsive; steers scored as 3 were calm with distended or tucked heads and mild respiratory problems; steers scored as 4 displayed clinical signs of illness, respiratory problems, and were unresponsive; while steers scored as 5 were unresponsive with severe respiratory distress, mucus and frothing at the mouth.
Table 3.
Sickness behavior score description1 recorded on each steer prior to the collection of each blood sample during the LPS challenge (0.25 µg/kg BW)
| Score | Description |
|---|---|
| 1 | Normal, alert, ears erect; head level or high, eyes open, standing, locomotor activity, responsive, performing maintenance behaviors |
| 2 | Calm, but less alert, less activity, less responsive, standing or lying ventral, semi-lateral |
| 3 | Lying, calm, head distended or tucked, less alert, signs of some mild respiratory problems (coughing or wheezing) |
| 4 | Clinical signs of sickness, respiratory problems, not responsive, head distended, lethargic |
| 5 | All/most respiratory problems, mucus/foam. Head distended, not responsive, medical intervention required |
1Sickness behavior score rubric used during the LPS challenge portion of the study as adapted by Carroll et al. (2015).
Serum and Plasma Analyses
Blood collected for plasma isolation was centrifuged immediately following collection at 1,250 × g for 20 min at 4 °C. Blood collected for serum isolation was allowed to clot at room temperature for 30 min prior to being centrifuged at 1,250 × g for 20 min at 4 °C. Plasma and serum samples were aliquoted and stored at −80 °C until further analysis.
Serum samples were evaluated for cortisol, cytokines, haptoglobin, serum amyloid-A, and non-esterified fatty acid (NEFA) concentrations. Cortisol concentrations were determined using a cortisol EIA kit (Arbor Assays, Ann Arbor, MI). Haptoglobin and serum amyloid-A concentrations were evaluated using ELISA kits (Immunology Consultants Laboratory, Inc., Portland, OR; Fisher Scientific, respectively) according to manufacturer’s directions. Serum NEFA concentrations were determined by a modification of the Wake HR Series NEFA-HR(2) protocol (FUJIFILM Wako Chemicals U.S.A. Corporation, Richmond, VA). Intra- and Inter-assay coefficients of variation were less than 11.7% and 18.5% for all assays. Serum cytokine concentrations were measured using the Quantibody bovine cytokine array (RayBiotech Life, Inc., Peachtree Corners, GA). Plasma samples were analyzed for chemistry variables using the Comprehensive Profile on the Vetscan VS2 Chemistry Analyzer (Zoetis). The comprehensive profile quantified concentrations of sodium, potassium, total protein (TP), total bilirubin, phosphorus, blood urea nitrogen, calcium, alkaline phosphate, albumin, alanine aminotransferase, amylase, globulin, glucose, and creatine.
Statistical Analysis
Prior to analysis, RT data were averaged into 1-h intervals. All RT, SBS, hematology, serum, and plasma variables measured during the LPS challenge were analyzed using PROC MIXED in SAS (SAS v9.4, SAS Inst. Inc., Cary, NC) specific for repeated measures. Fixed effects were treatment, time, and their interaction, where steer was the experimental unit. The covariance structure that resulted in the smallest Akaike and Schwartz Bayesian criteria was selected for each analysis. Performance data during the treatment application (feeding period, days 0 to 35) were analyzed with PROC MIXED, and pen was considered the experimental unit for these data. Significant effects were determined at α = 0.05, with tendencies established when α > 0.05 but ≤ 0.10. When significant, fixed effects were separated using the PDIFF option in SAS. Data are presented as the LSM ± SEM.
Results
Receiving Performance
There was no effect of methionine supplementation on DMI and ADG from 0 to 35 d (P ≥ 0.75; Table 4). However, there tended (P = 0.09) to be a supplementation effect for G:F, where steers receiving the L2 supplement exhibited a tendency for greater G:F than the control (L0) steers.
Table 4.
Effects of methionine supplementation at 0 (L0), 2.2 (L1), or 4.4 (L2) g/steer/d on feedlot receiving performance in steers from days 0 to 35
| Treatment1 | |||||
|---|---|---|---|---|---|
| Variable | L0 | L1 | L2 | SEM | P-value |
| Initial BW, kg | 287.71 | 287.87 | 286.14 | 10.136 | 0.99 |
| Final BW, kg | 364.95 | 365.51 | 361.10 | 12.623 | 0.96 |
| DMI, kg | 8.30 | 8.21 | 7.90 | 0.370 | 0.75 |
| ADG, kg | 2.41 | 2.42 | 2.39 | 0.100 | 0.97 |
| Gain:feed | 0.29b | 0.30ab | 0.30a | 0.003 | 0.09 |
1L0 = negative control, no methionine; L1 = 10 g/hd/d of methionine; L2 = 20 g/hd/d of methionine.
a,bMeans within rows lacking common superscripts tended to differ, P ≤ 0.10.
Rectal Temperature
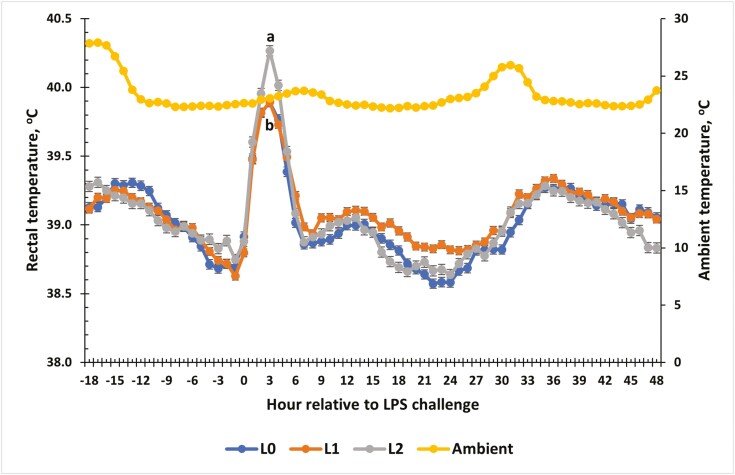
A treatment × time interaction was observed for RT relative to the LPS challenge (P = 0.01; Fig. 1). Rectal temperatures were similar for all steers from −18 to 2 h (P > 0.05). At 3 h post-LPS administration, L2 steers had the greatest RT (P ≤ 0.05) compared with L0 and L1 steers, while L2 steers had greater RT than L1 steers at 3, 4, 17, and 18 h post-challenge (P ≤ 0.05). Additionally, L1 steers had greater (P = 0.05) RT than L0 steers at 23 h post-challenge.
Figure 1.
The effect of supplementing receiving steers with methionine at 0 (L0), 2.2 (L1), or 4.4 (L2) g/steer/d for 40 d on the rectal temperature (RT) response to an LPS (0.25 µg/kg body weight) challenge. Rectal temperature was measured every 5-min throughout the study and was averaged into 1-h intervals prior to analysis. There was a treatment × time interaction (P = 0.01) for RT. a,bTreatments with different superscripts within time points differ P < 0.05.
Water Intake
There was no interaction between time and treatment on water intake (P = 0.72) nor a treatment effect (P = 0.14). However, water intake, measured in mL consumed/h, increased over time (P < 0.01; data not shown). In contrast, there was a treatment effect on drinking bouts per hour (P < 0.01). Drinking bouts account for the frequency of drinks from the water bowl greater than 5 s, which were greater for L1 and L2 steers (L1 = 4.02 ± 0.14; L2 = 3.97 ± 0.14) than L0 steers (3.46 ± 0.14; P ≤ 0.02).
Sickness Behavior Scores
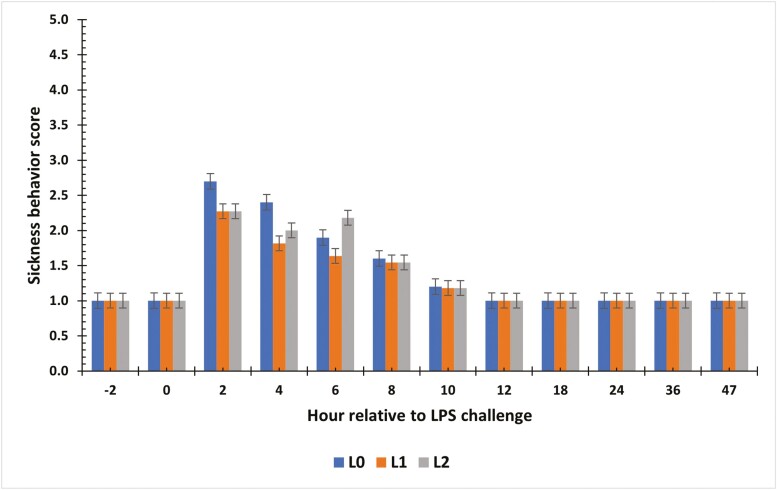
There was a tendency for a treatment × time interaction for SBS during the LPS challenge (P = 0.08; Fig. 2). At −2 and 0 h, steers displayed similar SBS (P > 0.05; all steers had a score of 1). At 2 h and 4 h post-challenge, L0 steers had greater SBS (P ≤ 0.01) compared with supplemented steers. However, at 6 h post-challenge, L2 steers had the greater SBS score compared to L1 steers (P < 0.01). By 8 h post-challenge, all steers were similar, and all steers returned to baseline values by 12 h (P > 0.05; all steers had a score of 1).
Figure 2.
The effect of supplementing receiving steers with methionine at 0 (L0), 2.2 (L1), or 4.4 (L2) g/steer/d for 40 d on sickness behavior score in response to an LPS (0.25 µg/kg body weight) challenge. Sickness behavior scores were recorded prior to each blood sample collection on a scale of 1 (normal maintenance behaviors) to 5 (lying on side with labored breathing). There was a tendency (P = 0.08) for a treatment × time interaction.
Hematology and Serum Cortisol
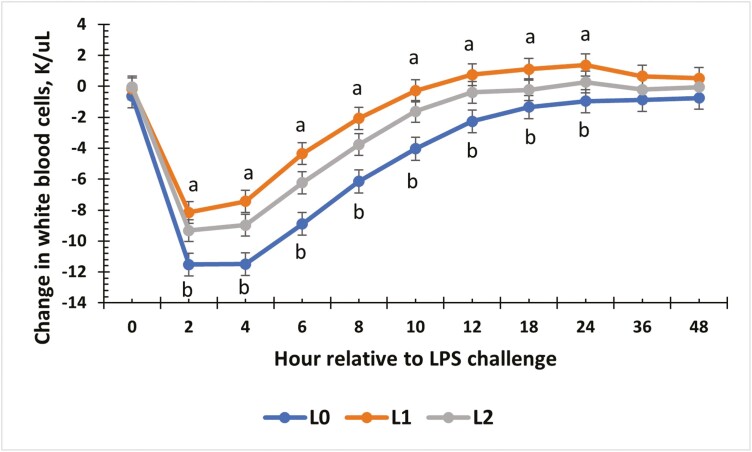
Treatment influenced hemoglobin concentrations throughout the challenge (P = 0.04; Table 5), where steers receiving the L0 treatment had greater concentrations of hemoglobin (P ≤ 0.04) compared with L1 and L2 steers, which were similar (P = 0.66). There was a tendency (P = 0.08) for a treatment × time effect for hemoglobin concentrations, where concentrations were greater in L0 steers compared to L1 from 0 to 4 h, and in L0 steers compared to L2 steers from 2 to 4 h post-LPS administration. There was also a tendency (P = 0.08) for treatment effect on hematocrit, where L0 steers had the greatest percentage compared to L1 steers, while there was no difference between L0 and L2 steers nor L1 and L2 steers (P ≥ 0.22). All other parameters evaluated were not affected by treatment, or a treatment × time interaction (P ≥ 0.34; Table 5). Baseline WBC concentrations were greater in L0 compared to L1 steers from −2 to 0 h (P < 0.01). Based on differences in WBC prior to LPS administration (data not shown; P = 0.01), the change in WBC concentration relative to baseline values (−2 and 0 h) was analyzed. There was a treatment × time interaction (P = 0.05) for the change in WBC concentrations (Fig. 3). Relative concentrations decreased at 2 h for all treatments, but L0 steers showed the greatest decrease (P = 0.03) compared to L1 and L2 steers from 2 to 24 h post-challenge. All other WBC and differentials evaluated were not affected by treatment (P ≥ 0.20), or a treatment × time interaction (P ≥ 0.12; Table 6).
Table 5.
Summary of hematology variables measured in whole blood following LPS administration (0.25 µg/kg body weight) in steers supplemented with methionine at 0 (L0), 2.2 (L1), or 4.4 (L2) g/steer/d for 40 d
| Treatment | P-value | ||||||
|---|---|---|---|---|---|---|---|
| Variable | L0 | L1 | L2 | SEM | Treatment | Time | Interaction |
| Red blood cells, M/µL | 7.10 | 7.04 | 6.73 | 0.16 | 0.20 | <0.01 | 0.36 |
| Hemoglobin, g/dL | 10.59a | 10.08b | 10.16b | 0.14 | 0.04 | <0.01 | 0.08 |
| Hematocrit, % | 30.68 | 29.25 | 29.99 | 0.44 | 0.08 | <0.01 | 0.34 |
| Platelets, K/µL | 381.92 | 365.78 | 390.17 | 28.65 | 0.82 | <0.01 | 0.44 |
a,bMeans within rows lacking common superscripts differ P ≤ 0.05.
Figure 3.
The effect of supplementing receiving steers with methionine at 0 (L0), 2.2 (L1), or 4.4 (L2) g/steer/d for 40 d on the change in white blood cell (WBC) response to an LPS (0.25 µg/kg body weight) challenge. There was a treatment × time interaction for the change in WBC (P = 0.05). a,bTreatments with different superscripts within time points differ P < 0.05.
Table 6.
Summary of white blood cell and differentials measured in whole blood following LPS administration (0.25 µg/kg body weight) in cattle supplemented with methionine at 0 (L0), 2.2 (L1), or 4.4 (L2) g/steer/d for 40 d
| Treatment | P-value | ||||||
|---|---|---|---|---|---|---|---|
| Variable | L0 | L1 | L2 | SEM | Treatment | Time | Interaction |
| White blood cells, K/µL | 10.95 | 10.01 | 10.51 | 0.75 | 0.66 | <0.01 | 0.03 |
| Neutrophils, K/µL | 2.67 | 2.83 | 2.33 | 0.31 | 0.48 | <0.01 | 0.29 |
| Lymphocytes, K/µL | 6.14 | 5.37 | 6.24 | 0.38 | 0.20 | <0.01 | 0.17 |
| Neutrophil:lymphocyte | 0.61 | 0.69 | 0.51 | 0.07 | 0.20 | <0.01 | 0.43 |
| Monocytes, K/µL | 1.48 | 1.42 | 1.56 | 0.12 | 0.72 | <0.01 | 0.83 |
| Eosinophils, K/µL | 0.39 | 0.24 | 0.31 | 0.07 | 0.30 | <0.01 | 0.12 |
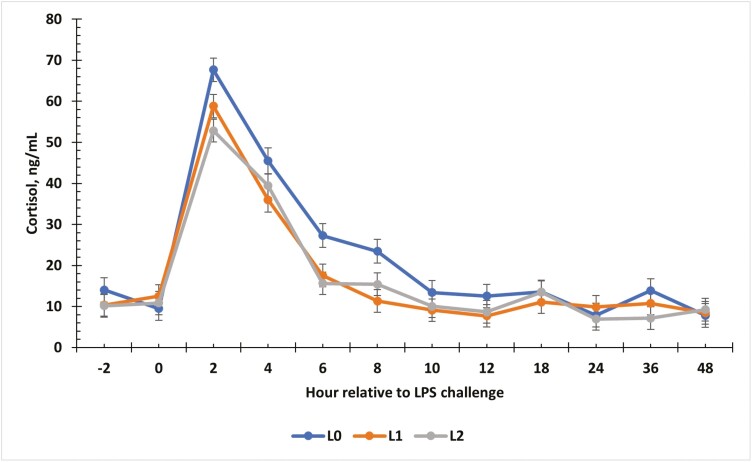
There was a tendency for an interaction between treatment and time for cortisol concentrations in serum (P = 0.06; Fig. 4). Serum cortisol was similar in all treatments from −2 to 0 h (P > 0.05). At 2 h, cortisol concentrations increased following administration of the challenge for all treatment groups (P ≤ 0.02). Serum cortisol concentrations were greatest in L0 steers compared to L1 from 2 to 8 h post-challenge (P = 0.03) and greatest in L0 compared to L2 steers at 2, 6, and 8 h post-challenge (P ≤ 0.04). Cortisol concentrations declined (P ≤ 0.03) from 4 to 12 h and were similar for the remainder of the challenge (P = 0.09).
Figure 4.
The effect of supplementing receiving steers with methionine at 0 (L0), 2.2 (L1), or 4.4 (L2) g/steer/d for 40 d on the serum cortisol response to an LPS (0.25 µg/kg body weight) challenge. There was a tendency (P = 0.06) for a treatment × time interaction on serum cortisol concentrations.
Serum Cytokines and Acute Phase Proteins
A total of 10 cytokines were evaluated in serum throughout the challenge (Table 7). There were no treatment nor treatment × time interactions for interferon-γ (IFN-γ) or interleukin-1 F5 (IL-1 F5; P ≥ 0.12). There were treatment × time interactions for TNF-α (P = 0.03), IL-1α (P < 0.01), IL-21 (P = 0.02), interferon-γ-inducible protein-1 (IP-10; CXC10; P < 0.01), Monokine induced by interferon-γ (MIG; CXCL9; P < 0.01), and macrophage inflammatory protein-1β (MIP-1β; CCL4; P < 0.01). Due to variation in baseline values prior to administration of LPS, the change in concentration relative to baseline values was analyzed for TNF-α, IL-13, IL-1α, IL-21, and MIG.
Table 7.
Summary of serum cytokines measured following LPS administration (0.25 µg/kg body weight) in cattle supplemented with methionine at 0 (L0), 2.2 (L1), or 4.4 (L2) g/steer/d for 40 d
| Treatment | P-value | ||||||
|---|---|---|---|---|---|---|---|
| Cytokine, pg/mL | L0 | L1 | L2 | SEM | Treatment | Time | Interaction |
| Tumor necrosis factor-α (TNF-α) | 214.0 | 198.0 | 260.9 | 92.0 | 0.87 | <0.01 | 0.03 |
| Interferon-γ (IFN-γ) | 69.5 | 169.1 | 299.4 | 99.5 | 0.26 | 0.01 | 0.12 |
| Interferon-α A (IFN-α A) | 18.5 | 26.4 | 20.2 | 4.0 | 0.37 | <0.01 | 0.06 |
| Interleukin-13 (IL-13) | 68.5 | 140.0 | 198.3 | 61.1 | 0.32 | <0.01 | 0.06 |
| Interleukin-1α (IL-1α) | 9.6 | 22.5 | 34.1 | 11.5 | 0.32 | <0.01 | <0.01 |
| Interluekin-1 F5 (IL-1 F5) | 70.1 | 115.6 | 119.0 | 28.9 | 0.41 | <0.01 | 0.40 |
| Interleukin-21 (IL-21) | 850.2 | 1513.8 | 1191.0 | 334.0 | 0.37 | <0.01 | 0.02 |
| Interferon-γ-inducible protein-1- (IP-10; CXCL10) | 515.1 | 447.3 | 488.1 | 29.6 | 0.26 | <0.01 | <0.01 |
| Monokine induced by Interferon-γ (MIG; CXCL9) | 529.1 | 561.2 | 957.7 | 220.9 | 0.30 | <0.01 | <0.01 |
| Macrophage inflammatory protein-1β (MIP-1β; CCL4) | 266.3a | 206.1b | 217.4b | 14.4 | 0.01 | <0.01 | <0.01 |
a,bMeans within rows lacking common superscripts differ P ≤ 0.05
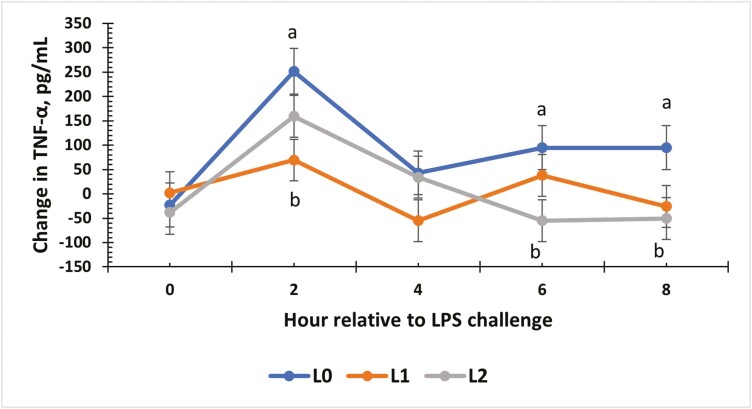
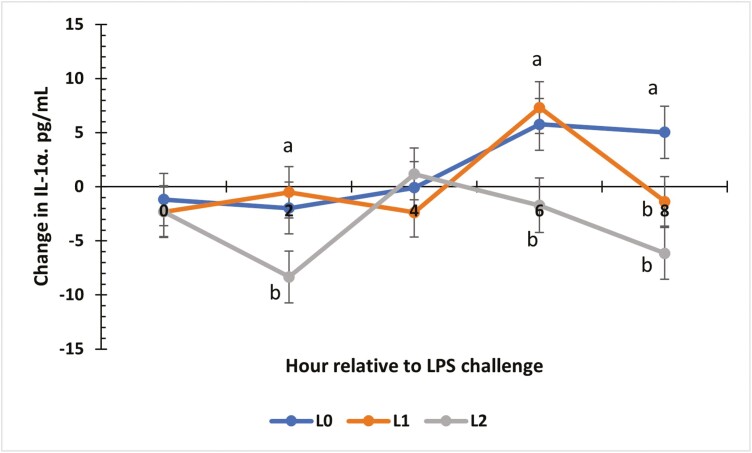
For TNF-α, there was a treatment × time interaction for the change from baseline values (P = 0.02; Fig. 5). At 2 h post-challenge, L0 steers had the greatest increase in concentration compared to L1 steers (P < 0.01), while L2 steers was intermediate. At 4 h, all treatment groups had a similar change from baseline values. At h 6 and 8 of the challenge, L0 steers had the greatest change from baseline concentrations of TNF-α across all treatment groups (P = 0.05). Change from baseline was also evaluated for IL-1α concentrations (Fig. 6), and an interaction between treatment and time occurred (P = 0.02). At 2 h, the greatest change below baseline occurred for L2 steers compared to L0 and L1 (P = 0.02). Values for IL-1α were similar to baseline levels again at 4 h (P = 0.06). At 6 h, L0 and L1 concentrations were above baseline values and greater than L2 (P ≤ 0.03). At 8 h post-challenge, L1 and L2 steers had concentrations similar to baseline values (P = 0.05), while L0 concentrations remained above baseline (P < 0.01).
Figure 5.
The effect of supplementing receiving steers with methionine at 0 (L0), 2.2 (L1), or 4.4 (L2) g/steer/d for 40 d on the change in serum tumor necrosis factor-α (TNF-α) response to an LPS (0.25 µg/kg body weight) challenge. Due to the significant interaction, the change in serum TNF-α concentrations relative to baseline values was analyzed. There was a treatment × time interaction (P = 0.02) for the change in serum TNF-α concentrations. a,bTreatments with different superscripts within time points differ P < 0.05.
Figure 6.
The effect of supplementing receiving steers with methionine at 0 (L0), 2.2 (L1), or 4.4 (L2) g/steer/d for 40 d on the change in serum Interleukin-1α (IL-1α) response to an LPS (0.25 µg/kg body weight) challenge. For the change in IL-1α concentrations, there was a treatment × time interaction (P = 0.02). a,bTreatments with different superscripts within time points differ P < 0.05.
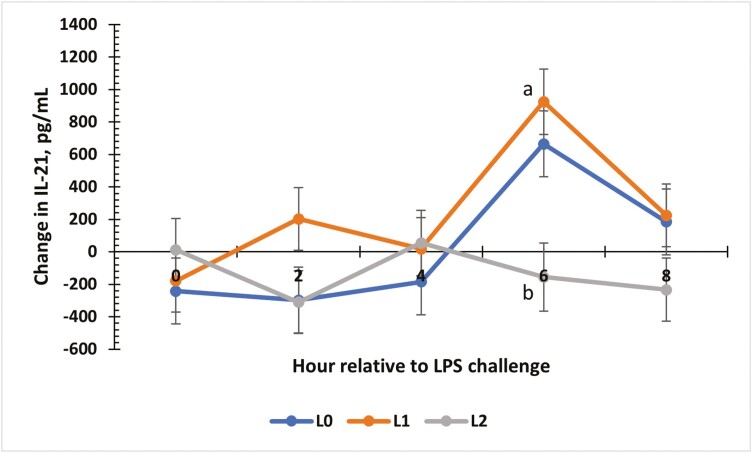
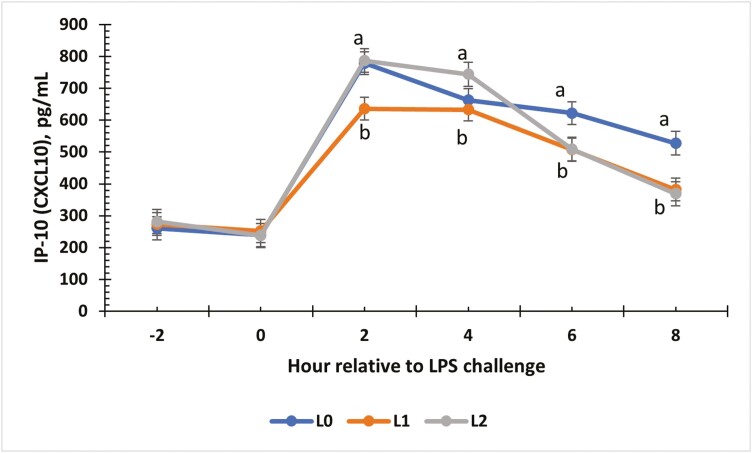
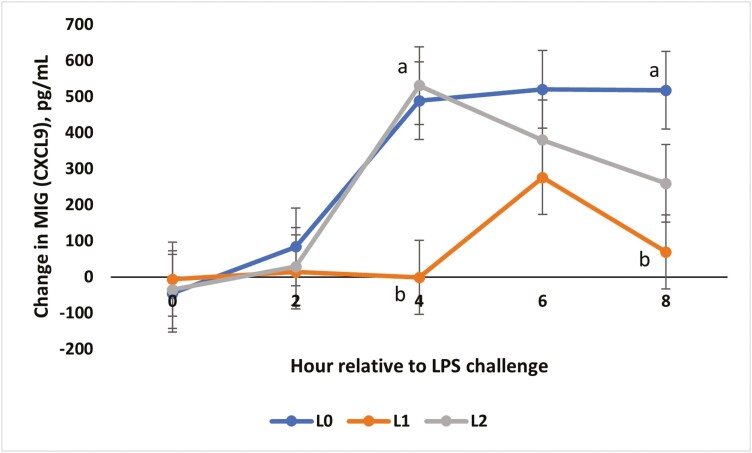
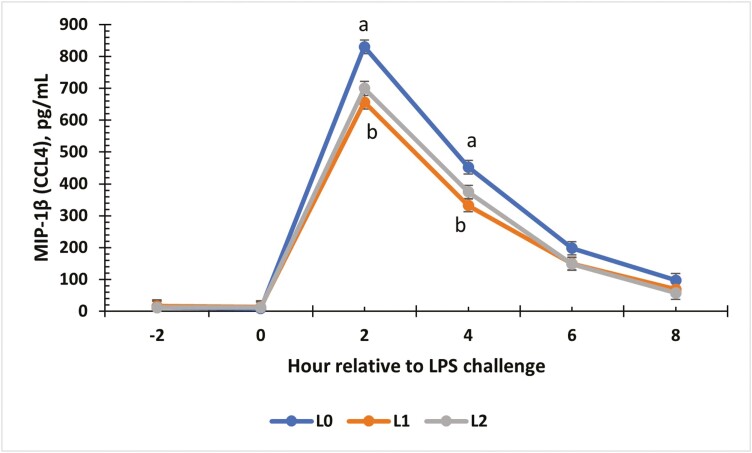
There was a treatment × time interaction for the change from baseline for IL-21 concentrations (P = 0.01; Fig. 7). Changes for all treatment groups were similar at 0, 2, and 4 h (P ≥ 0.06). At 6 h, L1 and L2 steers showed the greatest increase from baseline compared to L0 steers (P < 0.01). An interaction between treatment and time occurred for IP-10 (P < 0.01; Fig. 8). From −2 to 0 h, concentrations for all treatments were similar. At 2 and 4 h, L0 and L2 steers had greater concentrations of IP-10 compared to L1 steers (P < 0.01). At 6 and 8 h, the L1 and L2 steers were similar, while the L0 group had the greatest concentration (P ≤ 0.03). Change from baseline was evaluated for MIG (Fig. 9) and a treatment × time interaction (P < 0.01) was observed. At 4 h, L0 and L2 steers exhibited the greatest change from baseline (P < 0.01) compared to L1 steers. Concentrations were similar at 6 h (P ≥ 0.08) but differed again at 8 h (P < 0.01), where L0 steers showed the greatest change in MIG concentrations, L1 steers showed the least change, and L2 steers were intermediate (P < 0.01). There was a treatment × time interaction for MIP-1β concentrations (Fig. 10; P < 0.01). Concentrations of MIP-1β were similar for all treatment groups at −2 and 0 h. However, at 2 h, all treatment groups displayed sharp increases (P < 0.01) in concentrations, where L0 was the greatest (P < 0.01), and L1 and L2 were similar. Concentrations began decreasing after 2 h, but at 4 h, L0 still presented the greatest concentration (P < 0.01) compared to L1 and L2. By 6 and 8 h, all treatment groups were similar to original concentrations (P = 0.09).
Figure 7.
The effect of supplementing receiving steers with methionine at 0 (L0), 2.2 (L1), or 4.4 (L2) g/steer/d for 40 d on the change in serum interleukin-21 (IL-21) response to an LPS (0.25 µg/kg body weight) challenge. For the change in IL-21 concentrations, there was a treatment × time interaction (P = 0.01). a,bTreatments with different superscripts within time points differ P < 0.05.
Figure 8.
The effect of supplementing receiving steers with methionine at 0 (L0), 2.2 (L1), or 4.4 (L2) g/steer/d for 40 d on the serum interferon-γ-inducible protein-10 (IP-10; CXCL10) response to an LPS (0.25 µg/kg body weight) challenge. There was a treatment × time interaction (P < 0.01) for IP-10 concentrations. a,bTreatments with different superscripts within time points differ P < 0.05.
Figure 9.
The effect of supplementing receiving steers with methionine at 0 (L0), 2.2 (L1), or 4.4 (L2) g/steer/d for 40 d on the change in serum Monokine induced by Interferon-γ (MIG; CSCL9) response to an LPS (0.25 µg/kg body weight) challenge. For the change in MIG concentrations, there was a treatment × time interaction (P < 0.01). a,bTreatments with different superscripts within time points differ P < 0.05.
Figure 10.
The effect of supplementing receiving steers with methionine at 0 (L0), 2.2 (L1), or 4.4 (L2) g/steer/d for 40 d on the serum Macrophage Inflammatory Protein-1 (MIP-1; CCL4) response to an LPS (0.25 µg/kg body weight) challenge. There was a treatment × time interaction (P < 0.01) for MIP-1 concentrations. a,bTreatments with different superscripts within time points differ P < 0.05.
There was no effect of treatment or treatment × time interaction (P ≥ 0.13) for serum haptoglobin or serum amyloid-A concentrations. Haptoglobin concentrations increased beginning at 12 h post-challenge and remained elevated above baseline values through 48 h post-challenge (time P < 0.01). Serum Amyloid-A concentrations increased at 8 h following LPS administration and remained elevated above baseline values through the 48-h sample (time P < 0.01).
Serum Chemistry
A total of 14 chemistry variables were analyzed in serum throughout the challenge (Table 8). There was no treatment nor treatment × time interaction for alanine aminotransferase, amylase, blood urea nitrogen, phosphorus, creatinine, or glucose (P ≥ 0.12). The change in concentration relative to baseline values was used for all serum chemistry variables with significant interactions, apart from potassium, due to treatment differences in baseline values.
Table 8.
Summary of serum chemistry variables measured following LPS administration (0.25 µg/kg body weight) in cattle supplemented with methionine at 0 (L0), 2.2 (L1), or 4.4 (L2) g/steer/d for 40 d
| Treatment | P-value | ||||||
|---|---|---|---|---|---|---|---|
| Variable, unit | L0 | L1 | L2 | SEM | Treatment | Time | Interaction |
| Albumin, g/dL | 2.29b | 2.47a | 2.46a | 0.05 | 0.04 | <0.01 | <0.01 |
| Alkaline phosphatase, U/L | 179.38 | 165.65 | 153.48 | 9.10 | 0.14 | <0.01 | <0.01 |
| Alanine Aminotransferase, U/L | 22.37 | 21.29 | 21.94 | 1.22 | 0.81 | <0.01 | 0.28 |
| Amylase, U/L | 49.78 | 56.75 | 55.26 | 6.72 | 0.74 | <0.01 | 0.60 |
| Total Bilirubin, mg/dL | 0.29 | 0.30 | 0.29 | 0.00 | 0.43 | <0.01 | 0.01 |
| Blood urea nitrogen, mg/dL | 10.05 | 9.92 | 9.85 | 0.52 | 0.96 | <0.01 | 0.15 |
| Calcium, mg/dL | 9.76b | 10.15a | 10.16a | 0.10 | 0.01 | <0.01 | 0.09 |
| Phosphorus, mg/dL | 6.64 | 6.92 | 6.94 | 0.17 | 0.37 | <0.01 | 0.12 |
| Creatinine, mg/dL | 0.93 | 0.90 | 0.91 | 0.03 | 0.86 | <0.01 | 0.13 |
| Glucose, mg/dL | 88.14 | 92.05 | 90.88 | 1.29 | 0.10 | <0.01 | 0.20 |
| Sodium, mmol/L | 139.91 | 140.79 | 141.06 | 0.45 | 0.18 | <0.01 | <0.01 |
| Potassium, mmol/L | 4.39 | 4.41 | 4.44 | 0.05 | 0.78 | <0.01 | 0.01 |
| Total protein, g/dL | 7.27 | 7.27 | 7.41 | 0.10 | 0.50 | <0.01 | <0.01 |
| Globulin, g/dL | 4.98 | 4.78 | 4.95 | 0.11 | 0.36 | <0.01 | 0.02 |
a,bMeans within rows lacking common superscripts differ P ≤ 0.05
The change in albumin concentrations relative to baseline (data not shown) resulted in a tendency (P = 0.07) for an interaction between treatment and time. Change in albumin was greatest for L0 steers (P = 0.04) compared with L1 and L2 steers. Control steers also had a greater fluctuation in albumin concentration changes (P ≤ 0.04), whereas concentration changes in L1 and L2 steers were below baseline values throughout the challenge.
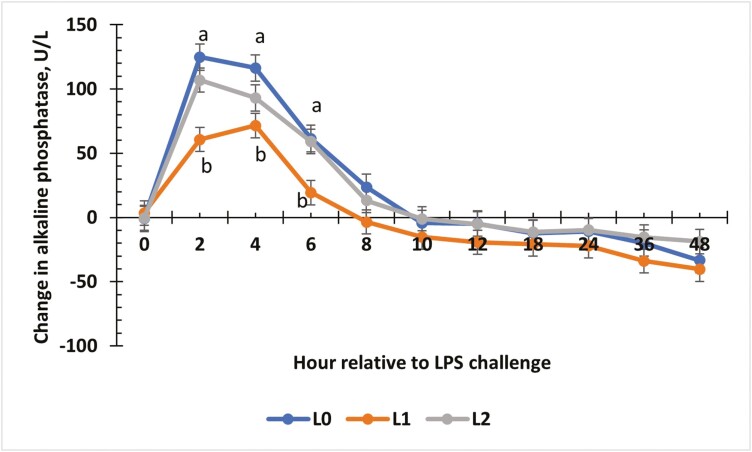
Change from baseline values for alkaline phosphatase (ALP; Fig. 11) indicated an interaction between treatment and time (P < 0.01). From 2 to 6 h, L0 and L2 steers expressed the greatest change from baseline values, while L1 resulted in the least (P < 0.01). From 8 to 48 h, changes from baseline values were similar in all treatment groups (P = 0.05), and values after 10 h were below baseline concentrations for all treatments.
Figure 11.
The effect of supplementing receiving steers with methionine at 0 (L0), 2.2 (L1), or 4.4 (L2) g/steer/d for 40 d on the change in plasma alkaline phosphatase (ALP) response to an LPS (0.25 µg/kg body weight) challenge. For the change in ALP concentrations, there was a treatment × time interaction (P < 0.01). a,bTreatments with different superscripts within time points differ P < 0.05.
A treatment × time interaction (P < 0.01) occurred for sodium concentrations. Initial concentrations differed at −2 h (P ≤ 0.02), where L2 steers showed the greatest concentration, L0 with the least, and L1 were intermediate. This trend continued to 0 h, where L0 differed from treated steers (P ≤ 0.04). Following an increase in concentration at 0 h, concentrations decreased from 0 to 4 h, but remained similar in all treatment groups until 24 h (P ≥ 0.06). At 24 h, L0 steers, again had the least concentration of sodium (P = 0.02), while L1 and L2 groups were greater and similar to each other (P = 0.05).
A treatment × time interaction occurred for TP (P < 0.01). At −2 h, L2 steers had the greatest concentration of TP compared to L0 steers (P < 0.01) which had the least concentration, and L1 which were intermediate (P = 0.04). While TP concentrations were similar across all treatment groups from 0 to 48 h (P = 0.07), concentrations increased for L0 and L1 steers at 0 h, while decreasing in L2 steers. At 2 h, TP concentrations for all treatment groups decreased but were all still similar in values (P = 0.07).
Discussion
Lipopolysaccharide is a component of the cell wall in gram-negative bacteria (Bertani and Ruiz, 2018). The ability of LPS to produce a consistent and highly reproducible acute inflammatory response has led to it being widely used as a challenge model component in animal research without the risks associated with live pathogens. In any immune challenge or illness response, the primary acute reaction is a rise in body temperature, contributing to fever. The RT observed in the current study were similar to results observed in previous LPS challenge models in beef steers (Burdick Sanchez et al., 2013, 2020; Smock et al., 2023). Within this study, steers supplemented with the L2 diet produced a greater peak temperature response compared to L0 and L1 treatment groups. This may be interpreted in a variety of ways; however, one plausible explanation is a greater and faster response to the challenge due to priming of the immune system. This priming may have allowed the steers to resolve the inflammatory event more rapidly and efficiently than the L1 and untreated groups. Methionine has been recognized as a valuable amino acid in immune health, having a direct benefit on the growth and development of primary immune organs (thymus gland and bursa of Fabricius; Ruan et al., 2017). Within all mammals, cells involved in adaptive immunity, namely B and T cells, are developed within these organs. Given the steers within this study were supplemented for 40 d prior to the challenge, steers supplemented with the greater dose of methionine may have been better equipped to mitigate the effects of an endotoxin challenge, including an increased and accelerated fever response. While an increased inflammatory response, contributing to fever, may also explain the differences in peak temperatures, some data presented may be suggestive of a negative feedback loop, as anti-inflammatory cytokines, IFN-α and IL-13, were greatest in supplemented steers. Additional reviews have recognized T-cells offer effective control of the immune response by essentially terminating inflammatory processes (Vigano et al., 2012; Rahman et al., 2018). Nonetheless, previous studies have recognized that rumen-protected methionine improves immune responses in steers by increasing phagocytic activity and increasing pro-inflammatory cytokines (Osorio et al., 2013). This improved response may warrant a timely recovery, as reflected in IFN-α, IL-13, and peak temperature response from supplemented steers.
Animal behavior may often be influenced by illness and may even be a symptom itself (Dantzer, 2004). While there was no effect of treatment on water intake volume, steers receiving methionine supplementation did frequent water bowls more often. This behavior exhibited by methionine-supplemented steers may correspond to the added stress of increased body temperature resulting from a fever response. Polsky and von Keyserlingk (2017) indicate that water is the most important resource for a heat-stressed cow, stating that water intake tends to increase by 1.2 kg/°C above minimum ambient body temperatures. While steers in this study were not heat-stressed externally, a febrile response may provoke animals to search for ways to lower body temperatures internally. In the current study, supplemented steers returned to the water bowls more often and exhibited higher peak body temperatures, suggesting a correlation between the behavioral and physiological responses elicited. Furthermore, SBS within this study increased in all steers immediately following the administration of LPS. Steers that were not supplemented with methionine exhibited greater SBS compared to supplemented steers, suggesting a benefit of supplemented methionine in the diets of receiving beef steers. Sickness behavior may be mediated by pro-inflammatory cytokines, including TNF-α and IL-6 (Dantzer et al., 2006), although the latter was not measured in this study. Nonetheless, concentrations of TNF-α measured at 2 h post-challenge were reduced in L1 steers compared to L0 steers. However, overall SBS was relatively low in the current study, and the differences observed may be of little biological significance.
Evaluation of hematological variables may be indicative of infection or inflammation. In the current study, no changes in red blood cells, hematocrit, or platelets were observed. However, hemoglobin was reduced in methionine-supplemented steers compared to the control group. A study in rats found administration of methionine in excess (2% of body weight), resulted in reduced hemoglobin concentrations (Klavins et al., 1963). The study further suggested that excess intake of methionine may induce tissue damage, including erythrocyte membrane damage, making this the likely culprit of reduced hemoglobin concentrations. While the current study did not supplement methionine in excess, it does support Klavins et al. (1963) theory, suggesting the role of methionine in reducing hemoglobin.
Prior to the initiation of the LPS challenge at h 0,WBC concentrations were greater in L0 steers compared to L1 steers. Reduced concentrations in the L1 treatment group may be suggestive of a priming event in the immune system and possible reduced basal inflammation within this treatment group. Nonetheless, measures accounted for in blood collection are measuring circulating concentrations. Innate immune cells, specifically leukocytes, are free-flowing in the vasculature, enabling a rapid response when needed (Spiering, 2015). Neutrophils, specifically, will exit blood circulation and move quickly to affected areas upon injury or infection. While a decreased concentration of circulating WBC in supplemented steers may appear as indicative of an active response, studies evaluating methionine supplementation in broiler chickens recognized increased leukocyte migration with increased supplementation (Swain and Johri, 2000). Further still, control steers exhibited the largest change in WBC concentrations post-challenge compared to baseline values. This may further correspond with methionine’s ability to aid in leukocyte migration, increase antibody titers, and prime the immune system by increasing the production of B and T cells, as well as other immune cells (Swain and Johri, 2000; Ruan et al., 2017).
Cortisol is an anti-inflammatory variable acting as a first responder in an immune challenge. Increases in cortisol, following the activation of the hypothalamic–pituitary–adrenal (HPA) axis, are necessary in the short term for stimulation of inflammatory mediators. This release of cortisol, and subsequent reduction in the inflammatory response, is partially responsible for resolution of infection via stimulation of leukocyte distribution to promote the resolution of the inflammatory response (Carroll and Forsberg, 2007; Straub and Cutolo, 2016). An acute release of cortisol, as in the current study and similar, further allows for the release of energy-rich fuels needed by the body and active immune cells to begin fighting infection (Straub and Cutolo, 2016). Cortisol release, via activation of the HPA-axis, may also be stimulated by pro-inflammatory cytokines. Interleukin-1 has been recognized as a potent stimulator of the HPA-axis (Dunn, 2007). While IL-1 concentrations tended to be greater in the supplemented groups, the opposite was true of cortisol, where L0 steers showed greater concentrations. The tendency for reduced cortisol concentrations in methionine treatment groups (L1 and L2) may be suggestive of reduced inflammation, which further agrees with other hematology data presented.
Cytokines are released by leukocytes as well as epithelial cells in response to an infection or inflammation. Cytokines have many functions in the immune response, including stimulation of fever and sickness behavior, recruitment of other immune cells, and release of inflammatory mediators including additional cytokines, chemokines, and acute phase proteins (Blecha, 1991; Kany et al., 2019). Changes in cytokine concentrations may be reflective of changes in inflammation following an immune challenge or stressful event. Tumor necrosis factor-α is one of the primary pro-inflammatory cytokines of the immune system, exhibiting major roles in the stimulation of other cytokines, fever, and sickness behavior, as well as the recruitment of other immune cells (Velova and Hosek, 2013). Decreased concentrations of TNF-α in supplemented steers following the LPS challenge may further support a reduced inflammatory response with methionine supplementation and may be partially responsible for the milder SBS observed. The pro-inflammatory cytokine IL-1α can be activated in response to LPS. It is typically found intercellularly, and is released following cell death, resulting in increased inflammation (Voronov et al., 2013). Both IL-1 α and TNF- α act as innate immune response activators, prompting the recruitment and activation of circulating phagocytes (Ott et al., 2010). Together, the two cytokines further contribute to the activation of the adaptive immune response, especially in the case of LPS stimulation of TNF- α (Ott et al., 2010). While concentrations of IL-1α increased in all treatment groups, concentrations remained elevated in the L0 group for a longer period compared to L1 and L2 groups. While these differences were small, they may be suggestive of a more robust adaptive immune response in methionine-supplemented steers, requiring less from circulating concentrations of IL-1 α and corresponding cytokines. Interleukin-1 F5 is believed to be an IL-1 receptor antagonist, thus limiting the inflammatory actions of IL-1 family members (i.e., IL-1α and IL-1β, amongst others), resulting in an anti-inflammatory response (Barksby et al., 2007). While there was no significant treatment × time interaction for IL-1 F5, the temporal pattern and resulting concentrations are supportive of what may be perceived as reduced inflammation in methionine-supplemented steers. Interestingly, a contradicting response was observed in supplemented steers (both L1 and L2) and IL-21 concentrations. Interleukin-21 has numerous functions, including increasing natural killer cell cytotoxicity and regulation of B cells, thus facilitating the adaptive immune response and antibody production (Leonard and Spolski, 2005); although sometimes considered immunosuppressive in the literature (Leonard and Wan, 2016). Supplemented steers exhibited greater concentrations of IL-21 throughout the study, suggesting an effect of methionine on the production of IL-21 as an indirect result of methionine’s relationship with the adaptive immune response and B and T cell function (Ruan et al., 2017).
Several chemokines or immune-related chemoattractant molecules were also evaluated in the cytokine array panel, including IP-10, MIG, and MIP-1β. These molecules serve to attract and stimulate various immune cells, such as natural killer cells, monocytes/macrophages, and T lymphocytes (Kopydlowski et al., 1999). The general reduction in concentration of all 3 of the chemokines may be indicative of reduced inflammation and less need to recruit immune cells to the site of infection. The cytokine data from this study agrees with Vailati-Riboni et al. (2017), suggesting cytokines are produced at lower concentrations when methionine (Smartamine M; Adisseo) was supplemented in dairy cows during an ex vivo LPS challenge. Furthermore, in vitro macrophages cultured with methionine and LPS exhibited a reduced inflammatory response (i.e., reduced production of TNF-α, IL-6, and IFN-β) when compared to cultures without methionine (Ji et al., 2019). While differences in cytokines were observed, there was no effect of methionine supplementation level on serum concentrations of haptoglobin or serum amyloid-A. It is likely that peak concentrations of these acute phase proteins were not yet realized by the conclusion of the study at 48 h post-challenge. However, previous studies have demonstrated methionine supplementation can reduce haptoglobin concentrations (Zhou et al., 2016; Batistel et al., 2018).
The comprehensive chemistry profile measured various compounds available within plasma. There was no effect of methionine supplementation on alanine aminotransferase or amylase; however, ALP was reduced in L1 steers compared to the L0 treatment group. The release of ALP is stimulated by tissue damage, and the resulting increase of the enzyme itself is an effort to reduce inflammation. Alkaline phosphatase has previously been demonstrated to be protective against tissue damage in mice challenged with LPS (Beumer et al., 2003). Perhaps decreased concentrations of the enzyme in L1 steers are the result of reduced inflammation and a decreased need to detoxify the body of LPS, or further prevent tissue damage associated with the LPS challenge. A study evaluating liver function and ALP concentrations in mice fed methionine-choline-deficient diets recognized that ALP concentrations were increased in deficient mice (Gamez-Belmonte et al., 2021). Proper function of ALP is further impacted by the presence of zinc and magnesium (Lowe et al., 2022), and while this study did not evaluate zinc and magnesium, their absorption is promoted by the presence of specific amino acids, including methionine (Lonnerdal, 2000). Therefore, given the increase in methionine in the diets of supplemented steers, there may be an indirect effect of methionine on zinc and magnesium concentrations resulting in reduced ALP concentrations. No differences were observed in phosphorus, creatine, or glucose concentrations.
Albumin and globulin serve similar roles as the 2 most common proteins found in plasma. Albumin, however, is commonly referred to as a negative acute phase protein, such that it decreases in response to an immune challenge. Within this study, concentrations of albumin and globulin were reduced in response to the LPS challenge, specifically in supplemented steers. Reductions in these two proteins may have further contributed to reduced TP concentrations observed in these animals (relative to baseline values). A study evaluating rumen-protected methionine in dairy cows prior to parturition observed increased plasma concentrations of albumin, while bilirubin and alkaline phosphate concentrations decreased (Batistel et al., 2018). This supports the current study, where baseline concentrations were greater for albumin in methionine-supplemented steers. Elevated concentrations of albumin were also observed in methionine-supplemented cows (Zhou et al., 2016).
Conclusion
The variables described provide a comprehensive summary of chemical and immunological parameters in response to an acute LPS challenge. Although individual parameter differences may not provide clear biological significance, the combination of parameters suggests reduced inflammation in response to LPS challenge in receiving beef steers supplemented with methionine. These data provide valuable insight regarding the inflammatory response in beef steers supplemented with methionine, while further research is needed to fully understand the mechanisms behind the effects of methionine on the immune response, as well as its impact during the feeding period prior to immune challenges. Nonetheless, supplementation with rumen-protected methionine during the feedlot receiving period may improve the health and wellness of beef steers during a critical period in their growth and management.
Acknowledgments
This study was funded by Adisseo USA Inc., Mention of trade names or commercial products in this article is solely for the purpose of providing specific information and does not imply recommendation or endorsement by the USDA. USDA is an equal opportunity provider and employer. The authors would like to thank J. W. Dailey and J. R. Carroll (USDA-ARS) for the excellent technical support.
Contributor Information
Samantha N Barker, Department of Animal and Food Sciences, Texas Tech University, Lubbock, TX 79413, USA.
Treylr C Jackson, Department of Agricultural Sciences, West Texas A&M University, Canyon, TX 79016, USA.
Nicole C Burdick Sanchez, USDA-ARS, Livestock Issues Research Unit, Lubbock, TX 79403, USA.
Jeffery A Carroll, USDA-ARS, Livestock Issues Research Unit, Lubbock, TX 79403, USA.
Paul R Broadway, USDA-ARS, Livestock Issues Research Unit, Lubbock, TX 79403, USA.
Kristin E Hales, Department of Animal and Food Sciences, Texas Tech University, Lubbock, TX 79413, USA.
Gary Ducharme, PROJ-X, Inc., Cumming, GA 30040, USA.
Jerrad F Legako, Department of Animal and Food Sciences, Texas Tech University, Lubbock, TX 79413, USA.
John T Richeson, Department of Agricultural Sciences, West Texas A&M University, Canyon, TX 79016, USA.
Author contributions
Samantha Barker (Formal analysis, Investigation, Methodology, Writing—original draft), Treylr Jackson (Formal analysis, Investigation, Methodology), Nicole Burdick Sanchez (Conceptualization, Formal analysis, Investigation, Methodology, Supervision, Writing—review & editing), Jeffrey Carroll (Conceptualization, Funding acquisition, Investigation, Methodology, Project administration, Writing—review & editing), Paul Rand Broadway (Conceptualization, Investigation, Methodology, Writing—review & editing), Kristin Hales (Investigation, Writing—review & editing), Gary Ducharme (Conceptualization, Funding acquisition, Investigation, Methodology, Writing—review & editing), Jerrad Legako (Investigation, Methodology, Supervision, Writing—review & editing), and John Richeson (Conceptualization, Formal analysis, Funding acquisition, Investigation, Methodology, Project administration, Supervision, Writing—review & editing)
Literature Cited
- Barksby, H. E., Lea S. R., Preshaw P. M., and Taylor J. J... 2007. The expanding family of interleukin-1 cytokines and their role in destructive inflammatory disorders. Clin. Exp. Immunol. 149:217–225. doi: 10.1111/j.1365-2249.2007.03441.x [DOI] [PMC free article] [PubMed] [Google Scholar]
- Batistel, F., Arroyo J. M., Garces C. I. M., Trevisi E., Parys C., Ballou M. A., Cardoso F. C., and Loor J. J... 2018. Ethyl-cellulose rumen-protected methionine alleviates inflammation and oxidative stress and improves neutrophil function during the periparturient period and early lactation in Holstein dairy cows. J. Dairy Sci. 101:480–490. doi: 10.3168/jds.2017-13185 [DOI] [PubMed] [Google Scholar]
- Bertani, B., and Ruiz N... 2018. Function and biogenesis of lipopolysaccharides. EcoSal. Plus. 8:33. doi: 10.1128/ecosalplus.ESP-0001-2018 [DOI] [PMC free article] [PubMed] [Google Scholar]
- Beumer, C., Wulferink M., Raaben W., Fiechter D., Brands R., and Seinen W... 2003. Calf intestinal alkaline phosphatase, a novel therapeutic drug for lipopolysaccharide (LPS)-mediated diseases, attenuates LPS toxicity in mice and piglets. J. Pharmacol. Exp. Ther. 307:737–744. doi: 10.1124/jpet.103.056606 [DOI] [PubMed] [Google Scholar]
- Blakebrough-Hall, C., McMeniman J. P., and Gonzalez L. A... 2020. An evaluation of the economic effects of bovine respiratory disease on animal performance, carcass traits, and economic outcomes in feedlot cattle defined using four BRD diagnosis methods. J. Anim. Sci. 98:1–11. doi: 10.1093/jas/skaa005 [DOI] [PMC free article] [PubMed] [Google Scholar]
- Blecha, F. 1991. Cytokines: applications in domestic food animals. J. Dairy Sci. 74:328–339. doi: 10.3168/jds.S0022-0302(91)78176-9 [DOI] [PubMed] [Google Scholar]
- Burdick Sanchez, N., Young T., Carroll J., Corley J., Rathmann R., and Johnson B... 2013. Yeast cell wall supplementation alters aspects of the physiological and acute phase responses of crossbred heifers to an endotoxin challenge. Innate. Immun. 19:411–419. doi: 10.1177/1753425912469673 [DOI] [PubMed] [Google Scholar]
- Burdick Sanchez, N. C., Carroll J. A., Broadway P. R., Edrington T. S., Yoon I., and Belknap C. R... 2020. Some aspects of the acute phase immune response to a lipopolysaccharide (LPS) challenge are mitigated by supplementation with a Saccharomyces cerevisiae fermentation product in weaned beef calves. Transl. Anim. Sci. 4:txaa156. doi: 10.1093/tas/txaa156 [DOI] [PMC free article] [PubMed] [Google Scholar]
- Carroll, J. A., Burdick Sanchez N. C., Arthington J. D., Nelson C. D., Benjamin A. L., Korkmaz F. T., Kerr D. E., and Lancaster P. A... 2017. In utero exposure to LPS alters the postnatal acute-phase response in beef heifers. Innate. Immun. 23:97–108. doi: 10.1177/1753425916678472 [DOI] [PubMed] [Google Scholar]
- Carroll, J. A., Burdick Sanchez N. C., Hulbert L. E., Ballou M. A., Dailey J. W., Caldwell L. C., Vann R. C., T. H.Welsh, Jr., and Randel R. D... 2015. Sexually dimorphic innate immune responses of pre-pubertal Brahman cattle following intravenous lipopolysaccharide challenge. Vet. Imunol. Immunopathol. 166:108–115. doi: 10.1016/j.vetimm.2015.06.009 [DOI] [PubMed] [Google Scholar]
- Carroll, J. A., and Forsberg N. E... 2007. Influence of stress and nutrition on cattle immunity. Vet. Clin. Food Anim. 23:105–149. doi: 10.1016/j.cvfa.2007.01.003 [DOI] [PubMed] [Google Scholar]
- Dantzer, R. 2004. Cytokine-induced sickness behaviour: a neuroimmune response to activation of innate immunity. Eur. J. Pharmacol. 500:399–411. doi: 10.1016/j.ejphar.2004.07.040 [DOI] [PubMed] [Google Scholar]
- Dantzer, R., Bluthe R. M., Laye S., Bret-Dibat J. L., Parnet P., and Kelley K. W... 2006. Cytokines and sickness behavior. Animals. 840:586–590. doi: 10.1111/j.1749-6632.1998.tb09597.x [DOI] [PubMed] [Google Scholar]
- Duff, G. C., and Galyean M. L... 2007. Board-invited review: recent advances in management of highly stressed, newly received feedlot cattle. J. Anim. Sci. 85:823–840. doi: 10.2527/jas.2006-501 [DOI] [PMC free article] [PubMed] [Google Scholar]
- Dunn, A. J. 2007. The HPA Axis and the immune system: a perspective. Neuroimmun. Biol. 7:3–15. doi: 10.1016/S1567-7443(07)00201-3 [DOI] [Google Scholar]
- Gamez-Belomonte, R., Tena-Garitaonaindia M., Hernandez-Chirlaque C., Cordova S., Caecero-Heras D., Sanchez de Medina F., and Maritnez-Augustin O... 2021. Deficiency in tissue non-specific alkaline phosphatase leads to steatohepatitis in mice fed a high fat diet similar to that produced by a methionine and choline deficient diet. Int. J. Mol. Sci. 22:51. doi: 10.3390/ijms22010051 [DOI] [PMC free article] [PubMed] [Google Scholar]
- Ji, J., Xu Y., Zheng M., Luo C., Lei H., Qu H., and Shu D... 2019. Methionine attenuates lipopolysaccharide-induced inflammatory responses via DNA methylation in macrophages. ACS Omega. 4:2331–2336. doi: 10.1021/acsomega.8b03571 [DOI] [PMC free article] [PubMed] [Google Scholar]
- Kany, S., Vollrath J. T., and Relja B... 2019. Cytokines in inflammatory disease. Int. J. Mol. Sci. 20:6008. doi: 10.3390/ijms20236008 [DOI] [PMC free article] [PubMed] [Google Scholar]
- Klavins, J. V., Kinney T. D., and Kaufman N... 1963. Body iron levels and hematological findings during excess methionine feeding. J. Nutr. 79:101–104. doi: 10.1093/jn/79.1.101 [DOI] [PubMed] [Google Scholar]
- Kopydlowski, K. M., Salkowski C. A., Cody M. J., van Rooijen N., Major J., Hamilton T. A., and Vogel S. N... 1999. Regulation of macrophage chemokine expression by lipopolysaccharide in vitro and in vivo. J. Immunol. 163:1537–1544. [PubMed] [Google Scholar]
- Leonard, W. J., and Spolski R... 2005. Interleukin-21: a modulator of lymphoid proliferation, apoptosis and differentiation. Nat. Rev. Immunol. 5:688–698. doi: 10.1038/nri1688 [DOI] [PubMed] [Google Scholar]
- Leonard, W. J., and Wan C... 2016. IL-21 Signaling in Immunity. F1000 Res. 5:224. doi: 10.12688/f1000research.7634.1 [DOI] [PMC free article] [PubMed] [Google Scholar]
- Loerch, S. C., and Fluharty F. L... 1999. Pysiological changes and digestive capabilities of newly received feedlot cattle. J. Anim. Sci. 77:1113–1119. doi: 10.2527/1999.7751113x [DOI] [PubMed] [Google Scholar]
- Lonnerdal, B. 2000. Dietary factors influencing zinc absorption. J. Nutr. 130(5S Suppl):1378S–1383S. doi: 10.1093/jn/130.5.1378S [DOI] [PubMed] [Google Scholar]
- Lowe, D., Sanvictores T., Zubair M., and John S... 2022. Alkaline phosphatase. 2022. In: Treasure Island, (FL): StatPearls. [PubMed] [Google Scholar]
- Molano, R. A., Saito A., Luchini D. N., and Van Amburgh M. E... 2020. Effects of rumen-protected methionine or methionine analogs in starter on plasma metabolites, growth, and efficiency of Holstein calves from 14 to 91 d of age. J. Dairy Sci. 103:10136–10151. doi: 10.3168/jds.2020-18630 [DOI] [PubMed] [Google Scholar]
- Osorio, J. S., Ji P., Drackley J. K., Luchini D., and Loor J. J... 2013. Supplemental Smartamine M or MetaSmart during the transition period benefits postpartal cow performance and blood neutrophil function. J. Dairy Sci. 96:6248–6263. doi: 10.3168/jds.2012-5790 [DOI] [PubMed] [Google Scholar]
- Ott, L. W., Resing K. A., Sizemore A. W., Heyen J. W., Cocklin R. R., Pedrick N. M., Woods H. C., Chen J. Y., Goebl M. G., Witzmann F. A.,. et al. 2010. Tumor necrosis factor-α and Interleukin-1-induced cellular responses: coupling proteomic and genomic information. J. Proteome Res. 6:2176–2185. doi: 10.1021/pr0606651 [DOI] [PMC free article] [PubMed] [Google Scholar]
- Pillen, J. L., Pinedo P. J., Ives S. E., Covey T. L., Naikare H. K., and Richeson J. T... 2016. Alteration of activity variable relative to clinical diagnosis of bovine respiratory disease in newly received feedlot cattle. Bov. Pract. 50:1–8. doi: 10.21423/bovine-vol50no1p1-8 [DOI] [Google Scholar]
- Polsky, L., and von Keyserlingk M. A. G... 2017. Invited review: effects of heat stress on dairy cattle welfare. J. Dairy Sci. 100:8645–8657. doi: 10.3168/jds.2017-12651 [DOI] [PubMed] [Google Scholar]
- Rahman, A., Tiwari A., Narula J., and Hickling T... 2018. Importance of feedback and feedforward loops to adaptive immune response modeling. CPT Pharmacometrics Syst. Pharmacol. 7:621–628. doi: 10.1002/psp4.12352 [DOI] [PMC free article] [PubMed] [Google Scholar]
- Reuter, R., Carroll J., Dailey J., C.Chase, Jr, Coleman S., Riley D., Spiers D., Weaber R., and Galyean M... 2010. Development of an automatic, indwelling rectal temperature probe for cattle research. J. Anim. Sci. 88:3291–3295. doi: 10.2527/jas.2010-3093 [DOI] [PubMed] [Google Scholar]
- Rice, J. A., Carrasco-Medina L., Hodgins D. C., and Shewen P. E... 2007. Mannheimia heamolytica and bovine respiratory disease. Anim. Health Res. Rev. 8:117–128. doi: 10.1017/s1466252307001375 [DOI] [PubMed] [Google Scholar]
- Ruan, T., Li L., Peng X., and Wu B... 2017. Effects of methionine on the immune function in animals. Helath. 9:857–869. doi: 10.4236/health.2017.95061 [DOI] [Google Scholar]
- Silva, G. M., Chalk C. D., Ranches J., Schulmeister T. M., Henry D. D., DiLorenzo N., Arthington J. D., Moriel P., and Lancaster P. A... 2021. Effect of rumen-protected methionine supplementation to beef cows during the periconception period on performance of cows, calves, and subsequent offspring. Animal. 15:100055. doi: 10.1016/j.animal.2020.100055 [DOI] [PubMed] [Google Scholar]
- Smock, T. M., Broadway P. R., Burdick Sanchez N. C., Carroll J. A., Theurer M. E., and Hales K. E... 2023. An updated profile of the bovine acute phase response following an intravenous lipopolysaccharide challenge. J. Anim. Sci. 101:1–16. doi: 10.1093/jas/skad133 [DOI] [PMC free article] [PubMed] [Google Scholar]
- Spiering, M. J. 2015. Primer on the immune system. Alcohol. Res. 37:171–175. [PMC free article] [PubMed] [Google Scholar]
- Straub, R. H., and Cutolo M... 2016. Glucocorticoids and chronic inflammation. Rheumatology. 55:ii6–ii14. doi: 10.1093/rheumatology/kew348 [DOI] [PubMed] [Google Scholar]
- Swain, B. K., and Johri T. S... 2000. Effect of supplemental methionine, choline and their combinations on the performance and immune response of broilers. Brit. Poult. Sci. 41:83–88. doi: 10.1080/00071660086457 [DOI] [PubMed] [Google Scholar]
- Taylor, J. D., Fulton R. W., Lehenbauer T. W., Step D. L., and Confer A. W... 2010. The epidemiology of bovine respiratory disease: what is the evidence for predisposing factors? Can. Vet. J. 51:1095–1102. [PMC free article] [PubMed] [Google Scholar]
- Vailati-Riboni, M., Zhou Z., Jacometo C. B., Minuti A., Trevisi E., Luchini D. N., and Loor J. J... 2017. Supplementation with rumen-protected methionine or choline during the transition period influences whole-blood immune response in periparturient dairy cows. J. Dairy Sci. 100:3958–3968. doi: 10.3168/jds.2016-11812 [DOI] [PubMed] [Google Scholar]
- Velová, H., and Hošek J... 2013. TNF-α signalling and inflammation: interactions between old acquaintances. Inflamm. Res. 62:641–651. doi: 10.1007/s00011-013-0633-0 [DOI] [PubMed] [Google Scholar]
- Vigano, S., Perreau M., Pantaleo G., and Harari A... 2012. Positive and negative regulation of cellular immune responses in physiologic conditions and diseases. Clin. Dev. Immunol. 2012:485781. doi: 10.1155/2012/485781 [DOI] [PMC free article] [PubMed] [Google Scholar]
- Voronov, E., Dotan S., Krelin Y., Song X., Elkabets M., Carmi Y., Rider P., Idan C., Romzova M., Kaplanov I.,. et al. 2013. Unique versus redundant functions of IL-1alpha and IL-1beta in the tumor microenvironment. Front. Immunol. 4:177. doi: 10.3389/fimmu.2013.00177 [DOI] [PMC free article] [PubMed] [Google Scholar]
- Waterman, R. C., Ujazdowski V. L., and Petersen M. K... 2012. Effects of rumen-protected methionine on plasma amino acid concentrations during a period of weight loss for late gestating beef heifers. Amino Acids. 43:2165–2177. doi: 10.1007/s00726-012-1301-3 [DOI] [PubMed] [Google Scholar]
- Zhou, Z., Bulgari O., Vailati-Riboni M., Trevisi E., Ballou M. A., Cardoso F. C., Luchini D. N., and Loor J. J... 2016. Rumen-protected methionine compared with rumen-protected choline improves immunometabolic status in dairy cows during the peripartal period. J. Dairy Sci. 99:8956–8969. doi: 10.3168/jds.2016-10986 [DOI] [PubMed] [Google Scholar]


