

Abstract
Aim
Leisure‐time physical activity (LTPA) promotes healthy aging; however, data on work‐related physical activity (WPA) are inconsistent. This study was conducted to examine the disability‐free life expectancy (DFLE) and disabled life expectancy (DLE) across physical activity levels, with a focus on WPA, in middle‐aged and older adults.
Methods
Data from 5663 community‐dwelling participants aged ≥55 years and enrolled in the Healthy Aging Longitudinal Study in Taiwan were evaluated. Energy expenditures from LTPA and WPA were calculated from baseline questionnaires and categorized into sex‐specific cutoffs. Disability was based on repeat measures of participants' activities of daily living and instrumental activities of daily living. Mortality was confirmed via data linkage with the Death Certificate database. DFLE and DLE were estimated from discrete‐time multistate life‐table models.
Results
At age 65, women with low WPA had a DLE of 2.88 years (95% confidence interval [CI], 1.67–4.08), which was shorter than that of women without WPA (DLE, 5.24 years; 95% CI, 4.65–5.83) and with high WPA (DLE, 4.01 years; 95% CI, 2.69–5.34). DFLE and DLE were similar across WPA levels in men. DFLE tended to increase as the LTPA increased in men and women.
Conclusion
Women with low WPA had shorter DLE than did those with no or high WPA. To reduce the risks of disability associated with physical activity, public policy should advocate for older people to watch the type, amount, and intensity of their activities as these may go ignored during WPA. Geriatr Gerontol Int 2024; 24: 229–239.
Keywords: disability, life expectancy, physical activity at work
We used data from the Healthy Aging Longitudinal Study in Taiwan to evaluate the association between type of activities (leisure‐time and work‐related) and disability‐free and disabled life years. Our study suggested that work‐related physical activity was U‐shaped associated with disabled life years in women. The results implied that older people should watch the type, amount, and intensity of their activities as these may go ignored during work.

Introduction
In Taiwan, life expectancy at birth increased from 62 years in 1960 to 78 years in 2020 for men and from 66 years in 1960 to 85 years in 2020 for women. 1 However, living longer does not mean living healthily. Thus, disability‐free life expectancy (DFLE) and disabled life expectancy (DLE) were proposed as summary measures of a population's health, considering the quality and quantity of lived years. 2
Physical activity can benefit the health of older populations by reducing total mortality, cardiovascular morbidity and mortality, diabetes incidence, and the risk of some cancers (e.g., breast and colorectal) 3 , 4 ; however, most previous studies focused only on leisure‐time physical activity (LTPA). Studies have indicated that occupational physical activity may be associated with a higher risk of cardiovascular disease and mortality; this phenomenon has been termed the physical activity paradox. 5 , 6 , 7 , 8 , 9 , 10 , 11 Occupational physical activity is characterized by static and isometric activities, for example, standing and lifting for a long period of time, and without sufficient recovery time. 12 , 13 Hours of higher levels of occupational physical activity can lead to prolonged increases in heart rate and blood pressure, thus triggering adverse intravascular turbulence and increasing the risk for cardiovascular diseases and mortality. Additionally, the working environment might be out of the workers' control and thus may increase stress and inflammation levels 9 , 14 as well as injuries. Nevertheless, the physical activity paradox seems to be more apparent in men and those with poor cardiorespiratory fitness. 15
Previous studies have suggested that physical activity contributes to a longer life expectancy, either independently or jointly with other healthy lifestyles. 16 , 17 , 18 , 19 However, few studies have investigated the impact of occupational physical activity on DFLE and DLE. Researchers in Finland examined the association between physical activity (including leisure‐time and commuting activities) and healthy and chronic disease‐free life expectancy by occupational status. 17 They found that the gain in healthy and chronic disease‐free years with higher physical activity was larger among persons with lower than with higher occupational status. 17 However, occupational status does not necessarily correspond to work‐related physical activity (WPA). Although seniors may have retired from their jobs, they may still engage in WPAs, such as farming, gardening, or babysitting, or mix WPA and LTPA. Health effects from these types of WPAs in older populations should be evaluated.
This study was conducted to examine the effect of WPA on DFLE and DLE by examining the association between LTPA and WPA, individually and combined, and DFLE and DLE by sex. As socioeconomic status and underlying morbidities often confound the association between work and health, 15 the secondary aim of the study was to present the DFLE and DLE by WPA in subgroups with different educational attainment and selected morbidities.
Methods
The Healthy Aging Longitudinal Study in Taiwan
Data were derived from the Healthy Aging Longitudinal Study in Taiwan (HALST), a prospective study established in 2008, in which 5663 community‐dwelling older adults were recruited across Taiwan. The second wave of data collection began in 2013 and ended in 2020, with a response rate of 73.6%. The cohort has been described previously. 20 Briefly, a random sample of eligible residents (≥55 years old) living within the catchment area of seven collaborative hospitals were recruited. Participants with any of the following conditions were excluded: highly contagious infectious diseases, diagnosed dementia, severe illness (based on the interviewers' judgment of whether the participant was too ill to complete the interview), being bedridden, severe mental disorders, mutism, hearing impairment, blindness, living in a long‐term care facility, or being hospitalized. Detailed illustration of participant selection is presented in Figure S1. All participants signed written informed consent. The Institutional Review Board at the National Health Research Institutes and the collaborative hospitals approved the study. All methods were performed in accordance with the relevant guidelines and regulations.
Measurement of physical activity
We adapted the physical activity questionnaire used in the National Health Interview Survey in Taiwan. 21 Information on LTPA and WPA were collected for all HALST participants. Each participant was asked whether they had engaged in LTPA or WPA during the past year. If yes, the participant was then asked to select up to five activities from a list of 32 LTPAs and 16 WPAs (Table S1). Frequency, duration, and associated breathing and sweating effects were recorded for each of the five activities selected. For each physical activity, a metabolic equivalent (MET) value was assigned according to the level of perceived breathing effects following the recommendations of Wai et al. 22 and Ainsworth et al. 23 Energy expenditure from physical activity, summarizing duration, frequency, and intensity for an individual on a weekly basis (kcal/week) was calculated as:
where weight was measured during the physical examination by the trained interviewers.
The LTPA was then categorized according to sex‐specific tertile. Approximately 75% of our cohort had participated in no WPA during the previous year; thus, WPA was categorized as none, low, or high, according to the sex‐specific median. Energy expenditure from leisure‐time and work‐related physical activities were summed to obtain the total physical activity and categorized according to sex‐specific tertile.
Outcome measures
Disability
In both waves of data collection, participants were asked whether they had difficulty performing activities of daily living (ADL) 24 and instrumental activities of daily living (IADL). 25 ADL assesses functional status, which includes eating, getting in/out of bed, personal hygiene, grooming, using the toilet, bathing/showering, walking across a room, ascending/descending stairs, dressing, controlling bowel movements, and controlling urination. ADL scores range from 0 to 100, with 100 representing full independence in doing daily activities. 24 The IADL measures independent living skills, including shopping, housekeeping, handling finances, food preparation, transportation, telephone use, laundry, and responsibility for taking medication. 25 In Taiwanese culture, men are not required to do housekeeping, food preparation, or laundry; thus, these three items were not scored for men. Thus, IADL scores ranged from 0 (worst) to 8 (best) for women and 0–5 for men. Disabled persons were defined as those whose scores were <100 on the ADL or <8 for women and <5 for men on the IADL.
Mortality
Participants' vital statuses and cause and date of death were confirmed via data linkage with the Taiwan National Death Certificate database updated on October 31, 2021.
Measurements of other variables
Other covariates considered in this study were study centers, education levels (low literacy/did not attend primary school, attended or completed primary school, or more than primary school), smoking status, alcohol consumption status (never, former, or current), body mass index, social network score, Center for Epidemiologic Studies Depression Scale scores (<16 or ), total energy intake (kcal), and selected health conditions. 7 , 8 , 9 , 10 , 15 , 26 , 27 , 28 , 29 , 30 , 31 , 32
Most of these variables and health conditions were self‐reported, except height, weight (for calculation of body mass index), and waist circumference, which were measured during the physical examination by the trained interviewers. The social network score was calculated on the basis of six questions about the participant's interactions with immediate family members, relatives, friends, and neighbors, and about participation in community activities. Each question was scored from 0 to 2, with a higher score indicating higher frequency of interaction or participation. A social network score is the summary score of the six questions (range, 0–12). The metabolic syndrome was defined as having any three of the following conditions 33 : (i) abdominal obesity, that is, waist circumference ≥90 cm in men or ≥ 80 cm in women; (ii) elevated triglycerides, that is, fasting serum triglycerides ≥150 mg/dL or self‐reported treatments for dyslipidemia; (iii) reduced high‐density lipoprotein cholesterol, that is, <40 mg/dL in men and < 50 mg/dL in women or self‐reported treatments for dyslipidemia; (iv) elevated blood pressure (BP), that is, systolic BP ≥130 mm Hg or diastolic BP ≥85 mm Hg or self‐reported treatments for hypertension; and (v) abnormal glucose metabolism, that is, fasting glucose ≥100 mg/dL or self‐reported treatment for diabetes. Household income was also available in the HALST. However, almost half of the participants (45.8%) reported unknown or refused to answer the question. Hence, household income was not included in the statistical models but only for subgroup analyses. Interpretation of the results by household income should be cautious.
Statistical analysis
Only data on completed physical activities, disability, and covariates were considered in the analysis. A flowchart of data included in the current analyses is illustrated in Figure S2. Participants' characteristics were expressed as counts (%) and compared using chi‐square tests for categorical variables or described as means ± standard deviations and compared using the Kruskal–Wallis test for continuous variables.
We applied the Stochastic Population Analysis for Complex Events program, 34 a multistate life table (MSLT) method to compute disability‐free years from the time of no disability to disability and death. Three health states were defined: disability‐free, disability, and death. Four possible transitions were allowed between the states: disability‐free to disability, disability to disability‐free, disability‐free to death, and disability to death. An age‐specific transition probability was estimated from the HALST study for all possible transitions using multinomial logistic regression with sex, physical activities, and all other covariates in the model. LTPA and WPA were mutually adjusted in all models. Total life expectancy (TLE), DFLE, and DLE were then calculated on the basis of these estimated transition probabilities using a stochastic (microsimulation) approach. A simulated cohort of 100 000 individuals was generated according to the distribution of covariates at baseline based on observed prevalence in the HALST study by age group, sex, and physical activity level. TLE, DFLE, and DLE were then summarized from these simulated results for men and women and for physical activity level. Standard errors and their corresponding 95% confidence intervals (CIs) were calculated using a bootstrap method with 100 repeats for the entire analysis process (multinomial analysis and stimulation steps). Significant differences between physical activity levels were tested using a two‐sample Z‐test.
All analyses were performed using SAS 9.4 (SAS Institute, Cary, NC, USA).
Results
We used data from 5430 participants at baseline and 4045 participants at follow‐up. Table 1 presents the baseline characteristics by WPA level for both sexes. Both men and women with higher WPA levels were younger and tended to have lower education and LTPA levels. Disability prevalence was approximately 12% in men and 19% in women; the prevalence was lower in those with higher WPA levels. Baseline characteristics for participants by follow‐up status are presented in Table S2.
Table 1.
Baseline characteristics of participants by work‐related physical activity
| Men | Women | |||||||||||||
|---|---|---|---|---|---|---|---|---|---|---|---|---|---|---|
| No (n = 1925) | Low (n = 328) | High (n = 330) | p | No (n = 2133) | Low (n = 357) | High (n = 357) | P value | |||||||
| N | % | N | % | N | % | N | % | N | % | N | % | |||
| Age (years, mean ± SD) | 70.61 | 8.61 | 68.10 | 7.47 | 67.37 | 7.58 | <0.01 | 69.67 | 8.05 | 67.43 | 6.79 | 67.57 | 7.83 | <0.01 |
| BMI (kg/m2, mean ± SD) | 24.49 | 3.33 | 24.39 | 3.24 | 24.69 | 3.23 | 0.31 | 24.62 | 3.67 | 24.16 | 3.41 | 24.68 | 3.85 | 0.08 |
| Energy intake (kcal, mean ± SD) | 2256.25 | 781.96 | 2363.64 | 777.76 | 2361.08 | 795.47 | 0.01 | 1787.92 | 631.63 | 1808.12 | 606.12 | 1863.36 | 651.48 | 0.16 |
| Education levels | ||||||||||||||
| Low literacy | 55 | 2.9 | 8 | 2.4 | 13 | 3.9 | <0.01 | 317 | 14.9 | 62 | 17.4 | 93 | 26.1 | <0.01 |
| Primary school | 707 | 36.7 | 128 | 39.0 | 188 | 57.0 | 1031 | 48.3 | 168 | 47.1 | 195 | 54.6 | ||
| More than primary school | 1163 | 60.4 | 192 | 58.5 | 129 | 39.1 | 785 | 36.8 | 127 | 35.6 | 69 | 19.3 | ||
| Household income | ||||||||||||||
| <30 K NTD | 606 | 31.5 | 103 | 31.4 | 128 | 38.8 | 0.01 | 628 | 29.4 | 127 | 35.6 | 138 | 38.7 | <0.01 |
| 30 K–< 70 K NTD | 290 | 15.1 | 56 | 17.1 | 44 | 13.3 | 227 | 10.6 | 38 | 10.6 | 41 | 11.5 | ||
| ≥70 K NTD | 238 | 12.4 | 54 | 16.5 | 30 | 9.1 | 157 | 7.4 | 29 | 8.1 | 9 | 2.5 | ||
| Unknown or refused to answer | 791 | 41.1 | 115 | 35.1 | 128 | 38.8 | 1121 | 52.6 | 163 | 45.7 | 169 | 47.3 | ||
| Smoking | ||||||||||||||
| Never | 820 | 42.6 | 151 | 46.0 | 131 | 39.7 | 0.11 | 2079 | 97.5 | 351 | 98.3 | 355 | 99.4 | 0.13 |
| Former | 637 | 33.1 | 104 | 31.7 | 99 | 30.0 | 15 | 0.7 | 3 | 0.8 | 1 | 0.3 | ||
| Current | 468 | 24.3 | 73 | 22.3 | 100 | 30.3 | 39 | 1.8 | 3 | 0.8 | 1 | 0.3 | ||
| Drinking | ||||||||||||||
| Never | 758 | 39.4 | 106 | 32.3 | 134 | 40.6 | <0.01 | 1728 | 81.0 | 265 | 74.2 | 292 | 81.8 | 0.01 |
| Former | 393 | 20.4 | 50 | 15.2 | 37 | 11.2 | 71 | 3.3 | 12 | 3.4 | 6 | 1.7 | ||
| Current | 774 | 40.2 | 172 | 52.4 | 159 | 48.2 | 334 | 15.7 | 80 | 22.4 | 59 | 16.5 | ||
| Physical activity at leisure time | ||||||||||||||
| Low | 531 | 27.6 | 116 | 35.4 | 198 | 60.0 | <0.01 | 620 | 29.1 | 113 | 31.7 | 191 | 53.5 | <0.01 |
| Mediate | 710 | 36.9 | 94 | 28.7 | 72 | 21.8 | 750 | 35.2 | 119 | 33.3 | 91 | 25.5 | ||
| High | 684 | 35.5 | 118 | 36.0 | 60 | 18.2 | 763 | 35.8 | 125 | 35.0 | 75 | 21.0 | ||
| Social networking | ||||||||||||||
| ≥8 | 844 | 43.8 | 203 | 61.9 | 194 | 58.8 | <0.01 | 994 | 46.6 | 196 | 54.9 | 205 | 57.4 | <0.01 |
| 6–7 | 559 | 29.0 | 72 | 22.0 | 81 | 24.5 | 605 | 28.4 | 103 | 28.9 | 89 | 24.9 | ||
| 0–5 | 522 | 27.1 | 53 | 16.2 | 55 | 16.7 | 534 | 25.0 | 58 | 16.2 | 63 | 17.6 | ||
| CESD | ||||||||||||||
| <16 | 1840 | 95.6 | 324 | 98.8 | 320 | 97.0 | 0.01 | 1961 | 91.9 | 343 | 96.1 | 337 | 94.4 | 0.01 |
| ≥16 | 85 | 4.4 | 4 | 1.2 | 10 | 3.0 | 172 | 8.1 | 14 | 3.9 | 20 | 5.6 | ||
| Prevalence of chronic conditions | ||||||||||||||
| Disability | 262 | 13.6 | 20 | 6.1 | 21 | 6.4 | <0.01 | 452 | 21.2 | 48 | 13.4 | 54 | 15.1 | <0.01 |
| Hypertensive medication | 839 | 43.6 | 110 | 33.5 | 113 | 34.2 | <0.01 | 921 | 43.2 | 142 | 39.8 | 122 | 34.2 | <0.01 |
| Dyslipidemia medication | 276 | 14.3 | 24 | 7.3 | 24 | 7.3 | <0.01 | 385 | 18.0 | 51 | 14.3 | 36 | 10.1 | <0.01 |
| Diabetic medication | 374 | 19.4 | 36 | 11.0 | 43 | 13.0 | <0.01 | 374 | 17.5 | 41 | 11.5 | 39 | 10.9 | <0.01 |
| Metabolic syndrome | 862 | 45.7 | 114 | 35.0 | 114 | 35.0 | <0.01 | 1170 | 55.9 | 174 | 48.9 | 181 | 51.1 | 0.02 |
| Stroke | 155 | 8.1 | 10 | 3.1 | 12 | 3.6 | <0.01 | 98 | 4.6 | 6 | 1.7 | 5 | 1.4 | <0.01 |
| Cancer | 113 | 5.9 | 8 | 2.4 | 9 | 2.7 | <0.01 | 159 | 7.5 | 18 | 5.0 | 11 | 3.1 | <0.01 |
| Gout | 344 | 17.9 | 45 | 13.7 | 40 | 12.1 | 0.01 | 141 | 6.6 | 20 | 5.6 | 11 | 3.1 | 0.03 |
| Hip fracture | 37 | 1.9 | 2 | 0.6 | 3 | 0.9 | 0.12 | 40 | 1.9 | 3 | 0.8 | 5 | 1.4 | 0.34 |
| Other musculoskeletal diseases | 625 | 32.5 | 93 | 28.4 | 89 | 27.0 | 0.07 | 1142 | 53.5 | 163 | 45.7 | 184 | 51.5 | 0.02 |
Abbreviations: CESD, Center for Epidemiologic Studies Depression Scale; SD, standard deviation.
By the end of the follow‐up, 1305 participants had died (799 men and 506 women). Table 2 shows the TLE, DFLE, and DLE for both men and women at the ages of 55, 65, and 75 years, by physical activity level. Overall, WPA was nonlinearly associated with DLE, particularly in women. At age 65, women with low WPA had a DLE of 2.88 years (95% CI, 1.67–4.08), which was shorter than that of women without WPA (DLE, 5.24 years; 95% CI, 4.65–5.83) and with high WPA (DLE, 4.01 years; 95% CI, 2.69–5.34).
Table 2.
Total, disability‐free, and disabled life expectancies
| Total life expectancy | Disability‐free life expectancy | Disabled life expectancy | Net gain or loss | ||||||||||
|---|---|---|---|---|---|---|---|---|---|---|---|---|---|
| Total life expectancy | Disability‐free life expectancy | Disabled life expectancy | |||||||||||
| Age | Years | 95% CI | Years | 95% CI | Years | 95% CI | Years | 95% CI | Years | 95% CI | Years | 95% CI | |
| Men | |||||||||||||
| Physical activity at leisure time | |||||||||||||
| At 55 | Low | 24.39 | (23.36 to 25.42) | 22.24 | (21.05 to 23.44) | 2.15 | (1.41 to 2.89) | Ref | Ref | Ref | |||
| Moderate | 24.94 | (23.74 to 26.14) | 22.25 | (20.95 to 23.55) | 2.69 | (1.90 to 3.47) | 0.55 | (−1.04 to 2.13) | 0.01 | (−1.76 to 1.78) | 0.54 | (−0.54 to 1.62) | |
| High | 26.81 | (25.65 to 27.96) | 24.58 | (23.42 to 25.73) | 2.23 | (1.53 to 2.93) | 2.41 | (0.86 to 3.96) | 2.33 | (0.67 to 3.99) | 0.08 | (−0.94 to 1.10) | |
| At 65 | Low | 16.20 | (15.43 to 16.96) | 14.02 | (13.10 to 14.94) | 2.18 | (1.59 to 2.77) | Ref | Ref | Ref | |||
| Moderate | 16.63 | (15.67 to 17.59) | 14.14 | (13.18 to 15.10) | 2.49 | (1.88 to 3.09) | 0.43 | (−0.79 to 1.66) | 0.12 | (−1.21 to 1.45) | 0.31 | (−0.53 to 1.15) | |
| High | 18.17 | (17.18 to 19.16) | 16.08 | (15.15 to 17.01) | 2.09 | (1.50 to 2.68) | 1.97 | (0.72 to 3.22) | 2.06 | (0.75 to 3.37) | −0.09 | (−0.92 to 0.75) | |
| At 75 | Low | 9.43 | (8.89 to 9.98) | 7.20 | (6.57 to 7.83) | 2.23 | (1.81 to 2.65) | Ref | Ref | Ref | |||
| Moderate | 9.77 | (9.07 to 10.47) | 7.51 | (6.86 to 8.15) | 2.27 | (1.81 to 2.72) | 0.34 | (−0.55 to 1.23) | 0.31 | (−0.60 to 1.21) | 0.03 | (−0.58 to 0.65) | |
| High | 10.92 | (10.12 to 11.71) | 8.98 | (8.26 to 9.69) | 1.94 | (1.47 to 2.41) | 1.48 | (0.52 to 2.45) | 1.77 | (0.82 to 2.73) | −0.29 | (−0.92 to 0.34) | |
| Physical activity at work | |||||||||||||
| At 55 | No | 25.07 | (24.25 to 25.89) | 22.73 | (21.78 to 23.68) | 2.34 | (1.80 to 2.88) | Ref | Ref | Ref | |||
| Low | 26.34 | (24.56 to 28.11) | 24.10 | (22.32 to 25.88) | 2.24 | (1.09 to 3.39) | 1.26 | (−0.69 to 3.22) | 1.36 | (−0.65 to 3.38) | −0.10 | (−1.37 to 1.17) | |
| High | 25.32 | (23.68 to 26.96) | 22.76 | (20.93 to 24.59) | 2.56 | (1.42 to 3.70) | 0.25 | (−1.59 to 2.08) | 0.03 | (−2.03 to 2.09) | 0.22 | (−1.05 to 1.48) | |
| At 65 | No | 16.75 | (16.14 to 17.35) | 14.51 | (13.88 to 15.15) | 2.23 | (1.82 to 2.64) | Ref | Ref | Ref | |||
| Low | 17.81 | (16.29 to 19.34) | 15.73 | (14.26 to 17.20) | 2.08 | (1.11 to 3.06) | 1.07 | (−0.57 to 2.71) | 1.22 | (−0.38 to 2.82) | −0.15 | (−1.21 to 0.91) | |
| High | 16.92 | (15.49 to 18.34) | 14.63 | (13.20 to 16.06) | 2.28 | (1.34 to 3.23) | 0.17 | (−1.38 to 1.72) | 0.12 | (−1.45 to 1.68) | 0.05 | (−0.98 to 1.08) | |
| At 75 | No | 9.81 | (9.40 to 10.23) | 7.64 | (7.21 to 8.06) | 2.18 | (1.86 to 2.49) | Ref | Ref | Ref | |||
| Low | 10.77 | (9.56 to 11.98) | 8.70 | (7.60 to 9.80) | 2.08 | (1.28 to 2.87) | 0.96 | (−0.32 to 2.24) | 1.06 | (−0.12 to 2.24) | −0.10 | (−0.96 to 0.76) | |
| High | 9.98 | (8.82 to 11.14) | 7.94 | (6.95 to 8.93) | 2.04 | (1.27 to 2.80) | 0.17 | (−1.06 to 1.40) | 0.31 | (−0.77 to 1.38) | −0.14 | (−0.96 to 0.68) | |
| Women | |||||||||||||
| Physical activity at leisure time | |||||||||||||
| At 55 | Low | 29.54 | (28.50 to 30.57) | 23.09 | (21.61 to 24.58) | 6.45 | (5.31 to 7.58) | Ref | Ref | Ref | |||
| Moderate | 29.75 | (28.71 to 30.80) | 25.77 | (24.64 to 26.91) | 3.98 | (2.92 to 5.04) | 0.22 | (−1.26 to 1.69) | 2.68 | (0.81 to 4.55) | −2.47 | (−4.02 to −0.92) | |
| High | 30.08 | (28.90 to 31.25) | 25.09 | (23.91 to 26.28) | 4.98 | (3.87 to 6.09) | 0.54 | (−1.03 to 2.11) | 2.00 | (0.10 to 3.90) | −1.47 | (−3.06 to 0.12) | |
| At 65 | Low | 20.05 | (19.13 to 20.97) | 14.16 | (13.05 to 15.27) | 5.89 | (5.05 to 6.73) | Ref | Ref | Ref | |||
| Moderate | 20.16 | (19.21 to 21.12) | 16.30 | (15.38 to 17.21) | 3.87 | (3.03 to 4.70) | 0.11 | (−1.21 to 1.44) | 2.14 | (0.70 to 3.58) | −2.02 to | (−3.21 to −0.84) | |
| High | 20.52 | (19.38 to 21.66) | 15.98 | (14.98 to 16.98) | 4.54 | (3.62 to 5.46) | 0.47 | (−1.00 to 1.94) | 1.82 | (0.32 to 3.32) | −1.35 | (−2.60 to −0.10) | |
| At 75 | Low | 11.63 | (10.91 to 12.36) | 6.97 | (6.24 to 7.69) | 4.67 | (4.05 to 5.29) | Ref | Ref | Ref | |||
| Moderate | 11.68 | (10.87 to 12.49) | 8.27 | (7.61 to 8.93) | 3.41 | (2.82 to 4.00) | 0.05 | (−1.04 to 1.14) | 1.30 | (0.33 to 2.28) | −1.26 | (−2.11 to −0.40) | |
| High | 12.02 | (11.00 to 13.03) | 8.24 | (7.46 to 9.03) | 3.78 | (3.02 to 4.53) | 0.38 | (−0.87 to 1.63) | 1.27 | (0.21 to 2.34) | −0.89 | (−1.87 to 0.08) | |
| Physical activity at work | |||||||||||||
| At 55 | No | 29.92 | (29.10 to 30.73) | 24.21 | (23.15 to 25.26) | 5.71 | (4.91 to 6.51) | Ref | Ref | Ref | |||
| Low | 28.35 | (26.70 to 30.00) | 25.33 | (23.50 to 27.17) | 3.02 | (1.70 to 4.34) | −1.56 | (−3.40 to 0.28) | 1.13 | (−0.99 to 3.25) | −2.69 | (−4.23 to −1.15) | |
| High | 30.73 | (28.88 to 32.58) | 26.59 | (24.46 to 28.72) | 4.14 | (2.55 to 5.73) | 0.81 | (−1.21 to 2.83) | 2.39 | (0.01 to 4.76) | −1.57 | (−3.35 to 0.20) | |
| At 65 | No | 20.37 | (19.64 to 21.10) | 15.13 | (14.35 to 15.91) | 5.24 | (4.65 to 5.83) | Ref | Ref | Ref | |||
| Low | 18.94 | (17.42 to 20.47) | 16.07 | (14.39 to 17.75) | 2.88 | (1.67 to 4.08) | −1.43 | (−3.12 to 0.26) | 0.94 | (−0.91 to 2.79) | −2.37 | (−3.70 to −1.03) | |
| High | 21.22 | (19.48 to 22.96) | 17.20 | (15.38 to 19.02) | 4.01 | (2.69 to 5.34) | 0.85 | (−1.04 to 2.73) | 2.07 | (0.09 to 4.06) | −1.23 | (−2.68 to 0.22) | |
| At 75 | No | 11.87 | (11.28 to 12.47) | 7.57 | (7.04 to 8.10) | 4.30 | (3.82 to 4.79) | Ref | Ref | Ref | |||
| Low | 10.71 | (9.43 to 11.99) | 8.03 | (6.78 to 9.27) | 2.68 | (1.83 to 3.63) | −1.17 | (−2.58 to 0.24) | 0.46 | (−0.90 to 1.81) | −1.62 | (−2.69 to −0.56) | |
| High | 12.61 | (11.15 to 14.07) | 9.02 | (7.72 to 10.32) | 3.59 | (2.60 to 4.58) | 0.74 | (−0.84 to 2.31) | 1.45 | (0.05 to 2.85) | −0.71 | (−1.82 to 0.39) | |
Abbreviation: CI, confidence interval.
Figure 1 displays the combined effect of LTPA and WPA on DFLE and DLE at age 65. Overall, LTPA and WPA showed a U‐shaped association with DLE in women. Women with moderate LTPA and a lower WPA had the shortest DLE (2.23 years; 95% CI, 1.22–3.23).
Figure 1.
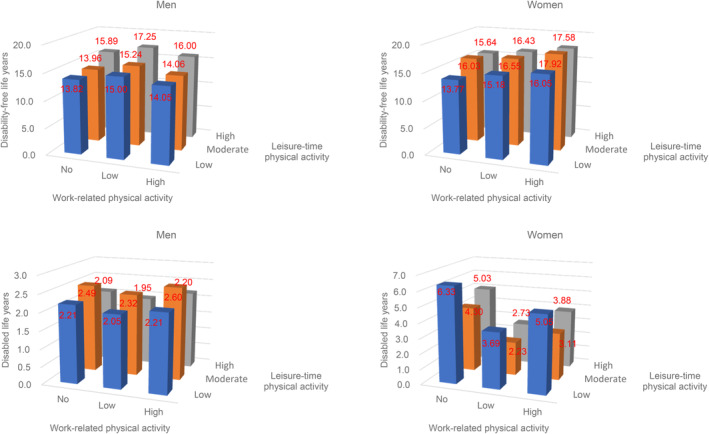
Disability‐free and disabled life expectancies at 65 years old by leisure‐time and work‐related physical activity levels in men and women.
We also conducted subgroup analyses by education level and baseline health conditions. The length of time living with a disability increased as the education level decreased in both men and women (Figure 2). However, WPA remained nonlinearly associated with DLE in women regardless of education level. In participants with previous health conditions, the U‐shaped association between WPA and DLE remained in women with hypertension, diabetes, and metabolic syndrome (Figure 3).
Figure 2.
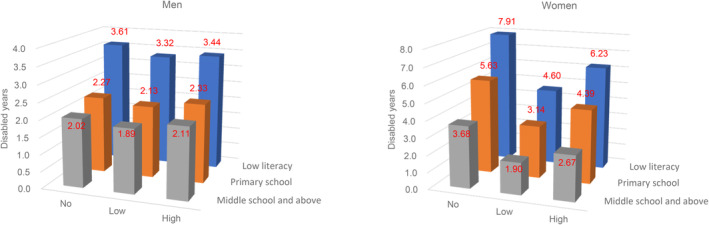
Disabled life expectancies at 65 years old by education and work‐related physical activity levels in men and women.
Figure 3.
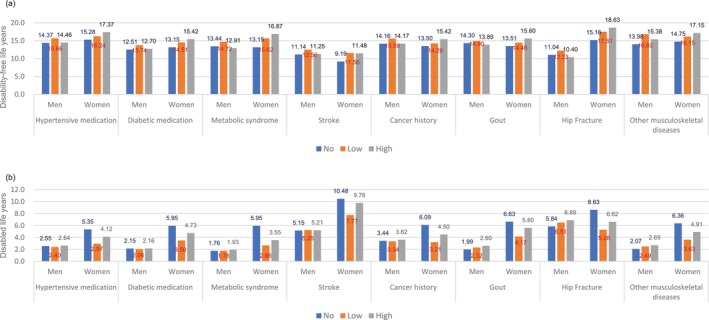
Disability‐free (a) and disabled (b) life expectancies at 65 years by work‐related physical activity level and baseline health conditions. Other musculoskeletal diseases included osteoporosis, arthritis, and spurs.
Discussion
In the current study, WPA and DLE were nonlinearly associated in women, and women with low WPA and moderate LTPA had the shortest DLE. In 2014, the midpoint of our study, the published life expectancies at age 65 were 18 years for men and 21 years for women. 1 The estimated TLE from the current longitudinal cohort study was 17 years for men and 20 years for women.
In addition to morbidity and mortality, physical activity has been associated with a healthy aging trajectory, 35 reduced cognitive decline, 36 and reduced frailty progression. 37 Again, these studies were based on LTPA. Few studies have investigated the impact of WPA on functional changes in older people. The Mayo Clinic Study of Aging suggested that moderate‐ or heavy‐intensity nonexercise physical activity was associated with less cognitive loss. 38 However, that study did not adjust for LTPA. 38 Conversely, the Copenhagen Male Study found that men with high WPA levels had a statistically significant increased risk of dementia compared to that of men with sedentary jobs. 39 Previous studies on LTPA indicated that physical activity may benefit certain cognitive domains, such as executive function and memory, but not attention or working memory. 40 Different types of WPA may also affect different domains of cognition. Overall, decreased cognition and advanced frailty may result in disability and poor quality of life. More studies on WPA and functions are needed.
While previous studies on WPA and all‐cause mortality or cardiovascular disease risk were more pronounced in men than in women, 15 , 41 we did not observe an association between WPA and DFLE and DLE in men. The explanations for sex differences in mortality included differences in physically demanding jobs performed by men and women, different exposures resulting from these different jobs, different perceived intensity of WPA by men and women, different gender responses to cardiovascular risk factors and WPA, and interactions between tasks undertaken at the workplace and at home. 42 , 43 , 44 , 45 , 46 In other words, if men with physically demanding jobs had a higher chance of premature death, we may have less probability to recruit such men to our study. Men involved in the current study may have more survival advantages than the general population. As shown in Table S4, data from the National Health Interview Survey, a representative sample of Taiwan's general population, showed that the energy expenditure from WPA was the highest in 35‐ to 54‐year‐old men and 55‐ to 74‐year‐old women. The energy expenditure from WPA reported in the current study might not reflect lifelong energy expenditures from WPA, particularly in men. This may explain why we observed no association between WPA and DFLE or DLE in men.
On the other hand, the energy expenditure from WPA reported in the current study might capture the lifetime peak in women (Table S4). Women without WPA may already present disability or chronic diseases (Table 1) that prevent them from working and result in longer DLE. Healthy women were able to participate in WPA; hence, related to decreased DLE. However, our results also indicated that DLE increased when WPA increased, although the increase was not statistically significant. Indeed, although WPA was not related to mortality in women, a systemic review suggested that men and women have different risks of work‐related injuries and disabilities. 47 Some studies found that women had a higher risk of musculoskeletal disorders and injuries than men in similar occupations. 48 , 49 , 50 The design of working environment that was usually for anthropometric average men 51 and the double burden from both work and family responsibility 52 may explain the gender differences in disability and chronic conditions. Furthermore, the nonassociation between occupation and mortality in women might be because the previous occupational health studies were usually underrepresented by women, particularly in occupations that were dominated by men. 47 As the DLE measurement combines disability and mortality, the nonlinear association between WPA and DLE in women may highlight the impact of work‐related disability in women.
For easier interpretation of the nonlinear association, we translated the energy expenditure into minutes per week for a 70‐kg man and a 60‐kg woman. The lower and higher LTPA cutoffs for men were 41 and 299 min/week, respectively, for moderate exercise (e.g., walking MET 3.5); or 24 and 174 min/week, respectively, for vigorous exercise (e.g., jogging MET 6.0). For women, those cutoffs were 37 and 240 min/week, respectively, for moderate exercise and 21 and 140 min/week, respectively, for vigorous exercise. The WPA cutoffs were 310 and 311 min/week for regular WPA (e.g., farming, heavy housekeeping work, or babysitting [MET 4.0]) for men and women, respectively. Energy expenditure in high levels of WPA were usually from farming and manual work in men and farming and housekeeping in women. The World Health Organization recommends that older adults perform an equivalent combination of moderate and vigorous activities ≥150 min, or even >300 min for additional health benefits. 53 Our findings were consistent with the World Health Organization's recommendation that higher LTPA levels were associated with longer DFLE. However, our results also indicated that higher WPA levels may provide no additional health benefit, particularly in women.
After combining LTPA and WPA as total physical activity, the nonlinear association between total physical activity and DLE remained in women, and the association between total physical activity and higher DFLE was not statistically significant (Table S3). Higher total physical activity was resulted from the higher proportion of WPA in both men and women (data not shown). As per Physical Activity Guidelines for Americans, 54 injuries and other adverse events, such as overheating, dehydration, musculoskeletal injuries, or stroke, may occur during activities and may increase the risk of disability, thus increasing the DLE.
In addition, those who worked for longer hours might be those who need more income. Previous systemic reviews on employment in later life suggested that working helps to promote and maintain health in older adults. 55 , 56 However, motivation, financial status, and physical health were important effect modifiers. 55 , 57 , 58 , 59 Research from the Longitudinal Aging Study Amsterdam suggested different life expectancy by different occupation and occupational exposures. 60 , 61 These studies revealed a need to provide specific support regarding the working environment, and the pension policy should be tailored according to individuals' risk of longevity. However, the WPA in our study does not correspond to occupation or occupational exposure in the previous studies. Nevertheless, our subgroup analyses showed that the U‐shaped association between WPA and DLE remained across women with different household income (Figure S3).
A previous study from the Taiwan Longitudinal Study on Aging suggested that higher education, exercise, employment, and social participation were associated with lower risks of early onset of disability. 62 Studies from Europe and South America suggest that education affects choices in occupation and health behaviors, including physical activity. 63 , 64 The results from the Health and Retirement Study further demonstrated that higher education was associated with compression of mortality and disability. 65 A multicohort study in Australia found that education modified the effect of lifestyle on DFLE. 66 The current study showed a graded relationship between education and DLE (Figure 2). Both men and women with high WPA had lower education levels (Table 1). Again, the nonlinear relationship between WPA and DLE remained in women regardless of education level.
In addition to the potential selection bias mentioned above, one limitation of this study was that the results were based on microsimulation and transition probability rather than direct observation of life expectancy and transitions for each participant. Second, the physical activities were self‐reported, which may suffer from misclassification. However, self‐reported physical activity data are commonly used to study physical activity levels in large populations, 67 and moderate correlations have been found between self‐reported and objectively measured physical activities. 68 In addition, the MET assigned to each activity had been modified to reflect cultural differences according to locally collected data. 22 , 69 The cutoffs were determined by sex‐specific median or tertile (a relative measure) to reduce the impacts from absolute values. Third, physical activity was assessed at baseline and did not consider changes over the follow‐up period. A previous study suggested that consistently high physical activity levels over time were associated with lower risks of disability, worsening disability, hospitalization, and mortality, whereas low and decreased physical activity levels were associated with higher risks of adverse outcomes. 70 Fourth, disability was assessed at baseline and reassessed 5–6 years later. The transition to disability may not reflect exactly when the event happened. Finally, we used ADL and IADL to define disability. Other studies have used only ADL, 71 IADL disability, 62 self‐rated health, 17 , 18 self‐reported medical conditions, 16 , 18 or medical conditions with disability weights to summarize DFLE and DLE. Although DFLE and DLE were meant to compare health statuses between populations, direct comparisons are difficult to make across studies that used different definitions. Nevertheless, our results were consistent with those studies that showed that LTPA was associated with longer DFLE regardless of definition. Our study further demonstrated a nonlinear association between WPA and DLE in women.
A major strength of this study was that it was based on a relatively large prospective cohort study with repeated measurements of ADL and IADL. Furthermore, use of the Stochastic Population Analysis for Complex Events program enabled adjusting for confounders in the model, which is a limitation in studies using traditional MSLT. Compared to the Sullivan method, which reflects the current health compositions adjusted for current mortality and morbidity, MSLT‐based methods provide an expected health structure according to current mortality and morbidity conditions. 72
In summary, we found that LTPA was associated with health in older adults; while high levels of WPA did not provide additional benefits, particularly in women. Our data also suggest that high levels of WPA resulted from long hours of farming, including growing rice, fruits, and vegetables. This result suggest that prolonged duration of work might not be beneficial for health in middle‐aged or older adults. Public policy should advocate that older people watch the type, amount, and intensity of activities they perform, 54 as these often may go ignored during WPA. However, the current study is inadequate to recommend employment policy at an older age because WPA in the current study does not correspond to employment. Another study on employment and/or occupation with full consideration of social support, education, and/or socioeconomic status is needed for policies on working beyond retirement age.
Disclosure statement
The authors declare no conflict of interest.
Funding information
This work was supported by the National Health Research Institutes in Taiwan (grant numbers PH‐111‐SP‐01, PH‐111‐PP‐19).
Supporting information
FIGURE S1. Flow chart of the recruitment.
FIGURE S2. Sample included in the analyses.
FIGURE S3. Disabled life expectancies at 65 years old by household income and work‐related physical activity levels in men and women.
TABLE S1. Metabolic equivalent (MET) by levels of breathing efforts.
TABLE S2. Baseline characteristics for participants by follow‐up status at wave 2.
TABLE S3. Total, disability‐free, and disabled life expectancies by total physical activity (leisure‐time and work‐related combined).
TABLE S4. Energy expenditure (kcal/week) from work‐related physical activity in the National Health Interview Survey in Taiwan, 2009.
Chuang S‐C, Chang Y‐H, Wu I, et al. Impact of physical activity on disability‐free and disabled life expectancies in middle‐aged and older adults: Data from the healthy aging longitudinal study in Taiwan. Geriatr. Gerontol. Int. 2024;24:229–239. 10.1111/ggi.14796
Data availability statement
The data that support the findings of this study are available on request from the corresponding author upon reasonable request. The data are not publicly available due to privacy or ethical restrictions.
References
- 1. National Development Council . Population projections for the Republic of China (Taiwan), https://www.ndc.gov.tw/en/default.aspx#Group_3576 (accessed: September 2023).
- 2. Wood R, Sutton M, Clark D, McKeon A, Bain M. Measuring inequalities in health: the case for healthy life expectancy. J Epidemiol Community Health 2006; 60: 1089–1092. 10.1136/jech.2005.044941. [DOI] [PMC free article] [PubMed] [Google Scholar]
- 3. Samitz G, Egger M, Zwahlen M. Domains of physical activity and all‐cause mortality: systematic review and dose‐response meta‐analysis of cohort studies. Int J Epidemiol 2011; 40: 1382–1400. 10.1093/ije/dyr112. [DOI] [PubMed] [Google Scholar]
- 4. Vogel T, Brechat PH, Lepretre PM et al. Health benefits of physical activity in older patients: a review. Int J Clin Pract 2009; 63: 303–320. 10.1111/j.1742-1241.2008.01957.x. [DOI] [PubMed] [Google Scholar]
- 5. Cillekens B, Huysmans MA, Holtermann A et al. Physical activity at work may not be health enhancing. A systematic review with meta‐analysis on the association between occupational physical activity and cardiovascular disease mortality covering 23 studies with 655 892 participants. Scand J Work Environ Health 2022; 48: 86–98. 10.5271/sjweh.3993. [DOI] [PMC free article] [PubMed] [Google Scholar]
- 6. Dalene KE, Tarp J, Selmer RM et al. Occupational physical activity and longevity in working men and women in Norway: a prospective cohort study. Lancet Public Health 2021; 6: e386–e395. 10.1016/S2468-2667(21)00032-3. [DOI] [PubMed] [Google Scholar]
- 7. Hermansen R, Jacobsen BK, Lochen ML et al. Leisure time and occupational physical activity, resting heart rate and mortality in the Arctic region of Norway: the Finnmark study. Eur J Prev Cardiol 2019; 26: 1636–1644. 10.1177/2047487319848205. [DOI] [PubMed] [Google Scholar]
- 8. Holtermann A, Hansen JV, Burr H, Søgaard K, Sjøgaard G. The health paradox of occupational and leisure‐time physical activity. Br J Sports Med 2012; 46: 291–295. 10.1136/bjsm.2010.079582. [DOI] [PubMed] [Google Scholar]
- 9. Holtermann A, Krause N, van der Beek AJ, Straker L. The physical activity paradox: six reasons why occupational physical activity (OPA) does not confer the cardiovascular health benefits that leisure time physical activity does. Br J Sports Med 2018; 52: 149–150. 10.1136/bjsports-2017-097965. [DOI] [PubMed] [Google Scholar]
- 10. Holtermann A, Schnohr P, Nordestgaard BG, Marott JL. The physical activity paradox in cardiovascular disease and all‐cause mortality: the contemporary Copenhagen general population study with 104 046 adults. Eur Heart J 2021; 42: 1499–1511. 10.1093/eurheartj/ehab087. [DOI] [PMC free article] [PubMed] [Google Scholar]
- 11. Temporelli PL. Is physical activity always good for you? The physical activity paradox. Eur Heart J Suppl 2021; 23: E168–E171. 10.1093/eurheartj/suab115. [DOI] [PMC free article] [PubMed] [Google Scholar]
- 12. Hu G, Sarti C, Jousilahti P, Silventoinen K, Barengo N¨C, Tuomilehto J. Leisure time, occupational, and commuting physical activity and the risk of stroke. Stroke 2005; 36: 1994–1999. 10.1161/01.STR.0000177868.89946.0c. [DOI] [PubMed] [Google Scholar]
- 13. Krause N, Brand RJ, Kaplan GA et al. Occupational physical activity, energy expenditure and 11‐year progression of carotid atherosclerosis. Scand J Work Environ Health 2007; 33: 405–424. 10.5271/sjweh.1171. [DOI] [PubMed] [Google Scholar]
- 14. Nimmo MA, Leggate M, Viana JL, King JA. The effect of physical activity on mediators of inflammation. Diabetes Obes Metab 2013; 15: 51–60. 10.1111/dom.12156. [DOI] [PubMed] [Google Scholar]
- 15. Coenen P, Huysmans MA, Holtermann A et al. Do highly physically active workers die early? A systematic review with meta‐analysis of data from 193 696 participants. Br J Sports Med 2018; 52: 1320–1326. 10.1136/bjsports-2017-098540. [DOI] [PubMed] [Google Scholar]
- 16. Chudasama YV, Khunti K, Gillies CL et al. Healthy lifestyle and life expectancy in people with multimorbidity in the UK biobank: a longitudinal cohort study. PLoS Med 2020; 17: e1003332. 10.1371/journal.pmed.1003332. [DOI] [PMC free article] [PubMed] [Google Scholar]
- 17. Leskinen T, Stenholm S, Aalto V, Head J, Kivimäki M, Vahtera J. Physical activity level as a predictor of healthy and chronic disease‐free life expectancy between ages 50 and 75. Age Ageing 2018; 47: 423–429. 10.1093/ageing/afy016. [DOI] [PubMed] [Google Scholar]
- 18. Stenholm S, Head J, Kivimaki M et al. Smoking, physical inactivity and obesity as predictors of healthy and disease‐free life expectancy between ages 50 and 75: a multicohort study. Int J Epidemiol 2016; 45: 1260–1270. 10.1093/ije/dyw126. [DOI] [PMC free article] [PubMed] [Google Scholar]
- 19. Zaninotto P, Head J, Steptoe A. Behavioural risk factors and healthy life expectancy: evidence from two longitudinal studies of ageing in England and the US. Sci Rep 2020; 10: 6955. 10.1038/s41598-020-63843-6. [DOI] [PMC free article] [PubMed] [Google Scholar]
- 20. Hsu CC, Chang HY, Wu IC et al. Cohort profile: the healthy aging longitudinal study in Taiwan (HALST). Int J Epidemiol 2017; 46: 1106. 10.1093/ije/dyw331. [DOI] [PMC free article] [PubMed] [Google Scholar]
- 21. Health Promotion Administration, Ministry of Health and Welfare, https://www.hpa.gov.tw/EngPages/Detail.aspx?nodeid=1077&pid=6198 (accessed: September 2023).
- 22. Wai JP, Wen CP, Chan HT et al. Assessing physical activity in an Asian country: low energy expenditure and exercise frequency among adults in Taiwan. Asia Pac J Clin Nutr 2008; 17: 297–308. [PubMed] [Google Scholar]
- 23. Ainsworth BE, Haskell WL, Herrmann SD et al. 2011 compendium of physical activities: a second update of codes and MET values. Med Sci Sports Exerc 2011; 43: 1575–1581. 10.1249/MSS.0b013e31821ece12. [DOI] [PubMed] [Google Scholar]
- 24. Kane RL, Kane RA. Assessing Older Persons: Measures, Meaning, and Practical Applications. Oxford: Oxford University Press, 2004. [Google Scholar]
- 25. Lawton MP, Brody EM. Assessment of older people: self‐maintaining and instrumental activities of daily living. Gerontologist 1969; 9: 179–186. [PubMed] [Google Scholar]
- 26. Byambasukh O, Snieder H, Corpeleijn E. Relation between leisure time, commuting, and occupational physical activity with blood pressure in 125 402 adults: the lifelines cohort. J Am Heart Assoc 2020; 9: e014313. 10.1161/JAHA.119.014313. [DOI] [PMC free article] [PubMed] [Google Scholar]
- 27. Coenen P, Huysmans MA, Holtermann A et al. Towards a better understanding of the ‘physical activity paradox’: the need for a research agenda. Br J Sports Med 2020; 54: 1055–1057. 10.1136/bjsports-2019-101343. [DOI] [PubMed] [Google Scholar]
- 28. Coenen P, Huysmans MA, Holtermann A et al. Can socioeconomic health differences be explained by physical activity at work and during leisure time? Rationale and protocol of the active worker individual participant meta‐analysis. BMJ Open 2018; 8: e023379. 10.1136/bmjopen-2018-023379. [DOI] [PMC free article] [PubMed] [Google Scholar]
- 29. Coenen P, Korshoj M, Hallman DM et al. Differences in heart rate reserve of similar physical activities during work and in leisure time‐a study among Danish blue‐collar workers. Physiol Behav 2018; 186: 45–51. 10.1016/j.physbeh.2018.01.011. [DOI] [PubMed] [Google Scholar]
- 30. Shephard RJ. Is there a ‘recent occupational paradox'where highly active physically active workers die early? Or are there failures in some study methods? Br J Sports Med 2019; 53: 1557–1559. [DOI] [PubMed] [Google Scholar]
- 31. Wang A, Arah OA, Kauhanen J, Krause N. Effects of leisure‐time and occupational physical activities on 20‐year incidence of acute myocardial infarction: mediation and interaction. Scand J Work Environ Health 2016; 42: 423–434. 10.5271/sjweh.3580. [DOI] [PubMed] [Google Scholar]
- 32. Stringhini S, Carmeli C, Jokela M et al. Socioeconomic status and the 25 x 25 risk factors as determinants of premature mortality: a multicohort study and meta‐analysis of 1.7 million men and women. Lancet 2017; 389: 1229–1237. 10.1016/S0140-6736(16)32380-7. [DOI] [PMC free article] [PubMed] [Google Scholar]
- 33. Health Promotion Administration, Ministry of Health and Welfare . Metabolic Syndrome, https://www.hpa.gov.tw/pages/list.aspx?nodeid=221 (accessed: October 2023).
- 34. Cai L, Hayward MD, Saito Y, Lubitz J, Hagedorn A, Crimmins E. Estimation of multi‐state life table functions and their variability from complex survey data using the SPACE program. Demogr Res 2010; 22: 129–158. 10.4054/DemRes.2010.22.6. [DOI] [PMC free article] [PubMed] [Google Scholar]
- 35. Moreno‐Agostino D, Daskalopoulou C, Wu YT et al. The impact of physical activity on healthy ageing trajectories: evidence from eight cohort studies. Int J Behav Nutr Phys Act 2020; 17: 92. 10.1186/s12966-020-00995-8. [DOI] [PMC free article] [PubMed] [Google Scholar]
- 36. Krell‐Roesch J, Syrjanen JA, Bezold J et al. Physical activity and trajectory of cognitive change in older persons: Mayo Clinic study of aging. J Alzheimers Dis 2021; 79: 377–388. 10.3233/JAD-200959. [DOI] [PMC free article] [PubMed] [Google Scholar]
- 37. Rogers NT, Marshall A, Roberts CH, Demakakos P, Steptoe A, Scholes S. Physical activity and trajectories of frailty among older adults: evidence from the English longitudinal study of ageing. PloS One 2017; 12: e0170878. 10.1371/journal.pone.0170878. [DOI] [PMC free article] [PubMed] [Google Scholar]
- 38. Krell‐Roesch J, Syrjanen JA, Vassilaki M et al. Association of non‐exercise physical activity in mid‐ and late‐life with cognitive trajectories and the impact of APOE epsilon4 genotype status: the Mayo Clinic study of aging. Eur J Ageing 2019; 16: 491–502. 10.1007/s10433-019-00513-1. [DOI] [PMC free article] [PubMed] [Google Scholar]
- 39. Nabe‐Nielsen K, Holtermann A, Gyntelberg F et al. The effect of occupational physical activity on dementia: results from the Copenhagen male study. Scand J Med Sci Sports 2021; 31: 446–455. 10.1111/sms.13846. [DOI] [PubMed] [Google Scholar]
- 40. Engeroff T, Ingmann T, Banzer W. Physical activity throughout the adult life span and domain‐specific cognitive function in old age: a systematic review of cross‐sectional and longitudinal data. Sports Med 2018; 48: 1405–1436. 10.1007/s40279-018-0920-6. [DOI] [PubMed] [Google Scholar]
- 41. Prince SA, Rasmussen CL, Biswas A et al. The effect of leisure time physical activity and sedentary behaviour on the health of workers with different occupational physical activity demands: a systematic review. Int J Behav Nutr Phys Act 2021; 18: 100. 10.1186/s12966-021-01166-z. [DOI] [PMC free article] [PubMed] [Google Scholar]
- 42. Appelman Y, van Rijn BB, Ten Haaf ME et al. Sex differences in cardiovascular risk factors and disease prevention. Atherosclerosis 2015; 241: 211–218. [DOI] [PubMed] [Google Scholar]
- 43. Biswas A, Harbin S, Irvin E et al. Sex and gender differences in occupational Hazard exposures: a scoping review of the recent literature. Curr Environ Health Rep 2021; 8: 267–280. 10.1007/s40572-021-00330-8. [DOI] [PMC free article] [PubMed] [Google Scholar]
- 44. Hallman DM, Mathiassen SE, Gupta N, Korshøj M, Holtermann A. Differences between work and leisure in temporal patterns of objectively measured physical activity among blue‐collar workers. BMC Public Health 2015; 15: 976. 10.1186/s12889-015-2339-4. [DOI] [PMC free article] [PubMed] [Google Scholar]
- 45. Hands B, Larkin D, Cantell MH et al. Male and female differences in health benefits derived from physical activity: implications for exercise prescription. J Womens Health, Issues Care 2016; 5. 10.4172/2325-9795.1000238. [DOI] [Google Scholar]
- 46. Messing K. Physical exposures in work commonly done by women. Can J Appl Physiol 2004; 29: 639–656. 10.1139/h04-041. [DOI] [PubMed] [Google Scholar]
- 47. Biswas A, Harbin S, Irvin E et al. Differences between men and women in their risk of work injury and disability: a systematic review. Am J Ind Med 2022; 65: 576–588. 10.1002/ajim.23364. [DOI] [PMC free article] [PubMed] [Google Scholar]
- 48. Alamgir H, Yu S, Drebit S, Fast C, Kidd C. Are female healthcare workers at higher risk of occupational injury? Occup Med (Lond) 2009; 59: 149–152. 10.1093/occmed/kqp011. [DOI] [PubMed] [Google Scholar]
- 49. Fan J, McLeod CB, Koehoorn M. Descriptive epidemiology of serious work‐related injuries in British Columbia, Canada. PloS One 2012; 7: e38750. 10.1371/journal.pone.0038750. [DOI] [PMC free article] [PubMed] [Google Scholar]
- 50. Tessier‐Sherman B, Cantley LF, Galusha D, Slade MD, Taiwo OA, Cullen MR. Occupational injury risk by sex in a manufacturing cohort. Occup Environ Med 2014; 71: 605–610. 10.1136/oemed-2014-102083. [DOI] [PMC free article] [PubMed] [Google Scholar]
- 51. Cote JN. A critical review on physical factors and functional characteristics that may explain a sex/gender difference in work‐related neck/shoulder disorders. Ergonomics 2012; 55: 173–182. 10.1080/00140139.2011.586061. [DOI] [PubMed] [Google Scholar]
- 52. Melchior M, Berkman LF, Niedhammer I, Zins M, Goldberg M. The mental health effects of multiple work and family demands. A prospective study of psychiatric sickness absence in the French GAZEL study. Soc Psychiatry Psychiatr Epidemiol 2007; 42: 573–582. 10.1007/s00127-007-0203-2. [DOI] [PMC free article] [PubMed] [Google Scholar]
- 53. Organization WHO . WHO Guidelines on Physical Activity and Sedentary Behaviour: Web Annex: Evidence Profiles, 2020.
- 54. Piercy KL, Troiano RP, Ballard RM et al. The physical activity guidelines for Americans. JAMA 2018; 320: 2020–2028. 10.1001/jama.2018.14854. [DOI] [PMC free article] [PubMed] [Google Scholar]
- 55. Baxter S, Blank L, Cantrell A, Goyder E. Is working in later life good for your health? A systematic review of health outcomes resulting from extended working lives. BMC Public Health 2021; 21: 1356. 10.1186/s12889-021-11423-2. [DOI] [PMC free article] [PubMed] [Google Scholar]
- 56. Murayama H, Takase M, Watanabe S, Sugiura K, Nakamoto I, Fujiwara Y. Employment in old age and all‐cause mortality: a systematic review. Geriatr Gerontol Int 2022; 22: 705–714. 10.1111/ggi.14449. [DOI] [PubMed] [Google Scholar]
- 57. de Wind A, van der Pas S, Blatter BM, van der Beek A. A life course perspective on working beyond retirement‐results from a longitudinal study in The Netherlands. BMC Public Health 2016; 16: 499. 10.1186/s12889-016-3174-y. [DOI] [PMC free article] [PubMed] [Google Scholar]
- 58. Nemoto Y, Takahashi T, Nonaka K et al. Working for only financial reasons attenuates the health effects of working beyond retirement age: a 2‐year longitudinal study. Geriatr Gerontol Int 2020; 20: 745–751. 10.1111/ggi.13941. [DOI] [PubMed] [Google Scholar]
- 59. Sewdas R, de Wind A, van der Zwaan LGL et al. Why older workers work beyond the retirement age: a qualitative study. BMC Public Health 2017; 17: 672. 10.1186/s12889-017-4675-z. [DOI] [PMC free article] [PubMed] [Google Scholar]
- 60. de Wind A, Sewdas R, Hoogendijk EO, van der Beek A, Deeg DJH, Boot CRL. Occupational exposures associated with life expectancy without and with disability. Int J Environ Res Public Health 2020; 17: 6377. 10.3390/ijerph17176377. [DOI] [PMC free article] [PubMed] [Google Scholar]
- 61. Deeg DJH, De Tavernier W, de Breij S. Occupation‐based life expectancy: actuarial fairness in determining statutory retirement age. Front Sociol 2021; 6: 675618. 10.3389/fsoc.2021.675618. [DOI] [PMC free article] [PubMed] [Google Scholar]
- 62. Liao WL, Chang YH. Age trajectories of disability in instrumental activities of daily living and disability‐free life expectancy among middle‐aged and older adults in Taiwan: an 11‐year longitudinal study. BMC Geriatr 2020; 20: 530. 10.1186/s12877-020-01939-4. [DOI] [PMC free article] [PubMed] [Google Scholar]
- 63. Beenackers MA, Kamphuis CB, Giskes K et al. Socioeconomic inequalities in occupational, leisure‐time, and transport related physical activity among European adults: a systematic review. Int J Behav Nutr Phys Act 2012; 9: 116. 10.1186/1479-5868-9-116. [DOI] [PMC free article] [PubMed] [Google Scholar]
- 64. Vega‐Salas MJ, Caro P, Johnson L, Armstrong MEG, Papadaki A. Socioeconomic inequalities in physical activity and sedentary behaviour among the Chilean population: a systematic review of observational studies. Int J Environ Res Public Health 2021; 18: 9722. 10.3390/ijerph18189722. [DOI] [PMC free article] [PubMed] [Google Scholar]
- 65. Chiu CT, Hayward MD, Chan A, Matchar DB. Educational differences in the compression of disability incidence in the United States. SSM Popul Health 2019; 7: 100347. 10.1016/j.ssmph.2018.100347. [DOI] [PMC free article] [PubMed] [Google Scholar]
- 66. Rahman MM, Jagger C, Leigh L et al. The impact of education and lifestyle factors on disability‐free life expectancy from mid‐life to older age: a multi‐cohort study. Int J Public Health 2022; 67: 1605045. 10.3389/ijph.2022.1605045. [DOI] [PMC free article] [PubMed] [Google Scholar]
- 67. Bauman A, Bull F, Chey T et al. The international prevalence study on physical activity: results from 20 countries. Int J Behav Nutr Phys Act 2009; 6: 21. 10.1186/1479-5868-6-21. [DOI] [PMC free article] [PubMed] [Google Scholar]
- 68. Silsbury Z, Goldsmith R, Rushton A. Systematic review of the measurement properties of self‐report physical activity questionnaires in healthy adult populations. BMJ Open 2015; 5: e008430. 10.1136/bmjopen-2015-008430. [DOI] [PMC free article] [PubMed] [Google Scholar]
- 69. Wai JP‐M. The accuracy and estimation of metabolic equivalent (MET) in adult males. Nutritional Sci J 2000; 25: 99–107. [Google Scholar]
- 70. Sanchez‐Sanchez JL, Izquierdo M, Carnicero‐Carreno JA et al. Physical activity trajectories, mortality, hospitalization, and disability in the Toledo study of healthy aging. J Cachexia Sarcopenia Muscle 2020; 11: 1007–1017. 10.1002/jcsm.12566. [DOI] [PMC free article] [PubMed] [Google Scholar]
- 71. Zimmer Z, Chiu CT, Saito Y, Jagger C, Ofstedal MB, Lin YH. Religiosity dimensions and disability‐free life expectancy in Taiwan. J Aging Health 2020; 32: 627–641. 10.1177/0898264319843445. [DOI] [PubMed] [Google Scholar]
- 72. Saito Y, Robine JM, Crimmins EM. The methods and materials of health expectancy. Stat J IAOS 2014; 30: 209–223. 10.3233/SJI-140840. [DOI] [PMC free article] [PubMed] [Google Scholar]
Associated Data
This section collects any data citations, data availability statements, or supplementary materials included in this article.
Supplementary Materials
FIGURE S1. Flow chart of the recruitment.
FIGURE S2. Sample included in the analyses.
FIGURE S3. Disabled life expectancies at 65 years old by household income and work‐related physical activity levels in men and women.
TABLE S1. Metabolic equivalent (MET) by levels of breathing efforts.
TABLE S2. Baseline characteristics for participants by follow‐up status at wave 2.
TABLE S3. Total, disability‐free, and disabled life expectancies by total physical activity (leisure‐time and work‐related combined).
TABLE S4. Energy expenditure (kcal/week) from work‐related physical activity in the National Health Interview Survey in Taiwan, 2009.
Data Availability Statement
The data that support the findings of this study are available on request from the corresponding author upon reasonable request. The data are not publicly available due to privacy or ethical restrictions.