

Abstract
Aim
Tongue strength plays an important role in the process of food intake, and low tongue pressure has been associated with aspiration pneumonia, cognitive decline, and mortality. However, special equipment for tongue pressure measurement is uncommon in general practice. Recently, the serum creatinine‐to‐cystatin C (Cr/CysC) ratio has been validated as a marker of muscle volume mass. Thus, we aimed to investigate the association of the serum Cr/CysC ratio with tongue pressure in a cross‐sectional study.
Methods
This single‐center, cross‐sectional study enrolled 73 participants (mean age, 71.7 years; men, 49.3%) who regularly attended the hospital for treatment of chronic disease. A tongue pressure of <30 kPa was defined as low tongue pressure. We evaluated the relationships between the serum Cr/CysC ratio and tongue pressure using multiple regression analysis.
Results
The serum Cr/CysC ratio was correlated with tongue pressure (R 2 = 0.25, P < 0.0001). In multiple regression analyses adjusted for confounders including age, sex, body mass index, and serum albumin, the association remained significant (P = 0.0001). In logistic analyses, the multivariable‐adjusted odds ratios of the Cr/CysC ratio for tertiles 1 and 2 compared with tertile 3 for low tongue pressure were 7.81 (95% confidence interval, 1.45–51.73) and 2.71 (95% confidence interval, 0.60–13.19), respectively.
Conclusions
We demonstrated that a decreased serum Cr/CysC ratio was associated with a higher risk of low tongue pressure. Our findings suggest that this simple serum surrogate marker may be a first step toward an intervention for oral function by general practitioners. Geriatr Gerontol Int 2024; 24: 102–108.
Keywords: creatinine‐to‐cystatin C ratio, oral hypofunction, sarcopenia, screening, tongue pressure
In a single‐center, cross‐sectional study with 73 participants (mean age, 71.7 years; men, 49.3%), we demonstrated the decreased serum creatinine‐to‐cystatin C ratio was associated with a higher risk of low tongue pressure. This simple serum surrogate marker may be a first step toward an intervention for oral function by general practitioners.
Introduction
With the aging of the population around the world, it is important that older people remain healthy and independent to achieve a healthy and long‐living society. 1 In recent years, there have been many reports about oral problems affecting general health, quality of life, and even life expectancy. 2 It has been reported that oral hypofunction is associated not only with malnutrition status and physical frailty 3 but also with swallowing dysfunction and a high risk of death from aspiration pneumonia. 4 Promoting oral function and timely treatment of impaired oral function is considered effective in preventing adverse health outcomes. 5
In the food intake process, tongue pressure plays one of the most important roles: mixing food and saliva into a bolus, and then passing it into the pharynx. 6 Lower tongue pressure has been reported to be associated not only with aspiration pneumonia 7 but also with cognitive decline 8 and mortality. 9 , 10 Intervention and rehabilitation of tongue pressure and oral function has been reported to improve the nutritional status and sequentially increase tongue strength, swallowing function, and activities of daily living. 11 , 12 , 13 Thus, early screening for low tongue pressure has been considered important to prevent pneumonia and frailty and to improve life expectancy. However, tongue pressure measurement requires special equipment and skilled dental hygienists 14 and is consequently rarely carried out by general dentists. A more practical and simple proxy for tongue pressure measurement is needed in general practice.
Tongue pressure has been reported to correlate with systemic muscle mass, 15 , 16 although the evaluation of skeletal muscle mass requires dual‐energy x‐ray absorptiometry or bioelectrical impedance analysis. 17 Because these examinations are often cumbersome at the primary care level, there is a need for practical and simple biomarkers. Although both creatinine and cystatin C are used as filtration markers to evaluate renal function, only creatinine originates from the skeletal muscle. 18 , 19 On this basis, the serum creatinine‐to‐cystatin C (Cr/CysC) ratio has been validated as a marker of muscle volume mass, 20 , 21 and it has since been used not only for screening for sarcopenia but also as a prognostic marker for frailty and life expectancy. 22 , 23 , 24 To date, no study has examined the usefulness of the Cr/CysC ratio as a marker of low oral function. In this context, we aimed to investigate the association of the serum Cr/CysC ratio with tongue pressure and other oral dysfunctions in a cross‐sectional study.
Methods
Study participants
This single‐center, cross‐sectional study was conducted at Kyushu Dental University Hospital (Kitakyushu, Japan) between May and December 2022. The inclusion criteria were patients aged ≥40 years who regularly attended the hospital for the treatment of chronic diseases such as hypertension or diabetes mellitus. The exclusion criteria were as follows: (i) undergoing dental treatment; (ii) undergoing denture/implant fabrication; (iii) edentulous; (iv) cannot walk alone; and (v) pregnant. A total of 79 participants were initially enrolled. For the present study, four participants who had a history of oral malignancy and two participants who were unable to perform the tongue pressure test due to hearing loss or dementia were excluded, and the remaining 73 participants were finally analyzed for the present study. The study conformed to the principles of the Declaration of Helsinki, and the protocol was approved by the Ethics Committee of Kyushu Dental University (approval number: 22–24). All participants provided written informed consent to participate this study.
Clinical evaluation and laboratory measurements
The participants completed a self‐administered questionnaire about their smoking habits, alcohol drinking habits, and exercise habits. Participants were classified as either current smokers or not, and alcohol drinkers were defined as those who drank one drink or more per week. Participants who engaged in daily exercise, including gymnastics, were placed in the exercise group. Fasting blood samples were collected by venipuncture, and the assessments were performed at one central laboratory (SRL Inc., Tokyo, Japan). Serum cystatin C, and highly sensitive C‐reactive protein concentrations were measured by latex immunonephelometry. We calculated the Cr/CysC ratio as the serum creatinine concentration expressed as milligrams per deciliter divided by the serum cystatin C concentration expressed as milligrams per deciliter. 20 , 21 , 22 , 23 , 24 The body composition parameters of the participants were measured using a bioelectrical impedance analysis (InBody 470 body composition analyzer; InBody Japan Inc., Tokyo, Japan). The skeletal muscle mass index (SMI) was calculated by dividing the appendicular skeletal muscle mass (kg) by the square of the height (cm).
Assessment of oral function
Oral function and dental status were assessed using the same criteria by skilled dental hygienists who had undergone prior training. The following parameters were measured: tongue pressure, tongue–lip motor function, occlusal force, masticatory function, swallowing function, and the number of remaining teeth. A detail method is shown in Method S1. Low tongue pressure was defined as a tongue pressure of <30 kPa; low tongue–lip motor function was defined as any one of the three pronunciations <6; low occlusal force was defined as an occlusal force of <500 N; low masticatory function was defined as having a glucose concentration of <100 mg/dL; and low swallowing function was defined as total score of the 10‐item Eating Assessment Tool ≥3. 25
Statistical analysis
The correlations with tongue pressure were assessed by Pearson's correlation for continuous variables and a logistic regression analysis for categorical variables. We evaluated the relationships between the serum Cr/CysC ratio, SMI, and tongue pressure using multiple regression analysis. The regression coefficients were calculated after multivariable adjustment for potential confounding factors, including age, sex, body mass index (BMI), exercise habits, serum albumin concentration, and number of teeth. We evaluated the association of other biomarkers including SMI, BMI, serum albumin, 25‐hydroxy vitamin D, serum creatinine, and cystatin C, using multivariable logistic regression analysis and estimated odds ratios (ORs) with 95% confidence intervals (CIs). For these analyses, we grouped the serum biomarkers into tertiles by sex and analyzed them as categorical variables. Multivariable logistic regression analysis was further performed to investigate the association of the serum Cr/CysC ratio with low tongue–lip motor function, low occlusal force, low masticatory function, and low swallowing function. We performed the statistical analyses with Statistical Analysis Software version 9.4 (SAS Institute Inc., Cary, NC, USA). Values of P < 0.05 were considered to represent statistical significance.
Results
Characteristics and their association with tongue pressure
Among the 73 participants in this study, 31 were diagnosed with low tongue pressure. Table 1 shows the clinical characteristics of the participants and correlations with tongue pressure. As expected, older age was significantly associated with lower tongue pressure. Lower BMI, serum albumin concentration, and dehydroepiandrosterone sulfate were significantly associated with lower tongue pressure. Sex and chronic diseases such as diabetes mellitus, hypertension, dyslipidemia, and kidney disease were not associated with tongue pressure.
Table 1.
Clinical characteristics of the study participants and correlations with tongue pressure
| Mean or percentage | Correlation coefficient or odds ratio (95% CI) | P value | |
|---|---|---|---|
| N | 73 | ||
| Age (years) | 71.7 ± 9.7 | −0.36 | 0.001 |
| Male sex (%) | 49.3 | 1.04 (0.99–1.09) | 0.14 |
| BMI (kg/m2) | 22.9 ± 3.6 | 0.28 | 0.01 |
| Current smoker (%) | 12.3 | 0.96 (0.89–1.03) | 0.25 |
| Current drinker (%) | 37.0 | 1.03 (0.98–1.08) | 0.29 |
| Exercise habits (%) | 68.1 | 1.01 (0.96–1.06) | 0.73 |
| Diabetes mellitus (%) | 38.4 | 0.99 (0.94–1.04) | 0.68 |
| Hypertension (%) | 76.7 | 1.03 (0.98–1.10) | 0.43 |
| Dyslipidemia (%) | 67.1 | 0.96 (0.91–1.01) | 0.11 |
| Systolic blood pressure (mm Hg) | 131.7 ± 16.0 | −0.23 | 0.05 |
| Diastolic blood pressure (mm Hg) | 77.1 ± 10.6 | 0.14 | 0.24 |
| Serum albumin (g/dL) | 4.3 ± 0.3 | 0.32 | 0.006 |
| Total cholesterol (mmol/L) | 5.2 ± 0.7 | −0.11 | 0.34 |
| Hemoglobin (g/dL) | 13.7 ± 1.3 | 0.16 | 0.17 |
| eGFR (mL/min/1.73m2) | 70.4 ± 16.7 | −0.22 | 0.06 |
| HbA1c (mmol/mol) | 41.3 ± 7.4 | −0.09 | 0.46 |
| 25(OH)D (ng/mL) | 18.0 ± 6.6 | 0.09 | 0.43 |
| Insulin (μU/mL) | 6.8 ± 5.0 | −0.10 | 0.42 |
| DHEAS (μg/dL) | 114 ± 72 | 0.31 | 0.007 |
| hsCRP (mg/dL) | 0.14 ± 0.27 | −0.12 | 0.31 |
| Insulin therapy (%) | 6.9 | 0.95 (0.86–1.05) | 0.32 |
| Oral hypoglycemic agents (%) | 28.8 | 0.99 (0.94–1.05) | 0.83 |
| Antihypertensive drug (%) | 63.0 | 1.05 (0.99–1.10) | 0.09 |
| Calcium channel blockers (%) | 50.7 | 0.03 (0.99–1.09) | 0.19 |
| Beta blockers (%) | 16.4 | 1.06 (1.00–1.14) | 0.06 |
| Diuretics (%) | 4.1 | 1.02 (0.91–1.15) | 0.73 |
| Statins (%) | 38.4 | 0.97 (0.93–1.02) | 0.27 |
| Antiplatelet drugs (%) | 6.9 | 0.96 (0.87–1.05) | 0.37 |
| Benzodiazepine receptor agonists (%) | 9.6 | 0.99 (0.91–1.07) | 0.71 |
Note: Values are expressed as means ± standard deviation or percentages. Correlation was expressed as correlation coefficients or odds ratio with 95% CI.
25(OH)D, 25‐hydroxyvitamin D; BMI, body mass index; CI, confidence interval; DHEAS, dehydroepiandrosterone sulfate; eGFR, estimated glomerular filtration rates; HbA1c, glycated hemoglobin; hsCRP, highly sensitive C‐reactive protein.
Correlations of the Cr/CysC ratio, SMI, and tongue pressure
Correlations of the serum Cr/CysC ratio and SMI with tongue pressure are shown in Figure 1.
Figure 1.
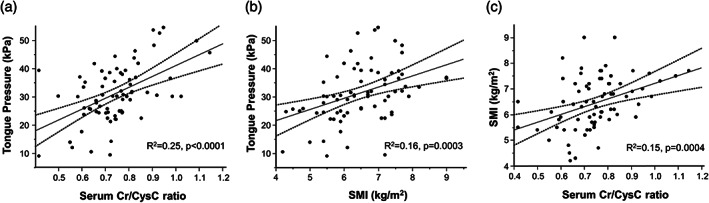
Distribution and correlations of the serum Cr/CysC ratio, SMI, and tongue pressure. Scatter plot of patients showing a significant correlation among the serum Cr/CysC ratio and tongue pressure (a), SMI and tongue pressure (b), and the serum Cr/CysC ratio SMI (c). Linear regression analysis: the middle line represents the regression line; the two flanking hyperbolic lines show the 95% confidence intervals of the regression line. Cr/CysC, serum creatinine‐to‐cystatin C; SMI, skeletal muscle mass index.
A scatter plot of participants showed a significant correlation among the serum Cr/CysC ratio and tongue pressure (R 2 = 0.25, P < 0.0001) (Fig. 1a). Similarly, SMI had a weak positive correlation with tongue pressure (R 2 = 0.16, P = 0.0003) (Fig. 1b). We further investigated the correlations of the serum Cr/CysC ratio with SMI and found a significant but weak correlation (R 2 = 0.15, P = 0.0004; Fig. 1c).
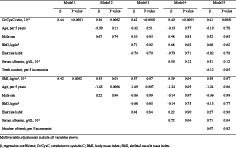
As shown in Table 2, the association of serum Cr/CysC ratio with tongue pressure was significant after multivariable adjustment for age, sex, BMI, exercise habits, serum albumin, and number of remaining teeth (β = 0.41, P = 0.0001). Even when we added current smoking, drinking status, diabetes mellitus, and 25‐hydroxy vitamin D as a further adjustment factor, the association remained significant (β = 0.46, P = 0.0003). Subgroup analyses of participants aged ≥65 years, male participants, and female participants, with diabetes and hypertension, were performed (Table S1), and the results consistently showed an association between the serum Cr/CysC ratio and tongue pressure. A similar association was also shown in the association between SMI and tongue pressure, although the statistical significance diminished after multivariable adjustment (β = 0.39, P = 0.07).
Table 2.
Multiple regression analysis of tongue pressure with the serum Cr/CysC ratio and SMI
| Model 1 | Model 2 | Model 3 | Model 4 | Model 5 | ||||||
|---|---|---|---|---|---|---|---|---|---|---|
| β | P value | β | P value | β | P value | β | P value | β | P value | |
| Cr/CysC ratio, 10−2 | 0.44 | <0.0001 | 0.36 | 0.0002 | 0.42 | <0.0001 | 0.40 | <0.0001 | 0.41 | 0.0001 |
| Age, per 5 years | −0.99 | 0.11 | −0.42 | 0.51 | −0.19 | 0.77 | −0.19 | 0.78 | ||
| Male sex | 0.67 | 0.74 | 0.10 | 0.93 | 0.48 | 0.83 | 0.52 | 0.85 | ||
| BMI, kg/m2 | 0.71 | 0.02 | 0.68 | 0.02 | 0.68 | 0.02 | ||||
| Exercise habits | −0.74 | 0.70 | −0.79 | 0.71 | −0.82 | 0.70 | ||||
| Serum albumin, g/dL, 10−1 | 0.50 | 0.12 | 0.51 | 0.12 | ||||||
| Teeth number, per five increments | −0.12 | 0.85 | ||||||||
| SMI, kg/m2, 10−1 | 0.42 | 0.0002 | 0.35 | 0.01 | 0.37 | 0.07 | 0.39 | 0.04 | 0.39 | 0.07 |
| Age, per 5 years | −1.65 | 0.0006 | −1.69 | 0.007 | −1.24 | 0.05 | −1.24 | 0.06 | ||
| Male sex | 0.22 | 0.94 | −0.06 | 0.99 | −0.14 | 0.97 | −0.06 | 0.99 | ||
| BMI, kg/m2 | −0.08 | 0.85 | −0.14 | 0.75 | −0.13 | 0.77 | ||||
| Exercise habits | 0.48 | 0.84 | 0.22 | 0.90 | 0.27 | 0.90 | ||||
| Serum albumin, g/dL, 10−1 | 0.72 | 0.04 | 0.71 | 0.04 | ||||||
| Number of teeth, per five increments | 0.07 | 0.92 | ||||||||
Note: Multivariable adjustments include all variables above.
BMI, body mass index; Cr/CysC, creatinine to cystatin C; SMI, skeletal muscle mass index.
Association of the Cr/CysC ratio, SMI, and BMI with low tongue pressure
The results of multiple logistic analyses between low tongue pressure and serum Cr/CysC tertiles are shown in Table 3. The prevalence of low tongue pressure in serum Cr/CysC ratio tertiles 1, 2, and 3 was 14 of 23 (60.9%), 11 of 24 (45.8%), and 6 of 26 (23.1%), respectively. The unadjusted OR (95% CI) of tertile 1 compared to tertile 3 for low tongue pressure was 5.19 (1.57–19.09). The association remained significant after multivariable adjustment for age, sex, BMI, exercise habits, serum albumin, and number of remaining teeth; the OR was 7.81 (95% CI, 1.45–51.73).
Table 3.
Multiple adjusted ORs and 95% CIs of biomarkers for presence of low tongue pressure
| Unadjusted model | Multivariable‐adjusted model | |||
|---|---|---|---|---|
| OR (95% CI) | P value | OR (95% CI) | P value | |
| Cr/CysC ratio | ||||
| T1 vs. T3 | 5.19 (1.57–19.09) | 0.009 | 7.81 (1.45–51.73) | 0.02 |
| T2 vs. T3 | 2.82 (0.82–10.02) | 0.09 | 2.71 (0.60–13.19) | 0.20 |
| SMI | ||||
| T1 vs. T3 | 22.67 (5.58–123.75) | <0.0001 | 11.76 (1.86–103.13) | 0.01 |
| T2 vs. T3 | 7.33 (1.89–37.21) | 0.007 | 3.79 (0.70–26.28) | 0.14 |
| BMI | ||||
| T1 vs. T3 | 10.31 (2.83–45.55) | 0.0008 | 8.11 (1.99–40.19) | 0.006 |
| T2 vs. T3 | 5.50 (1.55–23.29) | 0.01 | 5.17 (1.30–23.92) | 0.02 |
| Albumin | ||||
| T1 vs. T3 | 5.91 (1.49–27.37) | 0.02 | 5.15 (0.98–33.76) | 0.07 |
| T2 vs. T3 | 2.16 (0.75–6.58) | 0.16 | 3.82 (1.02–16.35) | 0.05 |
| 25(OH)D | ||||
| T1 vs. T3 | 1.73 (0.55–5.59) | 0.35 | 2.40 (0.62–10.01) | 0.21 |
| T2 vs. T3 | 1.60 (0.51–5.10) | 0.42 | 2.02 (0.50–8.83) | 0.33 |
| Creatinine | ||||
| T1 vs. T3 | 2.25 (0.70–7.56) | 0.18 | 4.22 (0.85–23.99) | 0.08 |
| T2 vs. T3 | 2.08 (0.67–6.73) | 0.21 | 1.63 (0.42–6.51) | 0.48 |
| Cystatin C | ||||
| T1 vs. T3 | 0.70 (0.24–1.95) | 0.50 | 1.24 (0.30–5.46) | 0.77 |
| T2 vs. T3 | 1.40 (0.52–3.74) | 0.50 | 0.97 (0.28–3.26) | 0.96 |
Note: Multivariable adjustments include age, sex, BMI, exercise habits, serum albumin, number of teeth. Tertile points are as follows: Cr/CysC ratio, male: T1: 0.74, T2: 0.81; female: T1: 0.66, T2: 0.74. SMI (kg/m2), male: T1: 6.7, T2: 7.4; female: T1: 5.5, T2: 6.2. BMI (kg/m2), male: T1: 20.9, T2: 23.9; female: T1: 20.9, T2: 25.4. Albumin (g/dL), male: T1: 4.1, T2: 4.4; female: T1: 4.2, T2: 4.5. 25(OH)D (ng/mL), male: T1: 17.9, T2: 22.2; female: T1: 12.2, T2: 19.3. Creatinine (mg/dL), male: T1: 0.82, T2: 0.92; female: T1: 0.57, T2: 0.69. Cystatin C (mg/dL), male: T1: 0.97, T2: 1.24; female: T1: 0.83, T2: 0.97.
25(OH)D, 25‐hydroxyvitamin D; BMI, body mass index; CI, confidence interval; Cr/CysC, creatinine to cystatin C; OR, odds ratio; SMI, skeletal muscle mass index; T1, tertile 1; T2, tertile 2; T3, tertile 3.
The prevalence of low tongue pressure in BMI tertiles 1, 2, and 3 was 17 of 23 (73.9%), 11 of 23 (47.8%), and 3 of 27 (11.1%), respectively. The multivariable‐adjusted OR of tertile 1 compared with tertile 3 for low tongue pressure was 11.76 (95% CI, 1.86–103.13). A similar significant association was shown between BMI and low tongue pressure, although that of serum albumin was marginally insignificant. A similar trend to the serum Cr/CysC ratio was observed in serum creatinine, but the association with low tongue pressure was insignificant.
We further grouped participants by a combination of serum Cr/CysC ratio tertiles and BMI tertiles. Figure S1 shows the prevalence of low tongue pressure among these groups. The prevalence of low tongue pressure was highest in the group with serum Cr/CysC ratio tertile 1 and BMI tertile 1 (87.5%). The frequency decreased as both serum Cr/CysC ratio and BMI increased.
Association of the Cr/CysC ratio with other oral dysfunctions
Table 4 shows the association of the serum Cr/CysC ratio with oral dysfunctions other than low tongue pressure: low tongue–lip motor function, low occlusal force, low masticatory function, and low swallowing function. In the multivariable‐adjusted model, a lower serum Cr/CysC ratio was significantly associated with low tongue–lip motor function. Low occlusal force and low masticatory function were not associated with the serum Cr/CysC ratio, although these two oral dysfunctions were significantly related to the number of remaining teeth; the multivariable‐adjusted OR of five increments of the number of remaining teeth was 0.48 (95% CI, 0.31–0.70) for low occlusal force, and 0.69 (95% CI, 0.48–0.96) for low masticatory function. A lower serum Cr/CysC ratio was associated with low swallowing function, although the association was marginally insignificant; the OR of tertile 1 versus tertile 3 in the serum Cr/CysC ratio for low swallowing function was 6.80 (95% CI, 0.81–83.19).
Table 4.
Multiple adjusted ORs and 95% CIs of the serum Cr/CysC ratio for presence of other oral dysfunctions
| Low tongue pressure | Low tongue–lip motor function | Low occlusal force | Low masticatory function | Low swallowing function | ||||||
|---|---|---|---|---|---|---|---|---|---|---|
| OR (95% CI) | P | OR (95% CI) | P | OR (95% CI) | P | OR (95% CI) | P | OR (95% CI) | P | |
| Cr/CysC ratio, T1 vs. T3 | 7.81 (1.45–51.73) | 0.02 | 10.94 (1.44–234.88) | 0.04 | 0.91 (0.16–4.82) | 0.91 | 1.55 (0.29–8.32) | 0.60 | 6.80 (0.81–83.19) | 0.09 |
| T2 vs. T3 | 2.71 (0.60–13.19) | 0.20 | 1.96 (0.47–8.89) | 0.36 | 0.27 (0.05–1.27) | 0.11 | 1.90 (0.43–8.93) | 0.40 | 2.26 (0.30–22.24) | 0.44 |
| Age, per 5 years | 1.04 (0.71–1.57) | 0.86 | 1.18 (0.82–1.71) | 0.36 | 1.10 (0.76–1.66) | 0.64 | 1.04 (0.73–1.57) | 0.85 | 0.94 (0.60–1.55) | 0.76 |
| Male sex | 0.34 (0.10–1.11) | 0.08 | 3.39 (0.91–14.55) | 0.08 | 0.27 (0.07–0.94) | 0.04 | 0.60 (0.17–1.91) | 0.39 | 2.78 (0.67–13.64) | 0.17 |
| BMI, kg/m2 | 0.71 (0.56–0.86) | 0.002 | 1.06 (0.88–1.30) | 0.55 | 1.07 (0.89–1.31) | 0.46 | 1.03 (0.87–1.22) | 0.72 | 0.71 (0.51–0.91) | 0.02 |
| Exercise habit | 0.75 (0.20–2.73) | 0.66 | 0.77 (0.18–3.03) | 0.71 | 1.29 (0.35–5.20) | 0.70 | 0.90 (0.27–3.21) | 0.87 | 0.38 (0.08–1.60) | 0.18 |
| Serum albumin, g/dL, 10−1 | 0.94 (0.74–1.17) | 0.59 | 0.82 (0.64–1.02) | 0.08 | 1.04 (0.84–1.28) | 0.73 | 1.12 (0.92–1.39) | 0.27 | 0.96 (0.74–1.23) | 0.71 |
| Number of teeth, per 5 | 0.97 (0.69–1.38) | 0.87 | 0.87 (0.50–1.38) | 0.58 | 0.48 (0.31–0.70) | 0.0004 | 0.69 (0.48–0.96) | 0.03 | 1.95 (0.64–1.46) | 0.82 |
Note: Multivariable adjustments include all variables above. Tertile points are as follows: Cr/CysC ratio, male: T1: 0.74, T2: 0.81; female: T1: 0.66, T2: 0.74. BMI, body mass index; CI, confidence interval; Cr/CysC, creatinine to cystatin C; OR, odds ratio; SMI, skeletal muscle mass index; T1, tertile 1; T2, tertile 2; T3, tertile 3.
Discussion
In this single‐center, cross‐sectional study, we demonstrated that a decreased serum Cr/CysC ratio was associated with a higher risk of low tongue pressure among Japanese patients with chronic disease. The relationship between the serum Cr/CysC ratio and tongue pressure was found to be significant after multivariable adjustment for covariates, including BMI and serum albumin concentration. To our knowledge, this is the first study to show the possibility of using the serum Cr/CysC ratio as a practical biomarker for low tongue pressure.
Creatinine and cystatin C act as glomerular filtration markers and can be used to estimate glomerular filtration rate in general practice. Creatinine almost exclusively originates from the skeletal muscle, 18 , 19 and cystatin C acts as a housekeeping gene excreted by all nucleic cells. 19 Thus, serum creatinine corrected for renal function can reflect total muscle volume in the body. As a surrogate marker of muscle volume and for screening sarcopenia, the serum Cr/CysC ratio has been used to evaluate residual muscle mass. 20 , 21 , 26 The serum Cr/CysC ratio was significantly correlated with the paraspinal muscle surface evaluated by abdominal computed tomography in 226 intensive care unit inpatients. 20 In another cross‐sectional study of 285 Japanese patients with type 2 diabetes, the serum Cr/CysC ratio was suggested as a tool for screening for sarcopenia. 26 Furthermore, among the older general population in Japan, the serum Cr/CysC ratio was correlated with skeletal muscle mass evaluated by bioelectrical impedance analysis (r = 0.53, P < 0.0001) in 213 men and 464 women. 21 The correlation of the serum Cr/CysC ratio with SMI in the present study is consistent with previous research (r = 0.39, P = 0.0004; Fig. 1C).
Oral frailty, including low tongue pressure, has been reported to predict the future onset of physical frailty. 27 Low tongue pressure in particular significantly hinders food bolus formation and propagation, leading to malnourishment following decreased oral intake. 28 , 29 Because protein synthesis requires a sufficient amount of protein intake due to anabolic resistance, especially in older people, decreased total energy and protein intake is considered to be associated with a risk of decreased systemic skeletal muscle mass. 30 The tongue muscle is a skeletal muscle and correlates with limb skeletal muscle mass. 16 A meta‐analysis of 10 observational studies has shown that reduced tongue strength was associated with sarcopenia among a total of 1513 participants. 15 Although there have been no large prospective studies investigating the impact of low skeletal muscle mass on future lower tongue pressure, there appears to be a bidirectional association between decreased tongue pressure and decreased systemic muscle mass.
In the present study, there were no statistically significant associations of the serum Cr/CysC ratio with occlusal force or masticatory function (Table 4), although a previous study has shown an association of sarcopenia with occlusal force and masticatory function. 31 However, in the current study, a lower number of remaining teeth was significantly correlated with low occlusal force and low masticatory function: OR, 0.48 (95% CI, 0.31–0.70) for low occlusal force, and 0.69 (95% CI, 0.48–0.96) for low masticatory function per five increments of teeth (Table 4). These results are consistent with a previous report showing a strong correlation between the number of remaining teeth and occlusal force (and consequently masticatory function). 32 Although both tongue and occlusal muscles are skeletal muscles, the results of the current study indicate that tongue pressure may be more strongly associated with systemic skeletal muscle than occlusal force.
Our study has several limitations. First, the study sample was small, and the number of adjustment factors was limited. Although various drugs such as insulin and corticosteroids have been reported to be associated with muscle strength, the present study included few participants with these drugs. The possibility that there are unknown confounding factors not adjusted for in this study cannot be ruled out. In addition, the number of participants in this study was 73, which was less than the required sample size of 103 assumed that a low tongue pressure frequency is 0.5 in the low‐muscle‐strength group and 0.3 in the high‐muscle‐strength group. 33 Since the association was significant in a smaller number of participants than expected, more robust results could be obtained with a larger sample size. Further studies are needed that focus on certain patient populations such as elderly and patients with some specific diseases. Second, tongue pressure measurements were taken on a single day without taking daily variability into account. However, the tongue pressure was measured as an average of three measurements, and we excluded patients undergoing oral treatment or having difficulty following instructions. Third, those with severely impaired kidney function often have sarcopenia and oral frailty; the serum Cr/CysC ratio cannot be used as a predictor of low tongue pressure in these cases because serum cystatin C does not increase at the stage of severely impaired kidney function as does serum creatinine. 19 However, because patients with estimated glomerular filtration rate <30 mL/min/1.73 m2 are reported to represent 0.35% of the general population, 34 the serum Cr/CysC ratio may be useful in the majority of the population. Fourth, we cannot draw conclusions regarding cause‐and‐effect relationships between decreased serum Cr/CysC ratios and low tongue pressure because of the cross‐sectional design of the study. Finally, because all participants in the current study were Japanese outpatients, it remains unclear whether the conclusions of the current study can be generalized to general and other ethnic populations. However, the usefulness of the Cr/CysC ratio as a sarcopenia marker was reported in studies mainly composed of White participants. 20 , 23 , 24
In conclusion, our study demonstrated that a decreased serum Cr/CysC ratio was associated with a higher risk of low tongue pressure. Despite the fact that tongue pressure and other functions have been found to be associated with various physical diseases, quality of life, and even prognosis, screening, diagnosis, and medical–dental collaboration are still inadequate. The results of this study suggest the possibility that this simple serum surrogate marker may be useful as the first step in an intervention for oral function by general practitioners.
Disclosure statement
The authors declare no conflict of interest.
Supporting information
Appendix S1. Assessment of oral function.
Acknowledgements
The authors thank Erika Matsumoto, Junko Mizushima, Mai Kuwano, Yoko Kuroda, Noriko Tokuyama, Ayako Hashimoto, and Kyoko Inoue (Kyushu Dental University Hospital). We also thank Edanz (https://jp.edanz.com/ac) for editing a draft of this manuscript. This work was supported in part by the Japan Society for the Promotion of Science KAKENHI from the Ministry of Education, Culture, Sports, Science and Technology of Japan (grant numbers 20 K19663, 23 K16232 to Y.K., and 19 K10467 to H.I.), and Yazuya Food and Health Research Foundation (to Y.K.).
Komorita Y, Ide H, Yoshinari M, et al. Decreased serum creatinine to cystatin C ratio is associated with low tongue pressure. Geriatr. Gerontol. Int. 2024;24:102–108. 10.1111/ggi.14780
Data availability statement
The datasets generated and analyzed during the current study are available from the corresponding author on reasonable request.
References
- 1. Rodrigues F, Domingos C, Monteiro D, Morouço P. A review on aging, sarcopenia, falls, and resistance training in community‐dwelling older adults. Int J Environ Res Public Health 2022; 19: 874. [DOI] [PMC free article] [PubMed] [Google Scholar]
- 2. Watanabe Y, Okada K, Kondo M, Matsushita T, Nakazawa S, Yamazaki Y. Oral health for achieving longevity. Geriatr Gerontol Int 2020; 20: 526–538. [DOI] [PubMed] [Google Scholar]
- 3. Iwasaki M, Motokawa K, Watanabe Y et al. Association between Oral frailty and nutritional status among community‐dwelling older adults: the Takashimadaira study. J Nutr Health Aging 2020; 24: 1003–1010. [DOI] [PubMed] [Google Scholar]
- 4. Sue Eisenstadt E. Dysphagia and aspiration pneumonia in older adults. J Am Acad Nurse Pract 2010; 22: 17–22. [DOI] [PubMed] [Google Scholar]
- 5. D'Souza RN, Collins FS, Murthy VH. Oral health for all – realizing the promise of science. N Engl J Med 2022; 386: 809–811. [DOI] [PubMed] [Google Scholar]
- 6. Utanohara Y, Hayashi R, Yoshikawa M, Yoshida M, Tsuga K, Akagawa Y. Standard values of maximum tongue pressure taken using newly developed disposable tongue pressure measurement device. Dysphagia 2008; 23: 286–290. [DOI] [PubMed] [Google Scholar]
- 7. Nakamori M, Hosomi N, Ishikawa K et al. Prediction of pneumonia in acute stroke patients using tongue pressure measurements. PloS One 2016; 11: e0165837. [DOI] [PMC free article] [PubMed] [Google Scholar]
- 8. Egashira R, Mizutani S, Yamaguchi M et al. Low tongue strength and the number of teeth present are associated with cognitive decline in older Japanese dental outpatients: a cross‐sectional study. Int J Environ Res Public Health 2020; 17: 8700. [DOI] [PMC free article] [PubMed] [Google Scholar]
- 9. Yajima Y, Kikutani T, Tamura F, Yoshida M. Relationship between tongue strength and 1‐year life expectancy in elderly people needing nursing care. Odontology 2017; 105: 477–483. [DOI] [PubMed] [Google Scholar]
- 10. Weikamp JG, Schelhaas HJ, Hendriks JC, de Swart BJ, Geurts AC. Prognostic value of decreased tongue strength on survival time in patients with amyotrophic lateral sclerosis. J Neurol 2012; 259: 2360–2365. [DOI] [PMC free article] [PubMed] [Google Scholar]
- 11. Namiki C, Hara K, Tohara H et al. Tongue‐pressure resistance training improves tongue and suprahyoid muscle functions simultaneously. Clin Interv Aging 2019; 14: 601–608. [DOI] [PMC free article] [PubMed] [Google Scholar]
- 12. Shirobe M, Watanabe Y, Tanaka T et al. Effect of an Oral frailty measures program on community‐dwelling elderly people: a cluster‐randomized controlled trial. Gerontology 2022; 68: 377–386. [DOI] [PMC free article] [PubMed] [Google Scholar]
- 13. Nagano A, Maeda K, Koike M et al. Effects of physical rehabilitation and nutritional intake management on improvement in tongue strength in sarcopenic patients. Nutrients 2020; 12: 3104. [DOI] [PMC free article] [PubMed] [Google Scholar]
- 14. Yoshikawa M, Fukuoka T, Mori T et al. Comparison of the Iowa Oral performance instrument and JMS tongue pressure measurement device. J Dent Sci 2021; 16: 214–219. [DOI] [PMC free article] [PubMed] [Google Scholar]
- 15. Chen KC, Lee TM, Wu WT, Wang TG, Han DS, Chang KV. Assessment of tongue strength in sarcopenia and sarcopenic dysphagia: a systematic review and meta‐analysis. Front Nutr 2021; 8: 684840. [DOI] [PMC free article] [PubMed] [Google Scholar]
- 16. Arakawa‐Kaneko I, Watarai Y, Schimmel M, Abou‐Ayash S. Relationship between tongue pressure and handgrip strength: a systematic review and meta‐analysis. J Oral Rehabil 2022; 49: 1087–1105. [DOI] [PMC free article] [PubMed] [Google Scholar]
- 17. Cruz‐Jentoft AJ, Baeyens JP, Bauer JM et al. Sarcopenia: European consensus on definition and diagnosis: report of the European working group on sarcopenia in older people. Age Ageing 2010; 39: 412–423. [DOI] [PMC free article] [PubMed] [Google Scholar]
- 18. Levey AS, Perrone RD, Madias NE. Serum creatinine and renal function. Annu Rev Med 1988; 39: 465–490. [DOI] [PubMed] [Google Scholar]
- 19. Viollet L, Gailey S, Thornton DJ et al. Utility of cystatin C to monitor renal function in Duchenne muscular dystrophy. Muscle Nerve 2009; 40: 438–442. [DOI] [PMC free article] [PubMed] [Google Scholar]
- 20. Kashani KB, Frazee EN, Kukralova L et al. Evaluating muscle mass by using markers of kidney function: development of the sarcopenia index. Crit Care Med 2017; 45: e23–e29. [DOI] [PubMed] [Google Scholar]
- 21. Kusunoki H, Tsuji S, Wada Y et al. Relationship between sarcopenia and the serum creatinine/cystatin C ratio in Japanese rural community‐dwelling older adults. J Cachexia Sarcopenia Muscle 2018; 3: 1–14. [Google Scholar]
- 22. Komorita Y, Iwase M, Fujii H et al. The serum creatinine to cystatin C ratio predicts bone fracture in patients with type 2 diabetes: the Fukuoka diabetes registry. Diabetes Res Clin Pract 2018; 146: 202–210. [DOI] [PubMed] [Google Scholar]
- 23. Jung CY, Joo YS, Kim HW et al. Creatinine‐cystatin C ratio and mortality in patients receiving intensive care and continuous kidney replacement therapy: a retrospective cohort study. Am J Kidney Dis 2021; 77: 509–516.e1. [DOI] [PubMed] [Google Scholar]
- 24. Jung CY, Kim HW, Han SH, Yoo TH, Kang SW, Park JT. Creatinine‐cystatin C ratio and mortality in cancer patients: a retrospective cohort study. J Cachexia Sarcopenia Muscle 2022; 13: 2064–2072. [DOI] [PMC free article] [PubMed] [Google Scholar]
- 25. Minakuchi S, Tsuga K, Ikebe K et al. Oral hypofunction in the older population: position paper of the Japanese Society of Gerodontology in 2016. Gerodontology 2018; 35: 317–324. [DOI] [PubMed] [Google Scholar]
- 26. Osaka T, Hamaguchi M, Hashimoto Y et al. Decreased the creatinine to cystatin C ratio is a surrogate marker of sarcopenia in patients with type 2 diabetes. Diabetes Res Clin Pract 2018; 139: 52–58. [DOI] [PubMed] [Google Scholar]
- 27. Tanaka T, Takahashi K, Hirano H et al. Oral frailty as a risk factor for physical frailty and mortality in community‐dwelling elderly. J Gerontol A Biol Sci Med Sci 2018; 73: 1661–1667. [DOI] [PubMed] [Google Scholar]
- 28. Chang KV, Wu WT, Chen LR, Wang HI, Wang TG, Han DS. Suboptimal tongue pressure is associated with risk of malnutrition in community‐dwelling older individuals. Nutrients 2021; 13: 1821. [DOI] [PMC free article] [PubMed] [Google Scholar]
- 29. Sakai K, Nakayama E, Tohara H et al. Relationship between tongue strength, lip strength, and nutrition‐related sarcopenia in older rehabilitation inpatients: a cross‐sectional study. Clin Interv Aging 2017; 12: 1207–1214. [DOI] [PMC free article] [PubMed] [Google Scholar]
- 30. Dardevet D, Rémond D, Peyron MA, Papet I, Savary‐Auzeloux I, Mosoni L. Muscle wasting and resistance of muscle anabolism: the "anabolic threshold concept" for adapted nutritional strategies during sarcopenia. ScientificWorldJournal 2012; 2012: 269531. [DOI] [PMC free article] [PubMed] [Google Scholar]
- 31. Kugimiya Y, Iwasaki M, Ohara Y et al. Association between sarcopenia and oral functions in community‐dwelling older adults: a cross‐sectional study. J Cachexia Sarcopenia Muscle 2023; 14: 429–438. [DOI] [PMC free article] [PubMed] [Google Scholar]
- 32. Ikebe K, Matsuda K, Murai S, Maeda Y, Nokubi T. Validation of the Eichner index in relation to occlusal force and masticatory performance. Int J Prosthodont 2010; 23: 521–524. [PubMed] [Google Scholar]
- 33. Kaji A, Hashimoto Y, Kobayashi Y et al. Sarcopenia is associated with tongue pressure in older patients with type 2 diabetes: a cross‐sectional study of the KAMOGAWA‐DM cohort study. Geriatr Gerontol Int 2019; 19: 153–158. [DOI] [PubMed] [Google Scholar]
- 34. Coresh J, Selvin E, Stevens LA et al. Prevalence of chronic kidney disease in the United States. JAMA 2007; 298: 2038–2047. [DOI] [PubMed] [Google Scholar]
Associated Data
This section collects any data citations, data availability statements, or supplementary materials included in this article.
Supplementary Materials
Appendix S1. Assessment of oral function.
Data Availability Statement
The datasets generated and analyzed during the current study are available from the corresponding author on reasonable request.