

Abstract
For specific drug research and development, a drug-screening strategy (DSS) plays an indispensable role in the biomedical field. Unfortunately, traditional strategies are complicated and insufficiently accurate due to the widely used single-target screening method. Herein, a simple dual-target-based drug-screening strategy (dt-DSS) is proposed to screen highly effective drugs by fluorescence imaging. As a proof of concept, we utilized a dual-responsive fluorescence probe to screen drugs for diabetic cardiomyopathy (DCM). We first developed and took advantage of a dual-response probe HDB to detect reactive oxygen species (ROS) and mitophagy levels in cellular starvation and high glucose models. Based on this, HDB was utilized to study the effects of different drugs in the mitophagy process caused by the high-glucose cell model for DCM. Combined with Western blotting assays, we found that Drp-1 inhibitors could fundamentally reduce mitophagy caused by the high-glucose cells model. Compared with commercial single-target antioxidant drugs, the drugs with simultaneous antioxidant capacity and Drp-1 inhibition screened by dt-DSS, such as resveratrol and icariin, could treat DCM better. Therefore, HDB as an effective tool could accurately and quickly screen high-potency drugs for DCM. We believe that this work provides an attractive strategy to explore the pathogenesis of diabetic cardiomyopathy and precisely screen for highly effective drugs.
Keywords: Fluorescent probes, Drug screening, Diabetic cardiomyopathy, Cell imaging
Drug-screening classification plays an integral role in the development of specific drugs. Currently, the drug-screening methods are mainly traditional ultraviolet–visible (UV–vis) spectrophotometry,1,2 liquid chromatography (LC),3 and virtual screening.4 In addition, in recent years, some novel drug-screening methods were developed rapidly, including capillary electrophoresis (CE),5 electrochemical biosensing, etc.6,7 However, current methods of drug-screening classification have many limitations. First, most of them are still in vitro screening models, which are severely disturbed by the environment and could easily lead to false screening results. Second, some of the drug-screening methods, such as LC and UV–vis spectrophotometry, require a large number of test samples, which are not convenient for large-scale drug-screening. Third, the newly developed drug-screening methods, including electrochemical biosensing and CE, basically utilize a known single target as the screening parameter. The drugs screened by such methods might not be capable of treating diseases fundamentally, which may lead to relapse in patients. By contrast, fluorescence-imaging-based drug-screening strategies have attracted more attention in clinical research due to their excellent biocompatibility.8−11 As is well-known, organic-probe-based fluorescence imaging has the advantages of real-time monitoring in vivo, rapid analysis, and relatively simple operation,12−19 which could avoid the problems of severe environmental interference and cumbersome operation encountered in the current drug screening process. Accordingly, in recent years, scientists have also developed some organic-based fluorescence probes for screening specific drugs.20,21 Unfortunately, these probes still remain a single-target-parameter-based drug-screening strategy. Therefore, it is invaluable to explore novel and effective drug screening strategies.
Diabetic cardiomyopathy (DCM) is a kind of diabetes-caused cardiovascular complication, which would lead to changes in myocardial structure and abnormal ventricular diastolic function.22 Of note, such disease is one of the important factors of death in diabetic patients.23 As reported, diabetes would disrupt the redox balance in vivo, triggering excessive oxidative stress which could lead to mitophagy.22 Such mitophagy would play an important driving role in the occurrence of DCM. Considering them, currently, DCM commercial drugs are reactive oxygen species (ROS) scavengers.24 Unfortunately, such single-target drugs would make DCM recur when stopping the medication, which greatly hinders further application. Besides, studies showed that mitochondrial fission protein (Drp-1) is overexpressed in cardiovascular diseases, which would also affect mitophagy.25,26 Predictably, such a protein Drp-1 is a potential therapeutic target as well. However, in DCM, the detailed relationship between Drp-1, ROS, and mitophagy remained unclear, which limited DCM drug development. Accordingly, it is urgent to figure out the relationship between Drp-1, ROS, and mitophagy and to screen for highly effective drugs for curing DCM.
Herein, we propose a simple dual-target-based drug-screening strategy (dt-DSS) to screen highly effective drugs by fluorescence imaging. As a proof of concept, we successfully screen dual-effect drugs for DCM. First, we constructed the dual-responsive fluorescence probe HDB for H2O2 and mitophagy detection. Subsequently, using HDB, we found that Drp-1 regulated mitophagy by enhancing oxidative stress, that is, Drp-1 → ROS → mitophagy. Finally, based on HDB, we achieved the rapid classification of DCM drugs. The experimental results showed that resveratrol and epimedium, which not only scavenged ROS but also inhibited Drp-1 overexpression, could better treat DCM, compared to commercial single-effect antioxidant drugs. We believe that the novel strategy will be a general strategy for rapidly screening highly effective drugs rapidly.
Experimental Section
Materials and Instruments
For details, see the Supporting Information.
Synthesis of HDB
HD-OH was synthesized according to the reported steps in the literature.27 Compound HD-OH, 2-(4-bromobenzyl)-4,4,5,5-tetramethyl-1,3,2-dioxaborolane, and K2CO3 were dissolved in anhydrous acetonitrile and stirred at 70 °C for 4 h. The solvent was removed under reduced pressure and eluted by silica gel chromatography with dichloromethane/methanol (v/v, 30:1) to give dark blue solid HDB (yield: 52%) 1H NMR (400 MHz, CD3OD) δ 8.73 (d, J = 13.7 Hz, 1H), 7.83 (s, 1H), 7.71(d, J = 6.0 Hz, 2H), 7.60 (t, J = 2.7 Hz, 3H), 7.54 (m, 3H), 7.26 (m, 2H), 6.57 (d, J = 15.0 Hz, 1H), 5.41 (s, 2H), 3.91 (s, 3H), 2.72–2.80 (m, 4H), 1.95 (t, J = 6.2 Hz, 2H), 1.84 (s, 6H), 1.35–1.30 (s, 12H). 13C NMR (100 MHz, CD3OD) δ: 179.7, 162.1, 157.9, 147.2, 144.2, 142.7, 133.8, 132.2, 129.4, 128.8, 128.5, 128.1, 127.7, 126.9, 126.6, 125.9, 121.8, 119.7, 116.7, 115.2, 112.6, 106.3, 101.2, 70.1, 51.6, 51.4, 37.6, 35.8, 35.1, 34.6, 31.6, 28.9, 28.3, 27.4, 25.9, 25.5, 23.6, 22.9, 20.1, 14.6, 13.1.
Culture of Cells
HeLa and H9C2 cells were simultaneously digested with trypsin. Cells were washed with 2 mL of Dulbecco’s modified Eagle’s medium (DMEM) to obtain a cell suspension. Then, 100 μL of cell suspension was aspirated and incubated individually in a culture dish. After 24 h of growth in the incubator, HDB was added and incubated for 1 h before confocal fluorescence imaging.
Results and Discussion
Design and Synthesis of Dual-Responsive Probe HDB
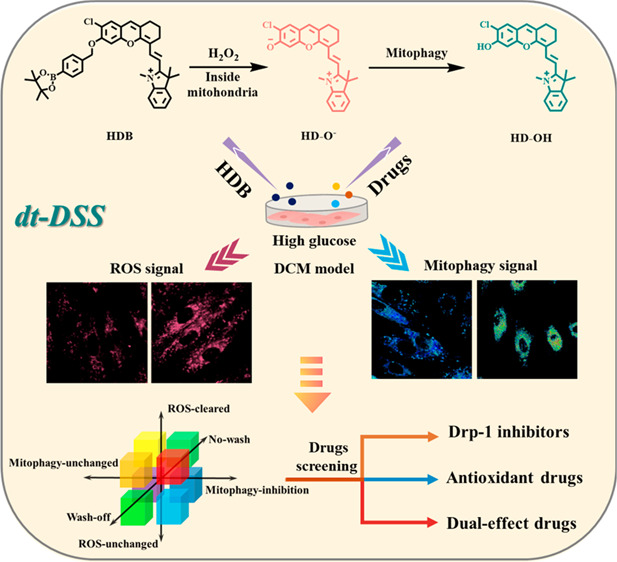
Diabetic cardiomyopathy (DCM) causes excess oxidative stress (produce excessive ROS), which might lead to the occurrence of mitophagy. During mitophagy, mitochondria (pH approximately 8.0)27 are separated into double-membrane autophagic vesicles, and then fuse with lysosomes to form autophagosomes (pH = 4.5–5.5).28 Therefore, in order to achieve dual target detection (ROS and mitophagy), we selected the HD-OH (pKa = 6.1, which is suitable to detect mitophagy) and H2O2-responsive benzyl boronic acid ester moiety to synthesize the dual-responsive probe (H2O2 and pH), HDB. When HDB was activated by excess H2O2 produced during mitochondrial oxidative stress, fluorophore HD-O- was released and showed a strong fluorescence at 725 nm. Subsequently, with the mitophagy occurring to result in a decreased pH, the HD-O- would turn into HD-OH and the emission would blue shift to 680 nm (Scheme S2, Figure 1a,b). Therefore, probe HDB is expected to be an effective tool to detect mitophagy caused by oxidative stress. The dual-responsive probe HDB was easily obtained by a few simple reactions with a high yield, as shown in Scheme S1. The intermediate dye HD-OH was synthesized according to the reported method.29,30 HD-OH was used as a raw material to obtain HDB by substituting benzyl bromide borate with anhydrous acetonitrile. The successful synthesis was carefully characterized by MALDI-TOF, 1H NMR, 13CNMR, and HR-MS (Figures S24, S26–28).
Figure 1.

(a) Schematic diagram of HDB for the visualization of high glucose-induced mitophagy in H9C2 (left) and HDB for precise drug screening (right). (b) Structural changes of HDB. (c) Absorption spectra of HDB (5 μM) in the absence or presence of H2O2 (300 μM) in PBS buffer solution (10 mM, pH = 7.4, PBS: EtOH = 8:2) shaken at 37 °C for 1 h. (d) Fluorescence spectra of HDB (5 μM) in PBS buffer solution (10 mM, pH = 7.4, PBS: EtOH = 8:2) upon addition of H2O2 (0–500 μM) shaken at 37 °C with 1h. λ ex = 640 nm. (e) Fluorescence emission spectra of HD-OH (5 μM) in buffer solution (PBS, 10 mM, pH = 7.4, PBS: EtOH = 8:2) with different pH values from pH 3.0 to pH 8.0. λex = 560 nm. Slit width: dex= dem= 10 nm.
Spectroscopic Properties of HDB
We first tested the absorption properties of HDB. The experimental results showed that HDB exhibited an absorbance peak at about 600 nm and two shoulder peaks in the range of 560–650 nm (Figure 1c). However, in the presence of H2O2, the absorption peak at 700 nm significantly increased, which indicated that HDB could be used for H2O2 detection. For further verification, the fluorescence emission spectrum of the reaction was also tested. As shown in Figure 1d, HDB was nonfluorescent. With the addition of H2O2, a new fluorescent emission band with a peak at 725 nm appeared, which was attributable to the generation of HD-O-. Based on this, the detection limit of HDB response to H2O2 was obtained (0.9 μM, Figure S4). In general, the H2O2 concentration in normal cells is low (0.001–0.7 μM).31 In contrast, during oxidative stress caused by external stimulation, H2O2 concentrations would be substantially upregulated (>10 μM).32 The results showed that HDB has a sensitive detection ability for H2O2. After that, we also characterized the HDB response by MALDI-TOF. The mass spectrometry results showed the HD-OH production after the addition of H2O2 to the buffer solution of HDB (Figure S25). The fluorescent kinetic curve of HDB is shown in Figure S5. In the presence of 50 μM H2O2, the fluorescence signal reached a plateau in about 3600 s, while without the addition of H2O2, there was almost no increase in the fluorescence signal of HDB at pH = 6.0 and 7.4 within 1 h. These results indicated that HDB could be activated effectively by H2O2 and also had good stability with respect to external pH changes. Such results indicated that probe HDB could detect H2O2 in vitro.
As mentioned above, during mitophagy, the pH of mitochondria decreases significantly. Therefore, it is necessary to demonstrate that the pH change could be observed after HDB reacted with H2O2. To verify it, we then tested HD-OH fluorescence spectrum at different pH. As shown in Figure 1e, companied with pH from basic (pH = 8.0) to acidic (pH = 3.0), the emission at 680 nm increased significantly but at 725 nm decreased, which resulted from the protonation of HD-O-. Based on it, the pKa of HD-OH was calculated to be 6.1, which was appropriate for tracing mitophagy (Figure S1). After that, the emission spectra of HD-OH at different concentrations in different pH buffer solutions (pH = 5.0, 6.0, 7.4) were tested (Figure S3). The results indicated that HD-OH has a good pH ratio response at lower concentrations (1 μM). Further, the selective experiments were conducted by fluorescence spectrum. HDB was tested with various substances in PBS at 37 °C. As shown in Figure S2, H2O2 induced significant fluorescence enhancement, while other substances caused negligible changes. These results indicated that HDB had the ability for selective H2O2 detection.
Detection of Mitophagy
Prior to performing cellular experiments, the cytotoxicities of HDB and HD-OH were assessed with MTT assays. As shown in Figures S6 and S7, HDB and HD-OH exhibited low cytotoxicity in living cells. Subsequently, to validate whether HDB could detect mitophagy induced by oxidative stress, we constructed a cell starvation model, which is widely recognized as a mitophagy model induced by oxidative stress.33−38 After the starvation model was established by culturing HeLa cells in a serum-free medium, probe HDB was incubated for 1 h. As shown in Figure S8, compared to the normal medium, the fluorescent intensity (663–738 nm) was significantly enhanced in the starvation model, which demonstrated that HDB could detect oxidative stress in the starvation model. In subsequent colocalization experiments (Figures S9, S10), we found that HDB and HD-OH localized to the mitochondria (Pearson correlation coefficient, 0.88, 0.89). To further validate, we performed fluorescence imaging of HeLa cells incubated with HDB at different time in the presence of H2O2. As shown in Figure S14, HDB showed a high Pearson’s correlation coefficient (>0.85) with Mito-Tracker Blue (5 μM) from 30 to 90 min. The colocalization results indicated HDB has satisfactory mitochondria-anchoring ability and limited leakage from the organelles containing mitochondria. Furthermore, to confirm that HDB could detect mitophagy after reacting with H2O2, we compared the changes in the fluorescence intensity at different starvation time points. As shown in Figure S11, accompanied by prolonged starvation time, the green channel (584–676 nm) gradually increased, but the red channel (735–750 nm) gradually diminished, indicating that the HD-O- accumulated in mitochondria was converted to HD-OH. Such results demonstrated that HD-OH could detect mitophagy in the cell starvation model. For further verification, colocalization cell experiments were then performed. The results showed that HD-OH and Lyso-Green (lysosome localization reagent) overlapped nicely, indicating that damaged mitochondria were bound by autophagic vesicles to form autolysosomes (Figure S12). Considering this, the fluorescence changes of HD-OH (HD-O-) accumulated in mitochondria could indeed reflect the extent of mitophagy. Therefore, the above results indicated that probe HDB could detect mitophagy induced by oxidative stress.
Based on the above conclusions, we applied HDB to study mitophagy in DCM. H9C2 cells have been used as a popular cell to investigate DCM.39,40 Generally, the DCM cellular model could be established by incubating H9C2 cells with high glucose concentration (HG, 30 mM glucose) for 24 h. Subsequently, to verify whether oxidative stress occurs in the DCM, HDB was incubated with high-glucose-cultured H9C2 cells. As shown in Figure 2a, compared with the normal group (NG, 5 mM glucose), fluorescence intensity (ROS signal: 663–738 nm) was significantly enhanced in the HG group, which indicated that oxidative stress did occur in the cellular model of DCM. Also, we found that the ratiometric fluorescence signal (mitophagy signal: 584–676 nm/735–750 nm) was obviously increased, illustrating that oxidative stress resulted in mitophagy. To further verify that mitophagy occurs in DCM, we performed Western blotting experiments (Figure 2d). As well-known, LC3-II protein levels are closely related to mitophagy.41,42 The results showed that the expression level of the LC3-II protein significantly increased in DCM, which indicated that mitophagy was significantly enhanced. Besides, the colocalization experiment was performed. As shown in Figure S13, HDB could overlap well with Lyso-Green after responding with H2O2 (Pearson correlation coefficient, 0.86), indicating the formation of autolysosomes. Afterward, the fluorescence pictures at different time points were used to demonstrate that HDB could be stabilized after responding in the high glucose model (Figure S15). Accordingly, based on the above experimental results, we could conclude that mitophagy induced by oxidative stress did occur in DCM.
Figure 2.
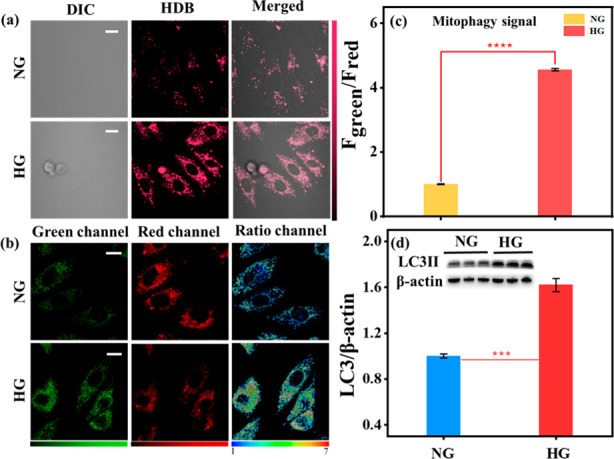
Fluorescence Imaging of H9C2 cells. H9C2 cells were incubated with different glucose concentrations for 24 h and then incubated with HDB (10 μM) for 1 h. NG: Normal glucose medium (5 mM) incubation. HG: High glucose medium (30 mM) incubation. (a) ROS signal, λem = 663–738 nm, λex = 561 nm. Scale bar: 20 μm. (b) Mitophagy signal; green channel: 584–676 nm, red channel: 735–750 nm, λex = 561 nm. Scale bar: 20 μm. (c) Normalized fluorescence intensity of the ratio channels in b, Fgreen and Fred: the fluorescence intensity of green and red channels. Error bars, ±SEM. n = 3. ****p < 0.0001. After incubation of H9C2 cells with different glucose concentrations, total cell extracts were analyzed with Western blotting. (d) ImageJ normalized quantitative analysis of the LC3-II/GAPDH ratios from immunoblots. Inset: Western blot analysis of LC3-II in NG and HG groups. Error bars, ±SEM. n = 3. ***p < 0.001. Bright field image of cell imaging: Figure S29.
Verification of Physiological Pathways
The drug screening was hampered since the relationship between Drp-1, oxidative stress, and mitophagy was unclear. Therefore, we explored this physiological pathway utilizing Mdivi-1 (a commercially available Drp-1 inhibitor) and NAC10 (N-acetyl-l-cysteine, a reported ROS scavenger). For this purpose, we set up four groups of parallel experiments: (1) Normal group (NG): H9C2 cells were cultured with normal glucose medium (5 mM) and then incubated with HDB for 1 h. (2) DCM group (HG): H9C2 cells were cultured with high glucose medium (30 mM) and then incubated with HDB for 1 h. (3) HG+P+M group: H9C2 cells were cultured with high glucose for 4 h and then incubated with both Mdivi-1 (M, 5 μM) and HDB probe (P) for 1 h. H9C2 cells were cultured with high glucose medium and Mdivi-1 simultaneously for 4 h and then HDB was added for 1 h. As shown in Figure 3b and c, compared to the HG group, both the mitophagy signal (584–676 nm/735–750 nm) and ROS signal (663–738 nm) were attenuated in the HG+M+P group, which indicated that mitophagy and oxidative stress were inhibited. In contrast, mitophagy was inhibited in the HG+P+M group, but H2O2 production from oxidative stress was still present. This suggested that the Drp-1 inhibitor could attenuate mitophagy by inhibiting oxidative stress, which led to the discontinuation of ROS production. However, ROS generated prior to the inhibition of Drp-1 could not be scavenged. Meanwhile, Western blotting experiments verified that Drp-1 levels were indeed increased in H9C2 cardiomyocytes induced by high glucose (Figure S15). These results demonstrated that Drp-1 is an upstream effector of mitophagy and oxidative stress. Subsequently, we used NAC to verify the relationship between oxidative stress and mitophagy. To this end, four experimental groups were established (Figure 4a): (1) Normal group (NG). (2) DCM group (HG). (3) Wash-off group: high-glucose-cultured H9C2 cells were incubated with NAC (100 μM) for 1 h, then washed off NAC and incubated with HDB (HG+NAC, w). (4) No-wash group: high-glucose-cultured H9C2 cells were incubated with NAC for 1 h and then incubated directly with HDB without washing the NAC (HG+NAC, nw). As shown in Figure 4, the ROS signal and mitophagy signal were decreased after adding NAC. However, the ROS signal and mitophagy signal were upregulated again after washing off NAC. Thus, it is evident that mitophagy is also inhibited after eliminating ROS, which suggested that oxidative stress was an upstream effector of mitophagy. Based on these phenomena, we demonstrated the physiological pathway “Drp-1 → oxidative stress → mitophagy”.
Figure 3.
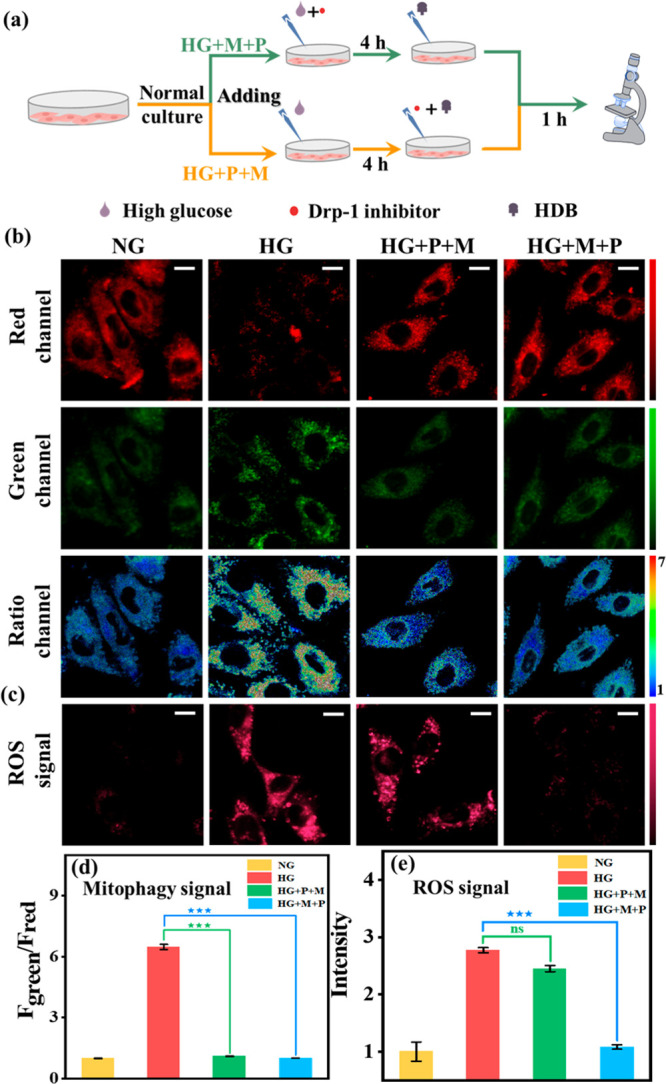
Real-time fluorescence imaging of H9C2 with HDB (10 μM). (a) Experimental flow diagram. HG+P+M group: H9C2 cells were cultured with high glucose for 4 h and then incubated with both Mdivi-1 (M, 5 μM) and the HDB probe (P) for 1 h. HG+M+P group: H9C2 cells were cultured with high glucose medium and Mdivi-1 simultaneously for 4 h, and then HDB was added for 1 h. (b) Mitophagy signal, green channel: λem = 584–676 nm, red channel: λem = 735–750 nm, λex = 561 nm. Scale bar: 20 μm. (c) ROS signal. λem = 663–738 nm, λex = 561 nm. Scale bar: 20 μm. (d) Normalized fluorescence intensity of the ratio channels in (b). (e) Normalized average fluorescence intensity of (c). Error bars, ±SEM. n = 3. ***p < 0.001. Bright field image of cell imaging: Figure S28.
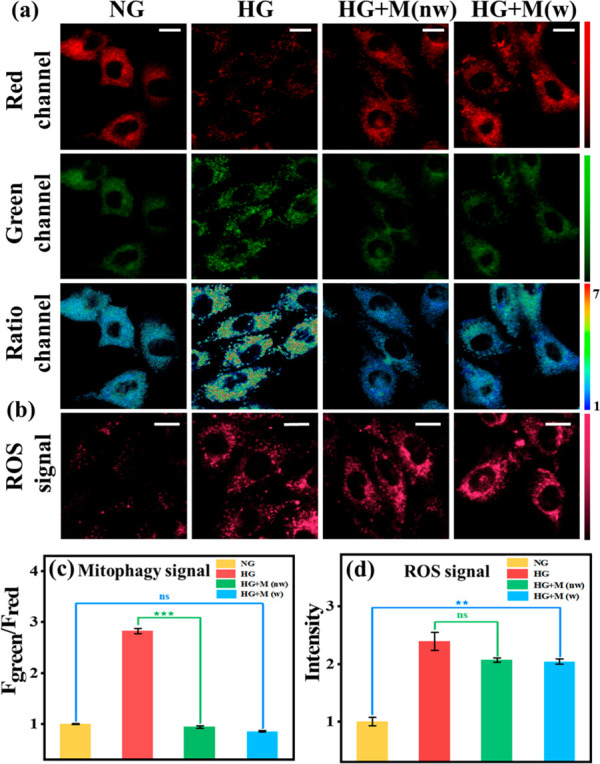
Figure 4.
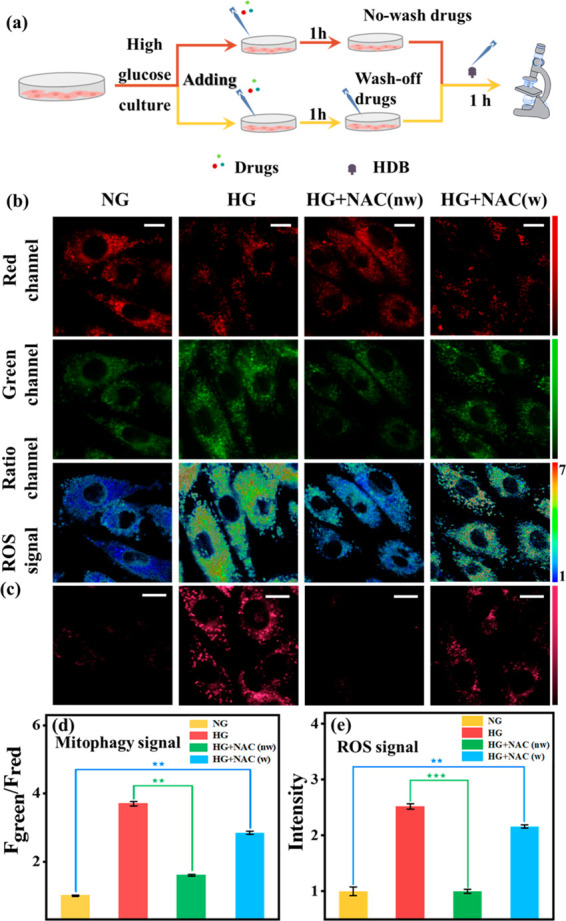
Real-time fluorescence imaging of H9C2 with HDB (10 μM). (a) Experimental flow diagram. HG+NAC (w): H9C2 cells were incubated with NAC (100 μM) for 1 h, then washed off NAC and incubated with HDB for another hour. HG+NAC (nw): H9C2 cells were incubated for 1 h with NAC (100 μM) and then incubated for another 1 h with HDB without washing off the NAC. (b): Mitophagy signal, green channel: λem = 584–676 nm, red channel: λem = 735–750 nm, λex = 561 nm. Scale bar: 20 μm. (c) ROS signal. λem = 663–738 nm, λex = 561 nm. Scale bar: 20 μm. (d) Normalized fluorescence intensity of the ratio channels in (b). (e) Normalized average fluorescence intensity of (c). Error bars, ±SEM. n = 3. **p < 0.01 and ***p < 0.001. Bright field image of cell imaging: Figure S28.
Construction of Drug Screening System
According to the above validated physiological pathways, the drugs for DCM can be divided into three types: (1) Antioxidant drugs. (2) Drp-1 inhibitors. (3) Dual-effect drugs (both antioxidants and Drp-1 inhibitors). Based on this, a drug classification system was first constructed using HDB to achieve accurate drug screening. First, in order to investigate the effects of different drug types, three reported drugs were selected: NAC (ROS scavenging), Mdivi-1 (Drp-1 inhibitor), and luteolin (Lut, dual-effect drug).43,44 Meanwhile, as shown in Figure 4, after adding NAC, the mitophagy signal and ROS signal were significantly reduced in the no-wash group compared to the wash-off group, indicating that NAC only temporarily cleared intracellular ROS and the cells returned to the damaged state after stopping the drug. Subsequently, in order to elucidate the pharmacodynamic effects of Mdivi-1 and luteolin, we also set up four parallel experiments for Mdivi-1 and luteolin: normal group (NG), DCM group (HG), wash-off group (HG+drugs, w), and no-wash group (HG+drugs, nw). As shown in Figure 5, with Mdivi-1 addition, mitophagy was effectively inhibited back to normal levels in the wash-off and no-wash groups. Moreover, compared to the no-wash group, the ROS signal did not increase after the drug. However, the ROS generated prior to drug administration cannot be cleared. These phenomena indicated that Drp-1 inhibitors could inhibit mitophagy by disabling ROS production but could not remove the ROS already produced. After the addition of luteolin, the mitophagy signal and ROS signal were effectively reduced in the wash-off and no-wash groups. The results showed such drugs could inhibit mitophagy by inhibiting Drp-1, and also scavenge excess ROS (Figure 6). In addition, the effect of the above three drugs on Drp-1 was again demonstrated with Western blotting assays. The results showed that Mdivi-1 and luteolin could inhibit the expression of Drp-1, while NAC did not affect the expression of Drp-1, consistent with the fluorescence imaging phenomenon (Figure S16). With the above conclusions, a spatial coordinate system was constructed to classify the eight possible scenarios accordingly by three variables: washing versus no washing after drug incubation, inhibition of the mitophagy signal or not, and reduced ROS signal or not (Figure 6e). Accordingly, the possible phenomena of the three-drug types were obtained. Antioxidant drugs: in the no-wash group, mitophagy signal and ROS signal were inhibited. In the wash-off group, both signals were upregulated. Drp-1 inhibitors: the mitophagy signal was significantly reduced while the ROS signal was largely unchanged in the wash-off and no-wash groups compared with the HG group. Dual-effect drugs: in the wash-off and no-wash group, both mitophagy signal and ROS signal were significantly reduced compared to the HG group.
Figure 5.
Real-time fluorescence imaging of H9C2 with HDB (10 μM). HG + Mdivi-1 (w): H9C2 cells were incubated with Mdivi-1 (5 μM) for 1 h and then washed off Mdivi-1 and incubated with HDB for another hour. HG+Mdivi-1 (nw): H9C2 cells were incubated for 1 h with Mdivi-1 (5 μM) and then incubated for another hour with HDB without washing off the Mdivi-1. (a) Mitophagy signal, green channel: λem = 584–676 nm, red channel: λem = 735–750 nm, λex = 561 nm. Scale bar: 20 μm. (b) ROS signal. λem = 663–738 nm, λex = 561 nm. Scale bar: 20 μm. (c) Normalized fluorescence intensity of the ratio channels in (a). (d) Normalized average fluorescence intensity of (b). Error bars, ±SEM. n = 3. **p < 0.01 and ***p < 0.001. Bright field image of cell imaging: Figure S28.
Figure 6.
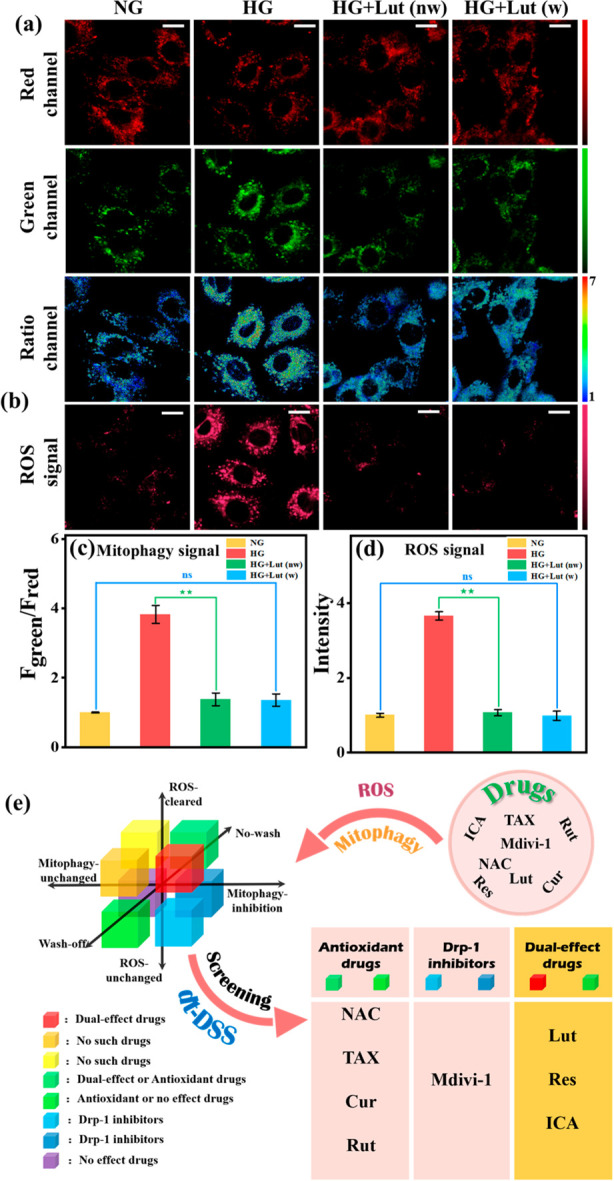
Real-time fluorescence imaging of H9C2 with HDB (10 μM). HG+Lut (w): H9C2 cells were incubated with Lut (50 μM) for 1 h, then washed off Lut, and incubated with HDB for another hour. HG+Lut (nw): H9C2 cells were incubated for 1 h with Lut (50 μM) and then incubated for another hour with HDB without washing off the Lut. (a): Mitophagy signal, green channel: λem = 584–676 nm, red channel: λem = 735–750 nm, λex = 561 nm. Scale bar: 20 μm. (b) ROS signal. λem = 663–738 nm, λex = 561 nm. Scale bar: 20 μm. (c) Normalized fluorescence intensity of the ratio channels in a. (d) Normalized average fluorescence intensity of b. (e) Schematic diagram of the spatial coordinate system for drug classification and dt-DSS. With the screening system, different drugs were accurately screened and classified according to fluorescent signals (ROS signals and mitophagy signals). Error bars, ±SEM. n = 3. **p < 0.01. Bright field image of cell imaging: Figure S28.
Application of Screening System for Drug Screening
According to the above drug screening system, we could quickly screen dual-effect drugs by simply observing the confocal fluorescence imaging results. Subsequently, we screened five drugs using the above method: Taxifolin (TAX), Resveratrol (Res), Icariin (ICA), Curcumin (Cur), and Rutin (Rut), which have been shown to be useful in the treatment of cardiovascular disease..45−49 The changes of the mitophagy signal and ROS signal in the no-wash and wash-off groups were examined after the addition of HDB and drugs. The effect of these drugs on Drp-1 activity was further verified with Western blotting experiments (Figures S17–S21). Subsequently, the classification of these drugs was determined in the classification system: Taxifolin, Curcumin, and Rutin were antioxidant drugs, while resveratrol and icariin were dual-effect drugs that not only scavenged excess ROS but also inhibited Drp-1 expression (Figure 6e). Thus, drug screening can be performed quickly and conveniently through this excellent screening strategy. Of note, compared with commercial antioxidant drugs for DCM, dual-effect drugs screened by the above strategy could better treat DCM.
Conclusion
In summary, we present a rapid, facile dual-target-based drug screening strategy that enables efficient drug screening at the cellular level through fluorescence imaging. As a proof of concept, the drugs for the treatment of diabetic cardiomyopathy (DCM) were screened with a dual-response fluorescent probe (HDB), which could detect mitophagy caused by oxidative stress. We then demonstrated that oxidative stress and mitophagy levels were abnormally elevated in a high-glucose-induced diabetic cardiomyopathy model. Subsequently, experiments demonstrated that Drp-1 overexpression enhanced oxidative stress and oxidative stress further enhanced mitophagy, which implied that “Drp-1 → ROS → mitophagy”. Based on this, three drug types were proposed for DCM treatment: antioxidant drugs, Drp-1 inhibitors, and dual-effect drugs. A variety of drugs were screened into these three classifications with the HDB. The experimental results showed that drugs with both antioxidant capacity and Drp-1 inhibitory properties, such as resveratrol and icariin, could more effectively treat DCM than single-target antioxidant drugs. We are convinced that this novel dual-effect strategy will become a universal strategy for the fast and easy screening of efficient drugs.
Acknowledgments
This work is supported by the National Key R&D Program of China (2019YFA0210100), and the National Science Foundation of China (21890744, 22004033).
Supporting Information Available
The Supporting Information is available free of charge at https://pubs.acs.org/doi/10.1021/cbmi.3c00112.
Synthesis, NMR spectra, some absorption and emission spectra, and additional experimental results (PDF)
Author Contributions
‡ P.Z.L. and Z.L. contributed equally and should be considered cofirst authors. All authors have given approval to the final version of the manuscript.
The authors declare no competing financial interest.
Supplementary Material
References
- Vargas S.; Ndjoko Ioset K.; Hay A. E.; Ioset J. R.; Wittlin S.; Hostettmann K. Screening medicinal plants for the detection of novel antimalarial products applying the inhibition of beta-hematin formation. J. Pharm. Biomed. Anal. 2011, 56, 880–886. 10.1016/j.jpba.2011.06.026. [DOI] [PubMed] [Google Scholar]
- Ito S.; Wakamatsu K. A convenient screening method to differentiate phenolic skin whitening tyrosinase inhibitors from leukoderma-inducing phenols. J. Dermatol. Sci. 2015, 80, 18–24. 10.1016/j.jdermsci.2015.07.007. [DOI] [PubMed] [Google Scholar]
- Debrus B.; Lebrun P.; Kindenge J. M.; Lecomte F.; Ceccato A.; Caliaro G.; Mbay J. M.; Boulanger B.; Marini R. D.; Rozet E.; Hubert Ph Innovative high-performance liquid chromatography method development for the screening of 19 antimalarial drugs based on a generic approach, using design of experiments, independent component analysis and design space. J. Chromatogr. A 2011, 1218, 5205–5215. 10.1016/j.chroma.2011.05.102. [DOI] [PubMed] [Google Scholar]
- Kitchen D. B.; Decornez H.; Furr J. R.; Bajorath J. Docking and scoring in virtual screening for drug discovery: methods and applications. Nat. Rev. Drug Discovery 2004, 3, 935–949. 10.1038/nrd1549. [DOI] [PubMed] [Google Scholar]
- de Jong S.; Krylov S. N. Pressure-based approach for the analysis of protein adsorption in capillary electrophoresis. Anal. Chem. 2012, 84, 453–458. 10.1021/ac2030333. [DOI] [PubMed] [Google Scholar]
- Lee S.; Cha E. J.; Park K.; Lee S. Y.; Hong J. K.; Sun I. C.; Kim S. Y.; Choi K.; Kwon I. C.; Kim K.; Ahn C. H. A near-infrared-fluorescence-quenched gold-nanoparticle imaging probe for in vivo drug screening and protease activity determination. Angew. Chem., Int. Ed. 2008, 47, 2804–2807. 10.1002/anie.200705240. [DOI] [PubMed] [Google Scholar]
- Aristotelous T.; Ahn S.; Shukla A. K.; Gawron S.; Sassano M. F.; Kahsai A. W.; Wingler L. M.; Zhu X.; Tripathi-Shukla P.; Huang X. P.; Riley J.; Besnard J.; Read K. M.; Roth B. L.; Gilbert I. H.; Hopkins A. L.; Lefkowitz R. J.; Navratilova I. Discovery of beta2 adrenergic receptor ligands using biosensor fragment screening of tagged wild-type receptor. ACS Med. Chem. Lett. 2013, 4, 1005–1010. 10.1021/ml400312j. [DOI] [PMC free article] [PubMed] [Google Scholar]
- Tong C.; Zhao C.; Liu B.; Li B.; Ai Z.; Fan J.; Wang W. Sensitive detection of RNase a activity and collaborative drug screening based on rGO and fluorescence probe. Anal. Chem. 2018, 90, 2655–2661. 10.1021/acs.analchem.7b04429. [DOI] [PubMed] [Google Scholar]
- Song D.; Jung Y. Homo-molecular fluorescence complementation for direct visualization of receptor oligomerization in living cells. Angew. Chem., Int. Ed. 2019, 58, 2045–2049. 10.1002/anie.201812780. [DOI] [PubMed] [Google Scholar]
- Cheng D.; Peng J.; Lv Y.; Su D.; Liu D.; Chen M.; Yuan L.; Zhang X. De novo design of chemical stability near-infrared molecular probes for high-fidelity hepatotoxicity evaluation in vivo. J. Am. Chem. Soc. 2019, 141, 6352–6361. 10.1021/jacs.9b01374. [DOI] [PubMed] [Google Scholar]
- Liew S. S.; Zeng Z.; Cheng P.; He S.; Zhang C.; Pu K. Renal-clearable molecular probe for near-infrared fluorescence imaging and urinalysis of SARS-CoV-2. J. Am. Chem. Soc. 2021, 143, 18827–18831. 10.1021/jacs.1c08017. [DOI] [PubMed] [Google Scholar]
- Li X.; Gao X.; Shi W.; Ma H. Design strategies for water-soluble small molecular chromogenic and fluorogenic probes. Chem. Rev. 2014, 114, 590–659. 10.1021/cr300508p. [DOI] [PubMed] [Google Scholar]
- Wang L.; Zhang J.; Kim B.; Peng J.; Berry S. N.; Ni Y.; Su D.; Lee J.; Yuan L.; Chang Y. T. Boronic Acid: A bio-inspired strategy to increase the sensitivity and selectivity of fluorescent NADH probe. J. Am. Chem. Soc. 2016, 138, 10394–10397. 10.1021/jacs.6b05810. [DOI] [PubMed] [Google Scholar]
- Liu H. W.; Chen L.; Xu C.; Li Z.; Zhang H.; Zhang X. B.; Tan W. Recent progresses in small-molecule enzymatic fluorescent probes for cancer imaging. Chem. Soc. Rev. 2018, 47, 7140–7180. 10.1039/C7CS00862G. [DOI] [PubMed] [Google Scholar]
- Zhang J.; Chai X.; He X. P.; Kim H. J.; Yoon J.; Tian H. Fluorogenic probes for disease-relevant enzymes. Chem. Soc. Rev. 2019, 48, 683–722. 10.1039/C7CS00907K. [DOI] [PubMed] [Google Scholar]
- Zeng Z.; Liew S. S.; Wei X.; Pu K. Hemicyanine-based near-infrared activatable probes for imaging and diagnosis of diseases. Angew. Chem., Int. Ed. 2021, 60, 26454–26475. 10.1002/anie.202107877. [DOI] [PubMed] [Google Scholar]
- Liu X.; He L.; Gong X.; Yang Y.; Cheng D.; Peng J.; Wang L.; Zhang X.-B.; Yuan L. Engineering of Reversible Luminescent Probes for Real-Time Intravital Imaging of Liver Injury and Repair. CCS Chem. 2022, 4, 356–368. 10.31635/ccschem.021.202000679. [DOI] [Google Scholar]
- Zhang X.; Ren T.; Yang F.; Yuan L. Rational design of far red to near-infrared rhodamine analogues with huge Stokes shifts for single-laser excitation multicolor imaging. Chin. Chem. Lett. 2021, 32, 3890–3894. 10.1016/j.cclet.2021.06.038. [DOI] [Google Scholar]
- Cheng D.; Xu W.; Gong X.; Yuan L.; Zhang X. B. Design strategy of fluorescent probes for live Drug-induced acute liver injury imaging. Acc. Chem. Res. 2021, 54, 403–415. 10.1021/acs.accounts.0c00646. [DOI] [PubMed] [Google Scholar]
- Cheng P.; Zhang J.; Huang J.; Miao Q.; Xu C.; Pu K. Near-infrared fluorescence probes to detect reactive oxygen species for keloid diagnosis. Chem. Sci. 2018, 9, 6340–6347. 10.1039/C8SC01865K. [DOI] [PMC free article] [PubMed] [Google Scholar]
- Qin Y.; Peng C.; Yang W.; Fan J.; Sheng W.-B.; Yi P.; Qiu Y.; Yu H.; Jiang S.; Wang W.; Liu B. A bi-functional fluorescent probe for visualized and rapid natural drug screening via GSTs activity monitoring. Sens. Actuators, B 2021, 328, 129047. 10.1016/j.snb.2020.129047. [DOI] [Google Scholar]
- Boudina S.; Abel E. D. Diabetic cardiomyopathy revisited. Circulation 2007, 115, 3213–3223. 10.1161/CIRCULATIONAHA.106.679597. [DOI] [PubMed] [Google Scholar]
- Cai L.; Kang Y J. Oxidative stress and diabetic cardiomyopathy. Cardiovasc. Toxicol. 2001, 1, 181–194. 10.1385/CT:1:3:181. [DOI] [PubMed] [Google Scholar]
- Huynh K.; Bernardo B. C.; McMullen J. R.; Ritchie R. H. Diabetic cardiomyopathy: mechanisms and new treatment strategies targeting antioxidant signaling pathways. Pharmacol. Ther. 2014, 142, 375–415. 10.1016/j.pharmthera.2014.01.003. [DOI] [PubMed] [Google Scholar]
- Jang W. B.; Park J. H.; Ji S. T.; Lee N. K.; Kim D. Y.; Kim Y. J.; Jung S. Y.; Kang S.; Lamichane S.; Lamichane B. D.; Ha J.; Yun J.; Moon H. R.; Baek S. H.; Chung H. Y.; Kwon S. M. Cytoprotective roles of a novel compound, MHY-1684, against hyperglycemia-induced oxidative stress and mitochondrial dysfunction in human cardiac progenitor cells. Oxid. Med. Cell. Longevity 2018, 2018, 4528184 10.1155/2018/4528184. [DOI] [PMC free article] [PubMed] [Google Scholar]
- Kobayashi S.; Zhao F.; Zhang Z.; Kobayashi T.; Huang Y.; Shi B.; Wu W.; Liang Q. Mitochondrial fission and mitophagy coordinately restrict high glucose toxicity in cardiomyocytes. Front. Physiol. 2020, 11, 604069 10.3389/fphys.2020.604069. [DOI] [PMC free article] [PubMed] [Google Scholar]
- Chen Y.; Zhu C.; Cen J.; Bai Y.; He W.; Guo Z. Ratiometric detection of pH fluctuation in mitochondria with a new fluorescein/cyanine hybrid sensor. Chem. Sci. 2015, 6, 3187–3194. 10.1039/C4SC04021J. [DOI] [PMC free article] [PubMed] [Google Scholar]
- Wang C.-W.; Klionsky D. J. The molecular mechanism of autophagy. Mol. Med. 2003, 9, 65–76. 10.1007/BF03402040. [DOI] [PMC free article] [PubMed] [Google Scholar]
- Yuan L.; Lin W.; Zhao S.; Gao W.; Chen B.; He L.; Zhu S. A unique approach to development of near-infrared fluorescent sensors for in vivo imaging. J. Am. Chem. Soc. 2012, 134, 13510–13523. 10.1021/ja305802v. [DOI] [PubMed] [Google Scholar]
- Liu Y.; Teng L.; Chen L.; Ma H.; Liu H. W.; Zhang X. B. Engineering of a near-infrared fluorescent probe for real-time simultaneous visualization of intracellular hypoxia and induced mitophagy. Chem. Sci. 2018, 9, 5347–5353. 10.1039/C8SC01684D. [DOI] [PMC free article] [PubMed] [Google Scholar]
- Miller E. W.; Albers A. E.; Pralle A.; Isacoff E. Y.; Chang C. J. Boronate-based fluorescent probes for imaging cellular hydrogen peroxide. J. Am. Chem. Soc. 2005, 127, 16652–16659. 10.1021/ja054474f. [DOI] [PMC free article] [PubMed] [Google Scholar]
- Stone J. R.; Collins T. Rapid phosphorylation of heterogeneous nuclear ribonucleoprotein C1/C2 in response to physiologic levels of hydrogen peroxide in human endothelial cells. J. Biol. Chem. 2002, 277, 15621–15628. 10.1074/jbc.M112153200. [DOI] [PubMed] [Google Scholar]
- Liu Y.; Zhou J.; Wang L.; Hu X.; Liu X.; Liu M.; Cao Z.; Shangguan D.; Tan W. A Cyanine dye to probe mitophagy: simultaneous detection of mitochondria and autolysosomes in live cells. J. Am. Chem. Soc. 2016, 138, 12368–12374. 10.1021/jacs.6b04048. [DOI] [PubMed] [Google Scholar]
- Hou L.; Ning P.; Feng Y.; Ding Y.; Bai L.; Li L.; Yu H.; Meng X. Two-photon fluorescent probe for monitoring autophagy via fluorescence lifetime imaging. Anal. Chem. 2018, 90, 7122–7126. 10.1021/acs.analchem.8b01631. [DOI] [PubMed] [Google Scholar]
- Gui L.; Yuan Z.; Kassaye H.; Zheng J.; Yao Y.; Wang F.; He Q.; Shen Y.; Liang L.; Chen H. A tumor-targeting probe based on a mitophagy process for live imaging. Chem. Commun. 2018, 54, 9675–9678. 10.1039/C8CC04246B. [DOI] [PubMed] [Google Scholar]
- Li S. S.; Zhang M.; Wang J. H.; Yang F.; Kang B.; Xu J. J.; Chen H. Y. Monitoring the changes of pH in lysosomes during autophagy and apoptosis by plasmon enhanced raman imaging. Anal. Chem. 2019, 91, 8398–8405. 10.1021/acs.analchem.9b01250. [DOI] [PubMed] [Google Scholar]
- Li X.; Li X.; Ma H. A near-infrared fluorescent probe reveals decreased mitochondrial polarity during mitophagy. Chem. Sci. 2020, 11, 1617–1622. 10.1039/C9SC05505C. [DOI] [PMC free article] [PubMed] [Google Scholar]
- Guo X.; Li Q.; Xiang J.; Liu M.; Guan A.; Tang Y.; Sun H. A hybrid aggregate FRET probe from the mixed assembly of cyanine dyes for highly specific monitoring of mitochondria autophagy. Anal. Chim. Acta 2021, 1165, 338561 10.1016/j.aca.2021.338561. [DOI] [PubMed] [Google Scholar]
- Younce C. W.; Wang K.; Kolattukudy P. E. Hyperglycaemia-induced cardiomyocyte death is mediated via MCP-1 production and induction of a novel zinc-finger protein MCPIP. Cardiovasc. Res. 2010, 87, 665–674. 10.1093/cvr/cvq102. [DOI] [PMC free article] [PubMed] [Google Scholar]
- Xiao H.; Wu C.; Li P.; Tang B. Simultaneous fluorescence visualization of endoplasmic reticulum superoxide anion and polarity in myocardial cells and tissue. Anal. Chem. 2018, 90, 6081–6088. 10.1021/acs.analchem.7b05440. [DOI] [PubMed] [Google Scholar]
- Mizushima N.; Yoshimori T.; Levine B. Methods in mammalian autophagy research. Cell 2010, 140, 313–326. 10.1016/j.cell.2010.01.028. [DOI] [PMC free article] [PubMed] [Google Scholar]
- Sun N.; Malide D.; Liu J.; Rovira I. I.; Combs C. A.; Finkel T. A fluorescence-based imaging method to measure in vitro and in vivo mitophagy using mt-Keima. Nat. Protoc. 2017, 12, 1576–1587. 10.1038/nprot.2017.060. [DOI] [PubMed] [Google Scholar]
- Nabavi S. F.; Braidy N.; Gortzi O.; Sobarzo-Sanchez E.; Daglia M.; Skalicka-Wozniak K.; Nabavi S. M. Luteolin as an anti-inflammatory and neuroprotective agent: A brief review. Brain. Res. Bull. 2015, 119, 1–11. 10.1016/j.brainresbull.2015.09.002. [DOI] [PubMed] [Google Scholar]
- Aziz N.; Kim M. Y.; Cho J. Y. Anti-inflammatory effects of luteolin: A review of in vitro, in vivo, and in silico studies. J. Ethnopharmacol. 2018, 225, 342–358. 10.1016/j.jep.2018.05.019. [DOI] [PubMed] [Google Scholar]
- Soetikno V.; Watanabe K.; Sari F. R.; Harima M.; Thandavarayan R. A.; Veeraveedu P. T.; Arozal W.; Sukumaran V.; Lakshmanan A. P.; Arumugam S.; Suzuki K. Curcumin attenuates diabetic nephropathy by inhibiting PKC-alpha and PKC-beta1 activity in streptozotocin-induced type I diabetic rats. Mol. Nutr. Food Res. 2011, 55, 1655–1665. 10.1002/mnfr.201100080. [DOI] [PubMed] [Google Scholar]
- Sun X.; Chen R. C.; Yang Z. H.; Sun G. B.; Wang M.; Ma X. J.; Yang L. J.; Sun X. B. Taxifolin prevents diabetic cardiomyopathy in vivo and in vitro by inhibition of oxidative stress and cell apoptosis. Food Chem. Toxicol. 2014, 63, 221–232. 10.1016/j.fct.2013.11.013. [DOI] [PubMed] [Google Scholar]
- Turan B.; Tuncay E.; Vassort G. Resveratrol and diabetic cardiac function: focus on recent in vitro and in vivo studies. J. Bioenerg. Biomembr. 2012, 44, 281–296. 10.1007/s10863-012-9429-0. [DOI] [PubMed] [Google Scholar]
- Wang Y. B.; Ge Z. M.; Kang W. Q.; Lian Z. X.; Yao J.; Zhou C. Y. Rutin alleviates diabetic cardiomyopathy in a rat model of type 2 diabetes. Exp. Ther. Med. 2015, 9, 451–455. 10.3892/etm.2014.2090. [DOI] [PMC free article] [PubMed] [Google Scholar]
- Zhou H.; Yuan Y.; Liu Y.; Ni J.; Deng W.; Bian Z. Y.; Dai J.; Tang Q. Z. Icariin protects H9c2 cardiomyocytes from lipopolysaccharideinduced injury via inhibition of the reactive oxygen speciesdependent cJun Nterminal kinases/nuclear factor-kappaB pathway. Mol. Med. Rep. 2015, 11, 4327–4332. 10.3892/mmr.2015.3289. [DOI] [PubMed] [Google Scholar]
Associated Data
This section collects any data citations, data availability statements, or supplementary materials included in this article.