Abstract
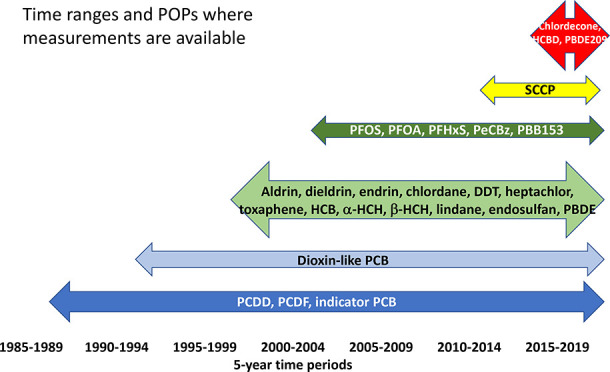
A set of human milk samples, consisting of pools from up to 50 mothers that delivered their first baby was assessed for the persistent organic pollutants (POPs) listed in the Stockholm Convention. It must be noted that only samples that qualified for the criteria, as established in the global monitoring plan of the Stockholm Convention, following an initial protocol from the World Health Organization, were included. The data do not allow for an assessment of POP concentrations in breast milk with lactation period nor, in most cases and when not indicated otherwise, a comparison within the same country. The assessment does not rank the POPs as to the risk for breastfeeding. Rather the measurements provide a basis for countries to compare among POPs or with other countries. A regional preference for certain POPs could not be identified; thus, taking into account global food supply chains and local production elsewhere does not allow us to prioritize a country for a certain POP. Although the highest concentrations were always found for the sum of DDT, these samples were not prominent in multivariate statistical analyses. The best indicator for the scale of POPs in breast milk was the sampling year: the earlier a national pool was created, the higher and the wider spread were the concentrations: see the example of dioxin-like POPs and indicator PCB. For some POPs, the income of a country seems to indicate scale and POP compounds. The population density was not found to be a suitable predictor or discriminator. Since all POPs seemed to level off and some POPs were only measured after the entry-into-force of the Stockholm Convention in 2004, we do not have a strong indicator to determine POP concentrations in the 1980s or before.
Keywords: Human breast milk, national income, population density, trend analysis, regional assessment, Stockholm Convention on POPs
1. Introduction
Chemical contaminants, including persistent organic pollutants (POPs) present a threat to human health and especially to early life stages. Whereas most of the chlorinated, brominated and fluorinated substances are not acutely toxic to humans, some of the POPs listed in the annexes of the Stockholm Convention on Persistent Organic Pollutants were classified as human carcinogens, class 1, by the international Agency for Research on Cancer (IARC). Class 1 POPs include all polychlorinated biphenyls (PCB),1,2 lindane,3 pentachlorophenol,4 one polychlorinated dibenzodioxin (PCDD, namely, 2,3,7,8-tetrachlorodibenzodioxin5) and one dibenzofuran (PCDF, namely, 2,3,5,7,8-pentachlorodibenzofuran6). A summary of all agents classified as to their carcinogenicity to humans is available from IARC.7 Human biomonitoring (HBM) is a kind of environmental chemical monitoring where human body fluids and tissues are examined for organic or inorganic contaminants. The World Health Organization (WHO) published a brochure on facts and figures from human biomonitoring.8 Human biomonitoring data can be used for human health risk assessment for quantitative exposure assessment and risk characterization of populations or cohorts. Quantitative biomonitoring data also can be used for trend analysis to assess changes in concentrations of contaminants over time, spatial changes to explore regional differences or other supporting information.
Whereas measuring chemicals in blood and urine in workers that were exposed to toxicants, or their breakdown products, has a long tradition, environmental health tracking for the general population, as human biomonitoring, started only in the 1990s. Early examples of biomonitoring began on a wide scale in the United States in the early 1990s, when the National Health and Nutrition Examination Survey (NHANES), expanded their indicators to include environmental chemicals to provide scientists, physicians, and health officials to help prevent exposure to these contaminants.9 The NHANES methodology measures chemicals and their metabolites in blood, serum, and urine samples to reflect the amount of the chemical that gets into the human body through all routes of exposure. In Europe, human biomonitoring programs have been setup and one of the first studies was an assessment of PCDD/PCDF in human milk by Beck et al.10 With the entry-into-force of the Stockholm Convention in 2004, early WHO initiatives directed toward PCDD, PCDF, and PCB have been expanded to include all POPs listed in the Convention. According to the guidelines for the global monitoring plan (GMP) under the Convention, human exposure should be assessed by using either human milk (from primiparae) or human blood. Human milk was the preferred matrix since it allowed for noninvasive sampling.11,12 Further, the early WHO protocols and the then UNEP protocols, as a cost-efficient approach, requested countries to prepare national pools for chemical analysis rather than analyzing the breast milk of individual donors.13,14 In 2017, a health risk assessment for PCDD, PCDF, PCB, and DDT for breastfeeding mothers was published.15
The results of chemical analysis of national pools following the above-mentioned protocols have been assessed for time trends and spatial trends and were published recently.16 Here, we assess the quantitative data from 189 national pools of human milk from 90 countries for 28 POPs listed in the Stockholm Convention for socioeconomic factors such as national income of the country and population density at the time of the sampling. These results complement earlier assessments for temporal and spatial distributions of POPs in human milk.11,15−18 The data provided herein would give further insight on metadata analysis and assist scientists and decision makers to assess human risk for POPs and assist in POPs management to further reduce human exposures.
2. Materials and Methods
2.1. Origin of Samples
Quantitative data for 28 POPs were extracted from studies as described in a previous publication.16 Briefly, two reports by the World Health Organization (WHO)19,20 and one report by the United Nations Environment Programme (UNEP)21 were systematically evaluated and data extracted for dioxin-like POPs, i.e., polychlorinated dibenzodioxins (PCDD), polychlorinated dibenzofurans (PCDF), and polychlorinated biphenyls (PCB). All data were entered into a standardized table and maintained in Microsoft Excel. These data were amended by the results for these three but also for other organochlorine pesticides (OCPs), industrial chlorinated POPs (thereafter referred to as “ind.POPs”, brominated flame retardants (BFRs), and perfluorinated substances (PFAS) from UNEP human milk surveys that were conducted since 2000 in support of the Stockholm Convention on POPs. The most recent human milk samples were collected in 2019. For China, two scientific publications were included that fulfilled the criteria below.22,23
The data assessed here were from donor mothers that fulfilled the criteria of an initial WHO protocol14 and an updated guidance document by UNEP.13 Briefly, primiparae were selected on a national basis for a donation of 50 mL of breast milk. Of these, 25 mL from each mother was compiled into one national pool and analyzed for POPs. The other 25 mL remained with the donor country for analysis in a national laboratory or was stored in a human milk bank for future analysis. It was recommended that one national pool be prepared for each 50 million inhabitants; however, it must be stated that many countries around the world and participating in these surveys have less than 50 million inhabitants. The identity of the donor mothers was not disclosed to UNEP, WHO, or the analytical laboratories.
2.2. Chemical Analysis
Chemical analysis was performed by the laboratories as defined in the two WHO reports, the China National Institute of Nutrition and Food Safety, and since 2000 within WHO- or UNEP-coordinated projects, the State Institute for Chemical and Veterinary Analysis of Food, Freiburg, Germany, for brominated and chlorinated POPs, and Örebro University, MTM Research Centre, Örebro, Sweden, for perfluorinated POPs. The laboratories used their own optimized and validated analytical methods. General guidelines for instrumentation and analysis were provided in the guidance document of the GMP,24 and standard operational procedures were developed under the UNEP projects.25−27
Amounts of most chlorinated and all brominated POPs were given in ng/g lipid. For dioxin-like POPs (dl-POPs), all values of the 29 compounds were calculated as toxic equivalents (TEQ) using the 2005 WHO TEF scheme.28 According to the listing in the Annex C of the Stockholm Convention, seven 2,3,7,8-substituted PCDD were recorded as TEQ_PCDD, ten 2,3,7,8-substituted PCDF as TEQ_PCDF, and 12 dl-PCB as TEQ_PCB. All amounts were given in pg TEQ/g lipid. Results for perfluoroalkyl substances (PFAS) were given in pg/g fresh weight (f.w.).
For assessments, POPs have been grouped together as follows:
OCPs (organochlorine pesticides) included aldrin, endrin, dieldrin, chlordane, DDT, heptachlor, mirex, toxaphene, α-hexachlorocyclohexane (α-HCH), β-HCH, lindane, chlordecone, and endosulfan;
Industrial POPs (referred to as indPOPs) included six PCB6, hexachlorobenzene (HCB), pentachlorobenzene (PeCBz), hexachlorobutadiene (HCBD), and short-chain chlorinated paraffins (SCCP);
dl-POPs (sometimes referred to as TEQ) included PCDD, PCDF, and dl-PCB;
BFRs included polybrominated diphenyl ether (PBDE), PBDE 209, hexabromocyclododecane (HBCD), and hexabromobiphenyl (PBB153)
PFAS included perfluorooctane sulfonic acid (PFOS), perfluorooctanoic acid (PFOA), and perfluorohexane sulfonic acid (PFHxS.)
2.3. Metadata
Metadata used for the assessment included geographic location, year of the sampling/generation of the national pool, wealth, and population density of the country.
The geographic location was defined as the UN region where the country of donor mothers is located. For the grouping of national pools, the United Nations definition29 was used and countries grouped into the UN regions with Africa, Asia, Central and Eastern Europe (CEE), Group of Latin American and Caribbean countries (GRULAC), and Western European and other groups (WEOG). Country names are shown by their ISO-3 alpha codes.30
Wealth of the country was defined as the gross national income (GNI) purchasing power per capita (PPP) in US dollar according to information on world development indicators retrieved from the World Bank open data catalog.31−33 Income groups were defined according to the World Bank classification and Atlas method and expressed as WBC. The income groups used include high-income (H), upper-middle (UM), lower-middle (LM), and low (L) income groups. The ranges of income per year (in US dollar) are defined and published annually by the World Bank. All classification and numeric values were adjusted to the year of sampling. The grouping of the 189 national pools according to the WBC for the UN regions and the periods are summarized in Table 1.
Table 1. Number of National Pools Analyzed According to WBC within Regions and Periodsa.
| L (N = 24) | LM (N = 54) | UM (N = 41) | H (N = 70) | Overall (N = 189) | |
|---|---|---|---|---|---|
| Region | |||||
| Africa | 17 (70.8%) | 13 (24.1%) | 2 (4.9%) | 32 (16.9%) | |
| Asia | 3 (12.5%) | 26 (48.1%) | 9 (22.0%) | 5 (7.1%) | 43 (22.8%) |
| CEE | 1 (4.2%) | 15 (27.8%) | 12 (29.3%) | 5 (7.1%) | 33 (17.5%) |
| GRULAC | 3 (12.5%) | 18 (43.9%) | 5 (7.1%) | 26 (13.8%) | |
| WEOG | 55 (78.6%) | 55 (29.1%) | |||
| Period | |||||
| 1985–1989 | 1 (4.2%) | 2 (3.7%) | 1 (2.4%) | 12 (17.1%) | 16 (8.5%) |
| 1990–1994 | 1 (4.2%) | 7 (13.0%) | 1 (2.4%) | 10 (14.3%) | 19 (10.1%) |
| 2000–2004 | 2 (8.3%) | 6 (11.1%) | 5 (12.2%) | 14 (20.0%) | 27 (14.3%) |
| 2005–2009 | 9 (37.5%) | 9 (16.7%) | 7 (17.1%) | 10 (14.3%) | 35 (18.5%) |
| 2010–2014 | 4 (16.7%) | 13 (24.1%) | 14 (34.1%) | 10 (14.3%) | 41 (21.7%) |
| 2015–2019 | 7 (29.2%) | 17 (31.5%) | 13 (31.7%) | 14 (20.0%) | 51 (27.0%) |
L = low income, LM = lower-middle income, UM = upper-middle income, H = high income.
Numeric values for the population density were taken from the World Bank’s open data catalog and referred to as “PopDen”. PopDen is defined as people per square kilometer of land area (pop/km2) (https://data.worldbank.org/indicator/EN.POP.DNST). Therefore, we are using national data for the characterization by country and established our own grouping therein, rather than using terms such as “rural”, “urban”, or “industrial”, which do not have a commonly accepted definition. The assignments of the countries and samples for the minimum and maximum values of GNI and population density as well as the associated WBC and PD_Codes are contained in the Supporting Information as Table S1 and the summary in Table S2. The least densely populated country (at the year of the sampling) was Mongolia with 2.0 inhabitants per km2. All values refer to the year the sampling for the national pool occurred. The grouping of the 189 national pools according to the population density for the UN regions and the periods are summarized in Table 2.
Table 2. Number of National Pools Analyzed According to Population Density within Regions and Periods.
| PD < 25 (N = 46) | PD_25–90 (N = 47) | PD_90–200 (N = 55) | PD_200–330 (N = 20) | PD_330–2000 (N = 19) | PD > 2000 (N = 2) | Overall (N = 189) | |
|---|---|---|---|---|---|---|---|
| Region | |||||||
| Africa | 6 (13.0%) | 12 (25.5%) | 10 (18.4%) | 2 (10.0%) | 2 (10.5%) | 32 (16.9%) | |
| Asia | 8 (17.4%) | 10 (20.8%) | 15 (27.8%) | 4 (20.0%) | 4 (21.1%) | 2 (100%) | 43 (22.8%) |
| CEE | 2 (4.3%) | 13 (27.1%) | 18 (33.3%) | 33 (17.5%) | |||
| GRULAC | 12 (26.1%) | 4 (8.3%) | 2 (3.7%) | 4 (20.0%) | 4 (21.1%) | 26 (13.8%) | |
| WEOG | 18 (39.1%) | 8 (16.7%) | 10 (18.5%) | 10 (50.0%) | 9 (47.4%) | 55 (29.1%) | |
| Period | |||||||
| 1985–1989 | 4 (8.7%) | 2 (4.2%) | 5 (9.3%) | 3 (15.0%) | 2 (10.5%) | 16 (8.5%) | |
| 1990–1994 | 4 (8.7%) | 3 (6.3%) | 8 (14.8%) | 3 (15.0%) | 1 (5.3%) | 19 (10.1%) | |
| 2000–2004 | 7 (15.2%) | 8 (16.7%) | 6 (11.1%) | 3 (15.0%) | 2 (10.5%) | 1 (50.0%) | 27 (14.3%) |
| 2005–2009 | 7 (15.2%) | 7 (14.6%) | 16 (29.6%) | 4 (21.1%) | 1 (50.0%) | 35 (18.5%) | |
| 2010–2014 | 13 (28.3%) | 12 (25.0%) | 8 (14.8%) | 2 (10.0%) | 6 (31.6%) | 41 (21.7%) | |
| 2015–2019 | 11 (23.9%) | 15 (31.9%) | 12 (21.8%) | 9 (45.0%) | 4 (21.1%) | 51 (27.0%) | |
2.4. Assessment and Visualization
Mathematical operations, time trends, and visualization were performed using R packages (R version 4.2.2) with R Studio (release for Windows, 2022.12.0 Build 353, Posit Software PBC).
In order to show if values decreased or increased over the metadata, trendlines were computed using R and the ggplot2 package. For the trendlines, a refined (smoothing) generalized additive model (GAM) was used to fit the trendline (smoothing function) according to formula = y ∼ s(x). In the model, missing values were removed (na.rm = TRUE). For each year, the following values were calculated and used in the model: median, 10th percentile, 90th percentile.
Correlations were assessed using the Pearson method to determine the closeness of association in a scatter plot. The Kruskal–Wallis test, a nonparametric rank-based test, was used to determine if there were statistically significant differences between two or more groups of independent variables. In a second step, a pairwise comparison between two features was done using the Benjamini Hochberg method for p-value adjustment. Principal component analysis (PCA) was applied to reduce the multicomponent room to a 2-dimension projection by creating new components through linear transformation.34
All values for correlations or significance were set p ≤ 0.05.
3. Results
3.1. Characterization and Distribution of National Pools
In total, 3345 data points were assessed in 189 samples for 28 POPs (note: PCB is counted twice as is defined as PCB6 and dl-PCB with no overlap of congeners). Most values were available for PCDD and PCDF (N = 185), 166 for dl-PCB, and least number of pools had been analyzed for PBDE 209 (N = 39), chlordecone (N = 43), and HCBD (N = 44).
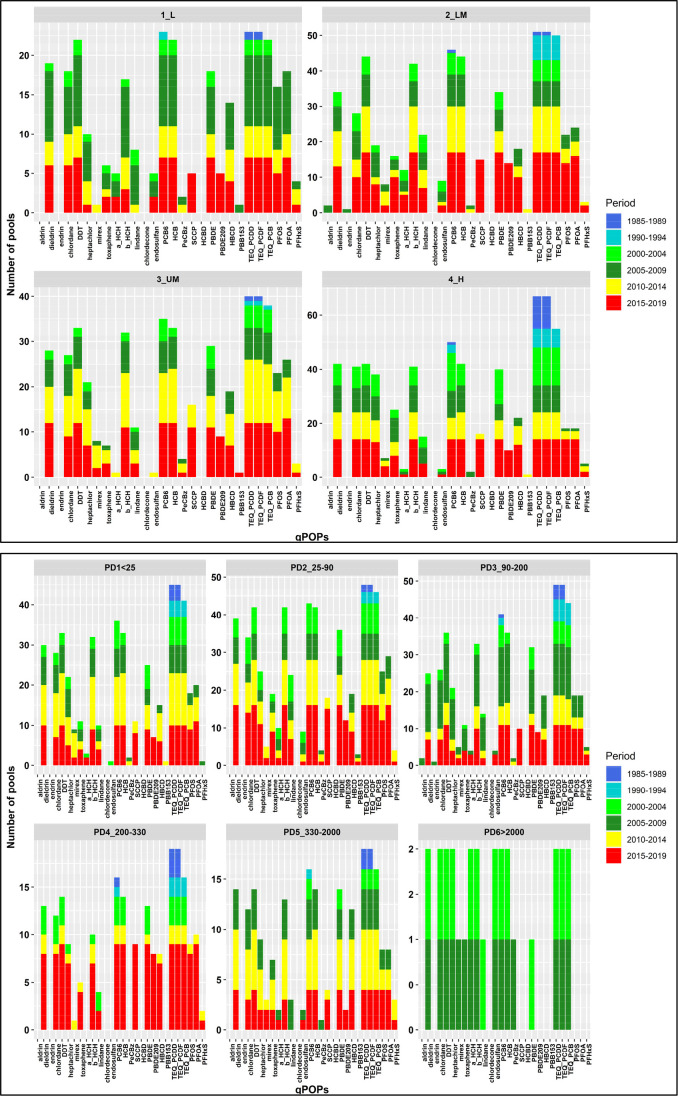
The detection frequency of POPs in the national pools varied largely: For 30% of the results (N = 1 279), the values were below the limit of quantification (LOQ). Details from Table 3 show that 100% detection frequency with quantifiable amounts were obtained for DDT, PCB6, HCB, SCCP, PCDD, PCDF, and PFOA. Only 1% detection frequency was found for aldrin and endrin (corresponding to two or one national pools, respectively). These samples were from the period 2005–2009 and countries with a lower-middle (LM) income (green bars, Figure 1) and a population density between 90 inhabitants/km2 and 330 inhabitants/km2 (skyblue bars, Figure 1). For PBB153 the frequency was 4% (N = 4). Chlordecone and HCBD were not quantified in any sample; therefore, there are no bars in Figure 1 for these two POPs.
Table 3. Number of National Pools by POP Analyzed and Detection Frequency.
| POP | aldrin | dieldrin | endrin | chlordane | DDT | heptachlor | mirex | toxaphene |
|---|---|---|---|---|---|---|---|---|
| No. of pools | 141 | 141 | 141 | 141 | 141 | 141 | 123 | 139 |
| No. of pools > LOQ | 2 | 123 | 1 | 114 | 141 | 88 | 24 | 54 |
| % quantified | 1% | 87% | 1% | 81% | 100% | 62% | 20% | 39% |
| POP | α-HCH | β-HCH | lindane | chlordecone | endosulfan | PCB6 | HCB | PeCBz | SCCP | HCBD |
|---|---|---|---|---|---|---|---|---|---|---|
| No. of pools | 138 | 138 | 138 | 43 | 139 | 154 | 141 | 102 | 52 | 44 |
| No. of pools > LOQ | 21 | 132 | 56 | 18 | 154 | 141 | 10 | 52 | ||
| % quantified | 15% | 96% | 41% | 0% | 13% | 100% | 100% | 10% | 100% | 0% |
| POP | PBDE | PBDE209 | HBCD | PBB153 | TEQ_PCDD | TEQ_PCDF | TEQ_PCB | PFOS | PFOA | PFHxS |
|---|---|---|---|---|---|---|---|---|---|---|
| No. of pools | 123 | 39 | 99 | 101 | 181 | 181 | 166 | 86 | 86 | 86 |
| No. of pools > LOQ | 121 | 38 | 73 | 4 | 181 | 181 | 165 | 79 | 86 | 15 |
| % quantified | 98% | 97% | 74% | 4% | 100% | 100% | 99% | 92% | 100% | 17% |
Figure 1.
Number of quantified POPs in national pools grouped in each category of WBC (upper graph) and PD_Code (lower graph); both colored by period.
Figure 1 provides a 2-dimensional picture of the number of each POP (on x-axis) quantified according to the WBC and PD_Code groups colored by the period when the sample was collected (and analyzed). It can be seen that PCDD and PCDF were the only POPs that were analyzed in the first and second periods (blue and light blue colors) whereas SCCP and PFHxS were analyzed only recently (red color). With respect to population density, there were only two samples from Hongkong during two periods (green and forestgreen colors as the most densely populated country group (PD > 2000); not all the newly listed POPs were analyzed at these periods. In general, samples were less from more densely populated countries. The graphics for each POP are shown in Figure S1 for WBC and Figure S2 for PD_Code.
3.2. Income and Population Density as Indicators for Amounts of Contaminants
The descriptive statistics of all measured POPs grouped according to the income, expressed as WBC, are contained in the Supporting Information in Table S3 and Figure S1; population density, shown as PD_Code, is in Table S4 and Figure S2. Amounts are given in units of ng/g lipid for most POPs, pg TEQ/g lipid for dl-POPs, and pg/g f.w. for PFAS.
3.2.1. Income
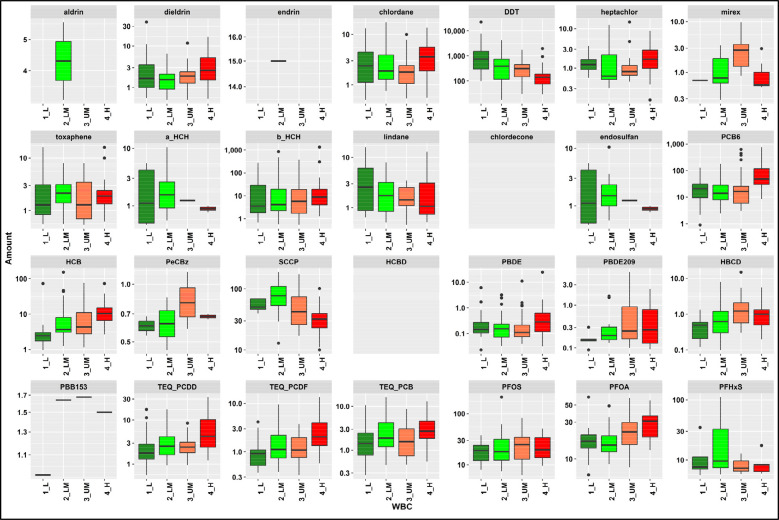
Without specification of the sampling year but adjustment of the WBC classification to the year of the sampling, it can be seen that not only PFOA but also the dl-POPs, PCB6, and HBCD tend to have higher amounts of the respective POP in countries with higher income, Figure 2. For DDT, not only the highest amounts were found but also they decrease with increasing income. Thus, DDT concentrations in human milk discriminate toward poorer countries. For SCCP, the median value peaks in the lower-middle income countries and then decreases with increasing income. The logarithmic box whisker plots do not show that high values for POPs pesticides are associated with lower income countries. Interestingly, legacy POPs such as dieldrin and chlordane had the highest median value in the high income group. From these data, we cannot conclude if POP chemicals were first present in industrialized wealthier countries with potential production and first uses of these chemicals as for the newly listed POPs or if they had a long application history such as DDT to fight mosquitoes since no alternatives were available (Annex B POP).
Figure 2.
Scaled box plots by POP and WBC, logarithmic scale for amounts. The whiskers represent the minimum and maximum amounts without outliers. The lower border of the box represents the first quartile (25%), the line inside the box is the median, and the upper border is the third quartile (75%). The dots outside the whiskers are outliers, which were defined as all concentrations greater or smaller than the interquartile range multiplied by 1.5.
The trend analysis applied the gam model, and three trends could be seen, as shown in Figure 3. General observations include the following: (a) SCCP shows a decreasing trend with increasing income (Figure 3 above left), (b) heptachlor (Figure 3 above right), dl-PCB, and HBCD (see Figure S3) show an increase with increasing income, and finally (c) PCB6 exhibits an unclear trend with first increasing and then decreasing values (Figure 3 below).
Figure 3.
Global trendline GNI PPP for selected POPs in human milk. SCCP with declining trend, heptachlor with increasing trend, and PCB6 with no clear trend. GNI per capita in USD PPP on the x-axis.
3.2.2. Population Density
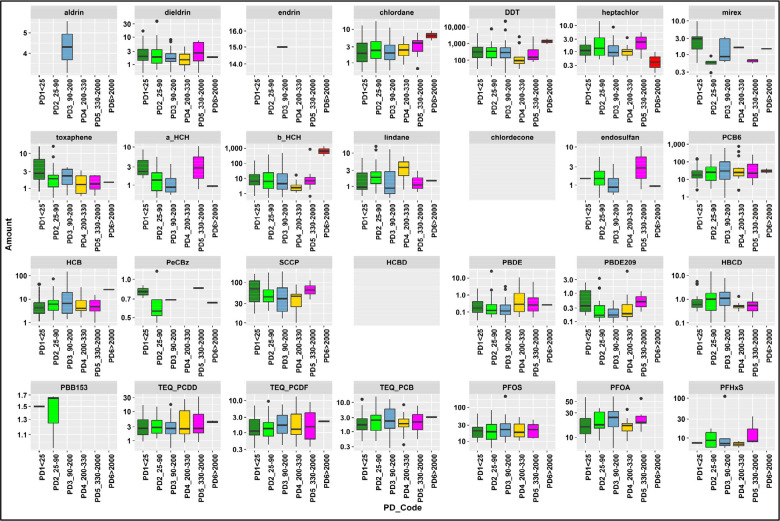
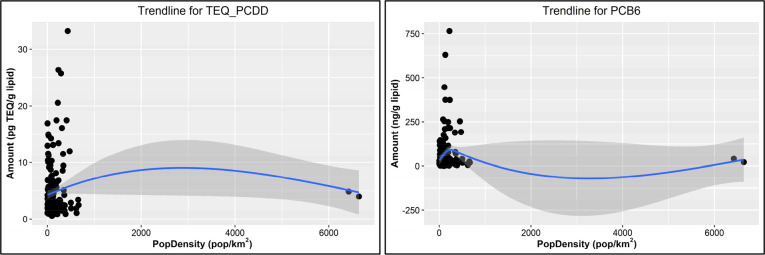
The amounts of POPs in the national pools grouped according to the six population density codes (PD_Codes) are shown in Figure 4. It is evident that for none of the POPs is there a preference for either densely or poorly populated countries. For many POPs and PD_Codes, the median values were zero; but ranges across all PD_Codes were seen for chlordane, toxaphene, lindane, SCCP, the dl-POPs, and PFOA. Visualization of global trends by population density did not result in reasonable data since the measurements from Hong Kong gave a population density of >6000 inhabitants per km2, which was far above all other countries (Figure 5).
Figure 4.
Scaled box plots by POP and PD_Code, logarithmic scale for amounts. The whiskers represent the minimum and maximum amounts without outliers. The lower border of the box represents the first quartile (25%), the line inside the box is the median, and the upper border is the third quartile (75%). The dots outside the whiskers are outliers, which were defined as all concentrations greater or smaller than the interquartile range multiplied by 1.5.
Figure 5.
Global trendline of PopDensity for selected POPs in human milk. PCDD and PCB6 with no trend, SCCP with. Population per km2 on the x-axis.
Statistically, between PD_Codes only the OCPs were significantly different with a p = 0.02. For the pairwise assessment, only the Hong Kong samples (PD > 2000) were significantly different from PD_90–200 and PD_200–330 (p = 0.046 for both). For the other POPs groups the p-values were very high, between p = 0.42 and p = 0.85.
3.3. Adjustments to Years of Measurement
3.3.1. Income Adjusted to Year
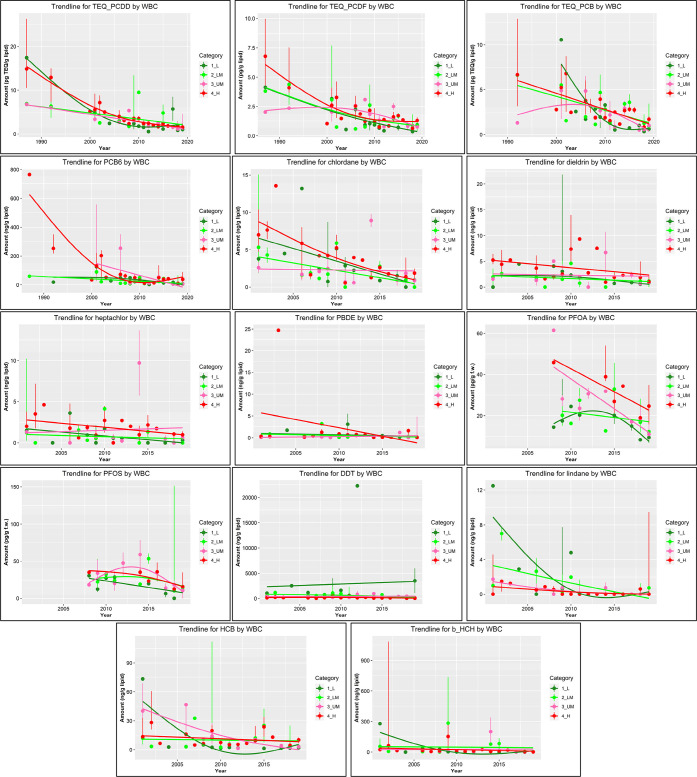
Time, defined as sampling year, seems to be the best indicator to be combined with WBC (Figure 6). The upper part of Figure 6 depicts the longest timespan for the dl-POPs and PCB6. Decreasing trends can be seen for the four dl-POPs and, for most of the high-income group, are associated with the highest values. However, for PCDD, the most recent outliers are associated with the low and the lower-middle group (1_L and 2_LM). For PCDF, dl-PCB, and the indicator PCB, the picture is more complex and the outliers in recent years have been found in the wealthier countries. For PCB6, there is even an increasing trend observed for the last years, but the values are close together. The complex picture may be caused by the ubiquitous nature of these chemicals, independent of geographic location or the presence/absence of sources, and the attribution of the national pools at the different time periods.
Figure 6.
Time trend by year for WBC category: Selected POPs in human milk Top: POPs where H and UM countries have highest amounts Middle: DDT and heptachlor where lower income countries have highest amounts. Bottom: no clear tendency: H and L countries next to each other.
For all other POPs, there were no data from the 1980s and 1990s, so that the time series did not start before the year 2000; for some POPs, there are measurements available for only 10–12 years. Chlordane (see also Figure 2), dieldrin, heptachlor, and PBDE as well as PFOS and PFOA also had the highest values associated with the high-income group and decreasing time trends. For PFOA, it must be noted that the two lower income groups did not follow the downward trend.
The two OCPs, DDT and lindane, had the highest values in countries with lower income, whereas for lindane a downward trend can be seen, and the values level off. For DDT, there is a slight upward trend, triggered by the extreme value in Ethiopia in 2012 for a low-income country). No correlation among the amount of POP in breast milk, year, and income was found for HCB or β-HCH where outliers dominated.
3.3.2. Population Density Adjusted to Year
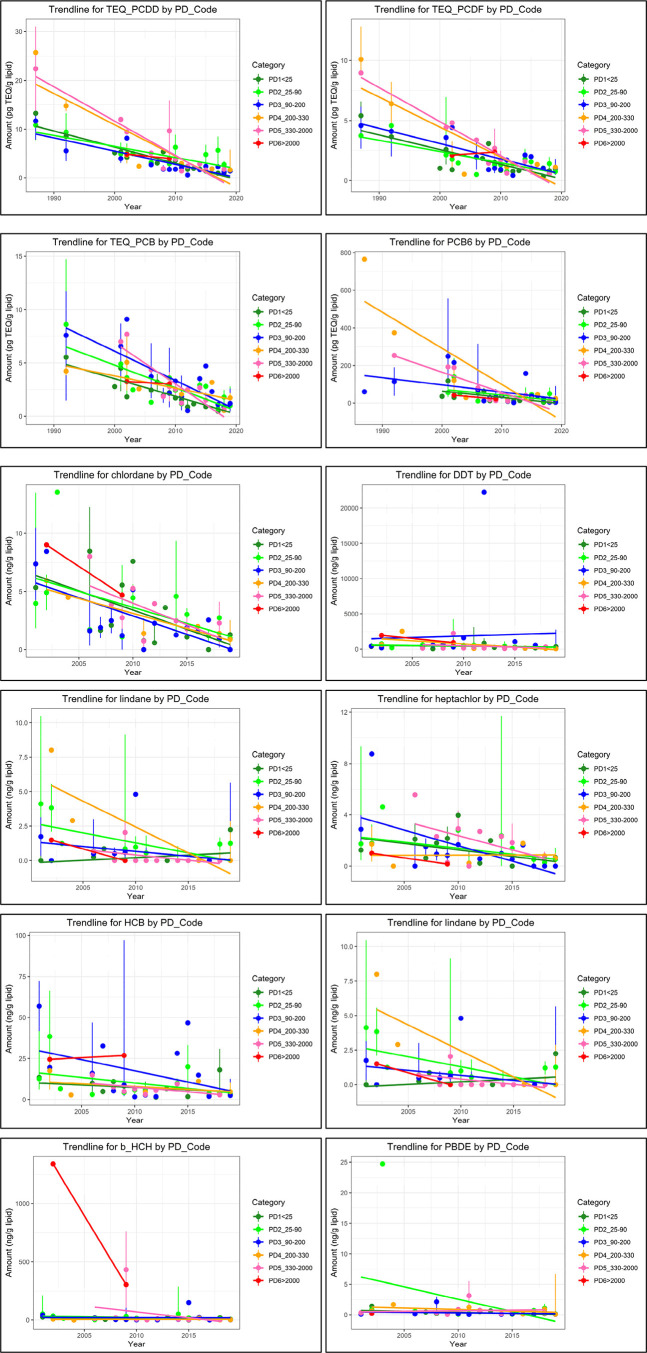
Figure 7 shows the time trends within the various PD_Codes. Most POPs exhibited decreases over time independently at all population densities, as shown for the dl-POPs and chlordane. An opposite trend is seen for DDT, where no decline could be seen, neither in densely nor in scarcely populated countries. HCB and PBDE did not show a clear picture.
Figure 7.
Time trend by year for population density category: Selected POPs in human milk.
For the PCDD and PCDF, the highest values were associated with the most densely populated countries, PD5_330–2000 and PD4_200–330. For dl-PCB, PD3_90–200 had the highest values. It is interesting/surprising that the industrial chemical PBDE, used indoors, is low in densely populated countries.
4. Discussion
Assessing the quantitative results and the metadata, some interesting findings were made. The paper by Fiedler et al.16 found regional differences for certain POPs, but in general, it was concluded that the time of the sampling had the strongest impact on the scale of the POPs in human milk, stronger than the geography. Here we assessed the metadata with the results of the Kruskal–Wallis ranking test and the pairwise comparison detailed in the Supporting Information, section 2.1.
4.1.1. Human Milk POPs Amounts by Year
Our data showed that the year, when the national pool was created and analyzed, was the important factor as to the characterization of the national pools concerning the amounts of POPs: Significant differences for the amounts of various POPs quantified in the national pools were shown for the OCPs (p = 4.2 × 10⁻⁷), industrial POPs (p = 1.5 × 10⁻¹²), dl-POPs (p ≤ 2.2 × 10⁻¹⁶), and PFAS (p = 0.004) but not for BFRs (p = 0.07). There were not sufficient pools for pairwise assessment within the OCPs and PFAS. For industrial POPs (indPOPs), there were 36 pairs having significant differences. These occurred mainly in the years 2001 and 2002 (N = 11 and N = 8, respectively) but not in 1987 when only PCB6 was measured. For dl-POPs, pairwise assessment gave 93 pairs having significant differences. These differences were associated especially with the early years, which were significantly different from other years. With increasing years, the number of significantly different p-values decreased, e.g., for 1987, all p-values were <0.05 (N = 20), for 1992, there were 17 p-values <0.05, 14 for 2001, and only eight for 2002. For the more recent years, there were only few significant differences (see Supporting Information, section 2.1.1).
With respect to income, significant differences were found for OCPs (p = 0.006), indPOPs (p = 0.0008), and dl-POPs (p = 1.8 × 10⁻¹⁴) but not for the two groups where samples were available only from the year 2000, BFRs (p = 0.069) and PFAS (p = 0.18). The pairwise assessment for OCPs, indPOPs, and dl-POPs showed that all pools belonging to the high-income group (H) were significantly different from L, LM, and UM. For the dl-POPs, the low-income group pools were significantly different from the LM group (p = 0.0035). The p-values are contained in the Supporting Information in section 2.1.2. As could be seen from the trends in Figure 6 and Figure 7, there were hardly any differences between the countries, be WBC or PD_Code, for the most recent sampling period.
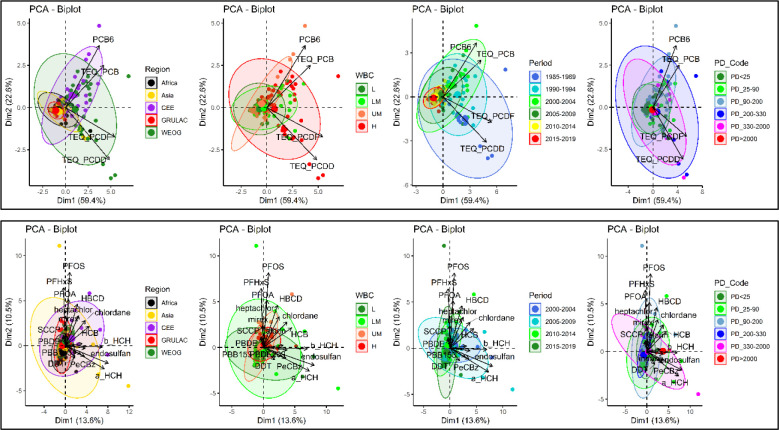
Finally, the following Figure 8 depicts the PCAs for the four POPs analyzed since the 1980s and other POPs since the 2000s. For dl-POPs and PCB6 the PCA in its first dimensions explained 80% of the variance. The two PCBs, dl-PCB and TEQ, and indicator PCB as PCB6 are located in the first quartile, indicating commonalities. PCDD and PCDF are in the fourth quartile, indicating positive correlation with dl-PCB and PCB6 as to the scale along Dim1 (x-axis) but also negative correlations. As to regional occurrence, WEOG had the largest concentration ellipse whereas the ellipse for CEE is very narrow and toward large amounts caused by the PCB. Similarly, the oldest period (blue ellipse) had the largest variation in concentrations whereas the small red ellipse for the most recent sampling period is centered around the origin, indicating that nowadays the amounts of PCDD, PCDF, dl-PCB, and PCB are low.
Figure 8.
Time trend by year for population density category: Selected POPs in human milk.
A different picture is obtained for the other POPs, measured since the year 2000 (or later). The PCA explains only 24%. It can be seen that the x-axis with positive values (high concentrations) is dominated by α-HCH, β-HCH, and endosulfan, whereas the second dimension is dominated by PFOS, PFHxS, and PFOA. Interestingly, although by far the highest amounts in all measurement periods, DDT is not a strong discriminating feature. Interpretation of the ellipses as to income (WBC) may conclude that for the OPCs, ind.POPs, BFRs, and PFAS together, some POPs had the highest concentrations in low-income and lower-middle income countries.
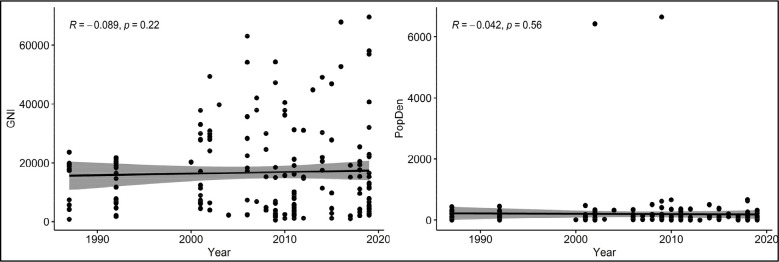
The interpretation of our data, and especially the trend analysis and use of metadata, must be done carefully. The correlation between income and population density historically did not show any trend, for GNI R = 0.089 and for population density R = −0.042. More important may be that the correlations are extremely weak (p = 0.22 and p = 0.56, respectively), which means that over time richer countries became richer and poorer countries poorer in relation to each other (Figure 9). In absolute values, the global development (as World) showed a strongly increasing (linear) trend as to the GNI PPP per capita from USD 5 470 in 1990 to USD 17 009 in 2020. The significance of this trend had R2 = 0.98 (R2 = goodness-to-fit).
Figure 9.
Historic development of income (as GNI in USD PPP) and population density (pop/km2) in the counties that provided national pools; Pearson correlation.
An assessment of linear correlations between POP, time, GNI or population density is summarized in the Supporting Information as follows: Figure S4 shows four POPs, PCDD, PCDF, dl-PCB, and PCB6, exhibiting moderate negative but significant correlation between POP and time, thus confirming downward trends toward recent years. Small upward trends for increasing GNI were only significant for PCB6. The vast majority of the POPs exhibited either very weak downward or no Pearson correlation toward more recent years (Figure S4). The small decrease for SCCP for increasing GNI and the increase for PFOA were significant. Finally, Figure S5 contains three POP, SCCP, PBDE209, and PFHxS, where small increasing but not significant correlations were found for time and a very weak decreasing correlation was found for increasing incomes.
5. Conclusion
In summary, the graphics in Figure 6 demonstrate that the wide ranges found at the earlier stages of the human milk monitoring or at the start of the time series for a given POP were no longer present in the most recent samples. This shows that when POPs are present, they are at the same levels across the income groups. Thus, the POPs do not discriminate between poorer or wealthier populations. On the global level, this would result in the fact that in future biomonitoring surveys, similar amounts of the same POP would be found in the breast milk of all donor mothers, independently of the geography, income, or population density. Such even distribution may be the result of globalization and ubiquitous long-range pollutant transport, which can be postulated especially for PCDD, PCDF, and PCB. For other POPs, the application and, thus, nearby sources may play a more important role and would need to assess other indicators such as the main economies of a country or donor mothers as well as educational status or occupation. At present and for the national pools, these are excluded since the donor mothers should have had “no known exposure to POPs”.
Globalization would mainly refer to relevant food groups as the major pathways for body burden. Such a question cannot be answered by analyzing national pools since, in these samples, a representative number of mothers are aggregated into one sample, making the analysis cost-efficient by reducing the sample number, but on the other hand, information such as the distribution within the pool is lost. Recent results from the global monitoring plan have shown that the generally consumed foodstuffs have quite low concentrations of PFAS and dl-POPs.35,36 Analyzing several hundred foodstuffs, exceptionally high values were hardly encountered but may be found when targeting environmental hotspots, such as sediments and effluents for aquatic foodstuffs, contaminated soil or ambient air pollution. For the latter ones, local sources rather than long-range transport may be responsible for elevated levels.37−39 For all three environmental compartments, the transfer from the environmental matrix to foodstuff should be minimized by restriction of land or water use and regulation of agricultural use.
Acknowledgments
The samplings at the national level to create the national pools were approved by national procedures such as endorsement by the ethics committee, following WHO recommendations. I thank Dr. Victor H. Estellano Schulze, consultant at the Chemicals and Health Branch of UNEP for advice on graphical representation. Many thanks go to Dr. Dirk Repsilber, School of Medical Sciences of Örebro University, for assistance with the application of R and interpretation in bioinformatics.
Supporting Information Available
The Supporting Information is available free of charge at https://pubs.acs.org/doi/10.1021/envhealth.3c00020.
Assignment of WBC and population density to the national pools, descriptive statistics for the measured POPs as summary of quantitative data, and correlations for all POPs (PDF)
The author declares no competing financial interest.
Supplementary Material
References
- IARC. Polychlorinated Biphenyls and Polybrominated Biphenyls. IARC Monographs on the Evaluation of Carcinogenic Risks to Humans, 2015, ed.; International Agency for Research on Cancer: Lyon, France, 2015; Vol. 107, 510 pp. Available from: http://monographs.iarc.fr/ENG/Monographs/vol107/mono107.pdf. [PMC free article] [PubMed]
- Lauby-Secretan B.; Loomis D.; Grosse Y.; Ghissassi F. E.; Bouvard V.; Benbrahim-Tallaa L.; Guha N.; Baan R.; Mattock H.; Straif K. Carcinogenicity of polychlorinated biphenyls and polybrominated biphenyls. Lancet Oncology 2013, 14 (4), 287–288. 10.1016/S1470-2045(13)70104-9. [DOI] [PubMed] [Google Scholar]
- IARC. DDT, Lindane and 2,4-D. IARC Monographs on the Evaluation of Carcinogenic Risks to Humans, 2016 ed.; International Agency for Research on Cancer: Lyon, France, 2016; Vol. 113. Available from: http://monographs.iarc.fr/ENG/Monographs/vol113/mono113.pdf.
- IARC. Pentachlorophenol and Some Related Compounds. IARC Monographs on the Evaluation of Carcinogenic Risks to Humans Volume, 2019 ed.; International Agency for Research on Cancer: Lyon, France, 2019; Vol. 117. Available from: https://publications.iarc.fr/574.
- IARC. Polychlorinated Dibenzo-para-dioxins and Polychlorinated Dibenzofurans. IARC Monographs on the Evaluation of Carcinogenic Risks to Humans, 1997 ed.; International Agency for Research on Cancer: Lyon, France, 1997; Vol. 69, 687 pp. Available from: http://monographs.iarc.fr/ENG/Monographs/vol69/mono69.pdf. [PMC free article] [PubMed]
- IARC. Chemical Agents and Related Occupations. IARC Monographs on the Evaluation of Carcinogenic Risks to Humans, 2012 ed.; International Agency for Research on Cancer: Lyon, France, 2012; Vol. 100F. Available from: http://monographs.iarc.fr/ENG/Monographs/vol100F/mono100F.pdf. [PMC free article] [PubMed]
- IARC. Agents Classified by the IARC Monographs; International Agency for Research on Cancer: Lyon, France, 2022; Vols. 1–132.
- WHO. Human biomonitoring: facts and figures; World Health Organization. Regional Office for Europe: Copenhagen, 2015; https://apps.who.int/iris/handle/10665/164588.
- CDC NCHS . National Report on Human Exposure to Environmental Chemicals; CDC, 2022. Page last reviewed: March 24, 2022. Available from: https://www.cdc.gov/exposurereport/index.html.
- Beck H.; Dross A.; Mathar W. PCDD and PCDF exposure and levels in humans in Germany. Environ. Health Perspect. 1994, 102, 173–185. 10.1289/ehp.94102s1173. [DOI] [PMC free article] [PubMed] [Google Scholar]
- UNEP. Human exposure to POPs across the globe: POPs Levels and human health implications; UNEP, 2013; p 42; http://www.brsmeas.org/Decisionmaking/COPsandExCOPs/2013COPsExCOPs/Documents/tabid/2915/ctl/Download/mid/9703/language/fr-CH/Default.aspx?id=85&ObjID=16190; Results of the WHO/UNEP human milk survey.
- UNEP. Global monitoring plan for persistent organic pollutants under the Stockholm Convention Article 16 on the effectiveness evaluation - Third global monitoring report. Draft of April 2022; United Nations Environment Programme (UNEP): Geneva, Switzerland, 2022; 149 pp; http://chm.pops.int/Implementation/EffectivenessEvaluation/EEMeetings/EEC1Meeting2022/tabid/9116/Default.aspx.
- UNEP. Global monitoring plan on persistent organic pollutants. Guidelines for organization, sampling and analysis of human milk on persistent organic pollutants; Chemicals and Health Branch, Economy Division; United Nations Environment Programme (UNEP), 2017.
- WHO. Guidelines for developing a national protocol - Fourth WHO-coordinated survey of human milk for persistent organic pollutants in cooperation with UNEP; World Health Organization: Geneva, Switzerland, 2007; 43 pp.
- van den Berg M.; Kypke K.; Kotz A.; Tritscher A.; Lee S. Y.; Magulova K.; Fiedler H.; Malisch R. WHO/UNEP global surveys of PCDDs, PCDFs, PCBs and DDTs in human milk and benefit-risk evaluation of breastfeeding. Arch. Toxicol. 2017, 91 (1), 83–96. 10.1007/s00204-016-1802-z. [DOI] [PMC free article] [PubMed] [Google Scholar]
- Fiedler H.; Li X.; Zhang J. Persistent organic pollutants in human milk from primiparae - correlations, global, regional, and national time-trends. Chemosphere 2023, 313, 137484. 10.1016/j.chemosphere.2022.137484. [DOI] [PubMed] [Google Scholar]
- Fiedler H.; Sadia M.; Krauss T.; Baabish A.; Yeung L. W. Y. Perfluoroalkane acids in human milk under the global monitoring plan of the Stockholm Convention on Persistent Organic Pollutants (2008–2019). Frontiers of Environmental Science & Engineering 2022, 16 (10), 132. 10.1007/s11783-022-1541-8. [DOI] [Google Scholar]
- Fiedler H.; Li X.; Zhang J. Dioxin-like compounds in human milk – A time-trend analysis. Organohalogen Compd. 2022, 83, 191–194. [Google Scholar]
- WHO EURO. Levels of PCBs, PCDDs and PCDFs in human milk: Second round of WHO-coordinated exposure study; WHO, 1996; 92 pp.
- Yrjanheikki E.Levels of PCBs, PCDDs and PCDFs in breast milk. Results of WHO-coordinated interlaboratory quality control studies and analytical studies; Environmental health series; FADL, 1989; No. 34, pp 1–92.
- UNEP;, Malisch K.; Fiedler H.. UNEP-coordinated survey of mothers’ milk for persistent organic pollutants - Guidelines for organization, sampling and analysis, 2012. Chemicals and Health Branch, Economy Division; United Nations Environment Programme (UNEP): Geneva, Switzerland, 2012.
- Li J.; Zhang L.; Wu Y.; Liu Y.; Zhou P.; Wen S.; Liu J.; Zhao Y.; Li X. A national survey of polychlorinated dioxins, furans (PCDD/Fs) and dioxin-like polychlorinated biphenyls (dl-PCBs) in human milk in China. Chemosphere 2009, 75 (9), 1236–42. 10.1016/j.chemosphere.2009.01.073. [DOI] [PubMed] [Google Scholar]
- Zhou P.; Wu Y.; Yin S.; Li J.; Zhao Y.; Zhang L.; Chen H.; Liu Y.; Yang X.; Li X. National survey of the levels of persistent organochlorine pesticides in the breast milk of mothers in China. Environ. Pollut. 2011, 159 (2), 524–31. 10.1016/j.envpol.2010.10.014. [DOI] [PubMed] [Google Scholar]
- UNEP. Guidance on the global monitoring plan for persistent organic pollutants; United Nations Environment Programme (UNEP): Geneva, Switzerland, 2021; 149 pp; http://www.brsmeas.org/2021COPs/MeetingDocuments/tabid/8810/language/en-US/Default.aspx.
- UNEP. Procedure for the analysis of persistent organic pollutants in environmental and human matrices to implement the global monitoring plan under the Stockholm Convention. Protocol 1: The analysis of perfluorooctane sulfonic acid (PFOS) in water and perfluorooctane sulfonamide (FOSA) in mothers’ milk, human serum and air, and the analysis of some perfluorooctane sulfonamides (FOSAs) and perfluorooctane sulfonamido ethanols (FOSEs) in air; Chemicals Branch United Nations Environment Programme (UNEP) Division of Technology, Industry and Economics, 2015.
- UNEP. Procedure for the analysis of persistent organic pollutants in environmental and human matrices to implement the global monitoring plan under the Stockholm Convention. Protocol 3: Protocol for the analysis of polybrominated diphenyl ethers (PBDE) in human milk, air and human serum; Chemicals Branch United Nations Environment Programme (UNEP) Division of Technology, Industry and Economics, 2015.
- UNEP. Procedure for the analysis of persistent organic pollutants in environmental and human matrices to implement the global monitoring plan under the Stockholm Convention. Protocol 2: Protocol for the analysis of polychlorinated biphenyls (PCB) and organochlorine pesticides (OCP) in human milk, air and human serum, Chemicals Branch United Nations Environment Programme (UNEP) Division of Technology, Industry and Economics, 2014.
- van den Berg M.; Birnbaum L. S.; Denison M.; De Vito M.; Farland W.; Feeley M.; Fiedler H.; Hakansson H.; Hanberg A.; Haws L.; Rose M.; Safe S.; Schrenk D.; Tohyama C.; Tritscher A.; Tuomisto J.; Tysklind M.; Walker N.; Peterson R. E. The 2005 World Health Organization reevaluation of human and mammalian toxic equivalency factors for dioxins and dioxin-like compounds. Toxicol. Sci. 2006, 93 (2), 223–41. 10.1093/toxsci/kfl055. [DOI] [PMC free article] [PubMed] [Google Scholar]
- United Nations (UN) . Regional groups of Member States; UN, 2023. Available from: https://www.un.org/dgacm/en/content/regional-groups.
- ISO. ISO 3166 - Country Codes, 2020. International Organization for Standardization, Chemin de Blandonnet 8, CP 401, 1214 Vernier, GE, Switzerland. 2020.
- World Bank . Population density (people per sq. km of land area); World Bank, 2022.
- World Bank . GNI per capita, Atlas method (current US$); World Bank, 2022.
- World Bank. World Bank Open Data Catalog. Data catalog2022; The World Bank Group, 2022.
- STHDA . Articles - Principal component methods in R: Practical guide. PCA - Principal component analysis essentials; STHDA, 2017; accessed 2023-02-27. Available from: http://www.sthda.com/english/articles/31-principal-component-methods-in-r-practical-guide/112-pca-principal-component-analysis-essentials/.
- Fiedler H.; Abalos M.; Parera J.; Abad E.; Lohmann N.; Neugebauer F.; Rottler H.; Horstmann M. Dioxin-like POPs in national samples from global monitoring plan projects (2017–2019). Chemosphere 2023, 325, 138386. 10.1016/j.chemosphere.2023.138386. [DOI] [PubMed] [Google Scholar]
- Fiedler H.; Sadia M.; Baabish A.; Sobhanei S. Perfluoroalkane substances in national samples from global monitoring plan projects (2017–2019). Chemosphere 2022, 307, 136038. 10.1016/j.chemosphere.2022.136038. [DOI] [PubMed] [Google Scholar]
- Abad E.; Abalos M.; Fiedler H. Air monitoring with passive samplers for dioxin-like persistent organic pollutants in developing countries (2017–2019). Chemosphere 2022, 287, 131931. 10.1016/j.chemosphere.2021.131931. [DOI] [PubMed] [Google Scholar]
- Camoiras Gonzalez P.; Sadia M.; Baabish A.; Sobhanei S.; Fiedler H. Air monitoring with passive samplers for perfluoroalkane substances in developing countries (2017–2019). Chemosphere 2021, 282, 131069. 10.1016/j.chemosphere.2021.131069. [DOI] [PubMed] [Google Scholar]
- de Boer J.; van Dijk R.; Abalos M.; Abad E. Persistent organic pollutants in air from Asia, Africa, Latin America, and the Pacific. Chemosphere 2023, 324, 138271. 10.1016/j.chemosphere.2023.138271. [DOI] [PubMed] [Google Scholar]
Associated Data
This section collects any data citations, data availability statements, or supplementary materials included in this article.


