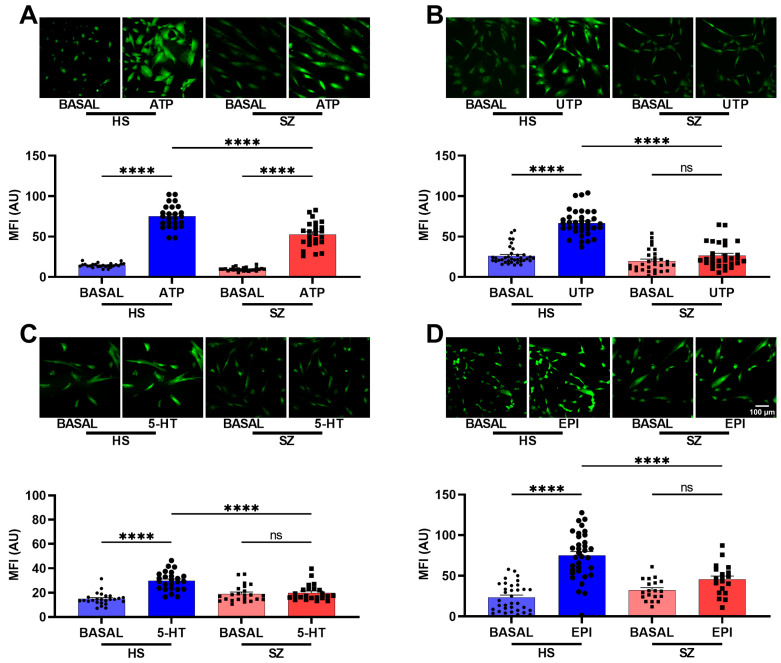
Figure 3.
Intracellular calcium response after stimulation with Gq-coupled agonists in olfactory epithelial cell populations of HS and patients with SZ. The cells were incubated for 30 min with 4 μM Fluo 4-AM diluted in the culture medium at 37 °C and 5% CO2. Images were captured before stimulation (basal) and 2 min after stimulation with either 300 μM ATP (A), 300 μM UTP (B), 10 μM serotonin (C), and 10 μM epinephrine (D) in HS-derived cells and SZ patient-derived cells. The graphs represent data obtained from at least 18 images (18–20 cells per image) per group. Data were expressed as mean ± SEM and compared using Brown–Forsythe one-way analysis of variance (ANOVA) and Dunnett’s multiple comparison test, **** p < 0.0001. ns: not significant. Mean fluorescence intensity (MFI), arbitrary units (AU).

