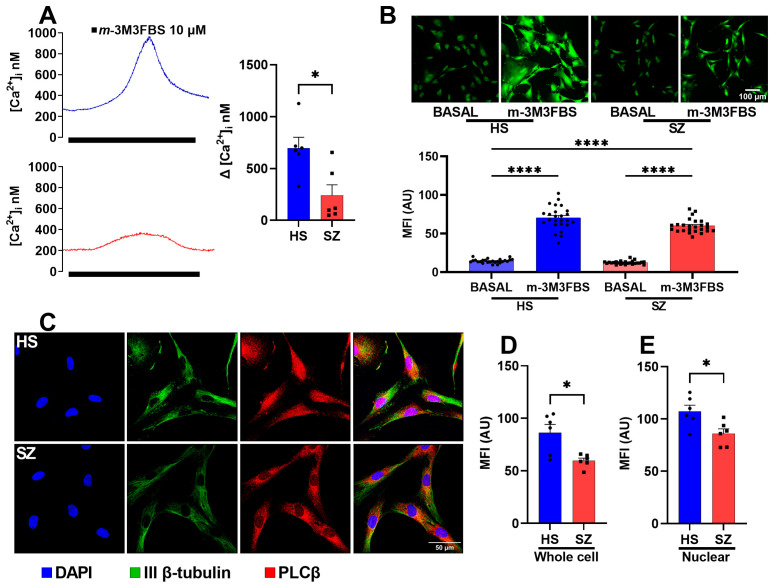
Figure 6.
Cytosolic increase in Ca2+ after direct PLCβ stimulation and the amount of PLCβ protein in cultured cells from HS and patients with SZ. (A) Microfluorometric detection of changes in intracellular Ca2+ concentration ([Ca2+]i) induced by 10 µM m-3M3FBS. (B) Calcium images were captured before stimulation (basal) and 30 s after direct PLCβ stimulation (10 µM m-3M3FBS). (C) Immunofluorescent detection of PLCβ1 and 3; the panel shows representative images from cells detected by confocal microscopy. Neuronal-specific human IIIβ-tubulin (green) and PLCβ1 and 3 (red) were detected in the cells. Nuclei were counterstained with DAPI (blue). The mean fluorescence intensity of the whole cells (D) and of the nuclear zone (E) were compared. Data were expressed as mean ± SEM and compared using the Student’s t-test with Welch’s correction for panels (A,D,E) (* p < 0.05) or with one-way ANOVA and Tukey’s multiple comparisons test for panel (B) (**** p < 0.0001).

