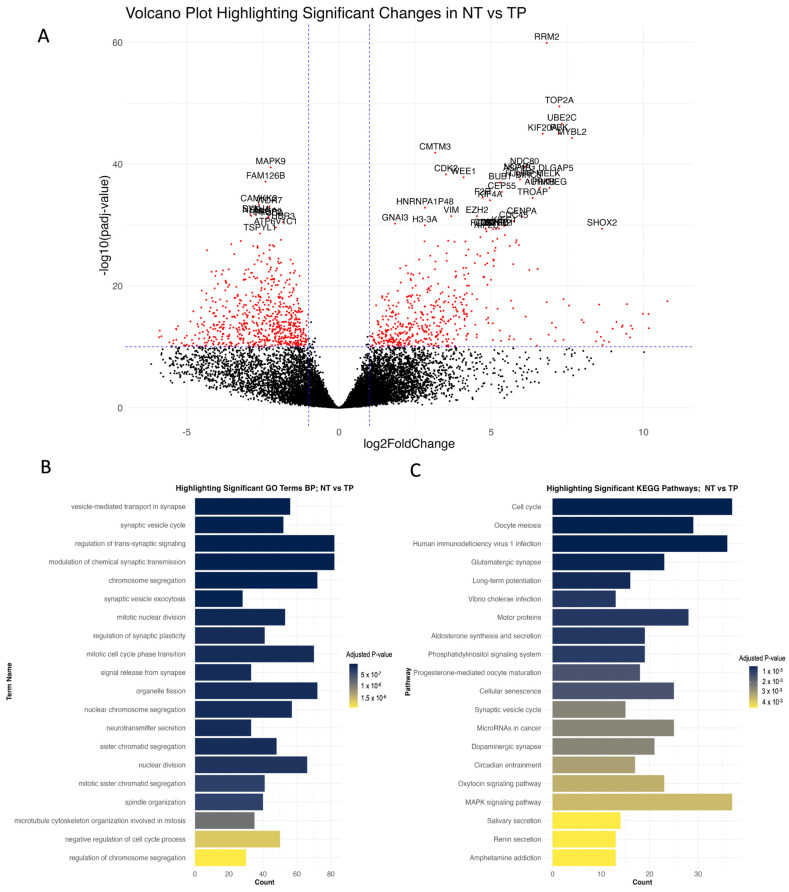
Figure 2.
Comparative analysis of gene expression and gene-set enrichment analysis in NT vs. TP conditions. (A): Volcano plot displaying comparative analysis results between NT and TP conditions. Red dots indicate genes that are significantly altered. (B): Bar chart detailing the top significantly altered biological processes in TP relative to NT, with the x-axis representing the number of significantly altered genes in each process. (C): Bar chart showing the top significantly altered KEGG pathways in TP compared with NT.

